Development of a Low-Cost Underwater Acoustic
Communication System
Dhesant Nakka Elvin Ruslim
Year 4 Year 4
School of Engineering
Department of Electronic
&
Computer Engineering Supervisedby
Professor Kam Tim WooSchool of Engineering
Department of Electronic
&
Computer EngineeringMarch 24, 2017
Abstract
Over 70% of the Earth's surface is covered with water, and yet we have only explored less than 10% of it. The reason this is so is because underwater exploration is hard. Most human divers can only go down to 40 meters [l], which is 1 % of the average depth of the oceans. On the other hand, underwater technology is very expensive, making underwater exploration highly prohibitive for the majority of the population. To combat this, we aim to create a low cost (under USD100) wireless underwater communication system using acoustic sensors, to c.reate more options for people to use for various applications, such as robotics, sensor networks, or recreational use.
In order to achieve a low cost system, we decided to leverage new technologies that have recently emerged. This includes Digital Signal Processing on an ARM-based platform, cheap piezoelectric transducers, and digital modulation techniques with error correction coding.
The development approach began by selecting a transducer, and deriving a set a constraints from the transducer specifications. We then use those constrains with simulations to determine which communication protocols would perform the best. Then, with these protocols, we then developed a real-world system using the technologies mentioned previously to create a working prototype that we could then evaluate.
From our prototype, we can conclude that this technique does have promise, as we were able to create a working communication system that is less than the target price, with reasonable performance. However, this performance can be greatly improved with further optimizations.
Contents
1 Introduction 1 2 Project Overview 1 2.1 Description . . . 1 2.2 Objectives . . . 2 2.3 Tasks . . . 2 2.4 Schedule . . . 2 2.5 Budget . . . 2 3 Existing Solutions 3 3.1 Radio Frequency . . . 33.2 Visible Light Communication . . . 4
3.3 Acoustic Communication . . . 4
3.4 Existing Acoustic Systems . . . 4
3.5 Summary . . . 4
4 Project Details 5 4.1 Protocol Design . . . 5
4.1.1 Transducer Selection . . . 5
4.1.2 Frequency Shift Keying . . . 5
4.1.3 Binary Phase Shift Keying . . . 6
4.1.4 Frame Specifications . . . 6 4.2 Simulation . . . 7 4.2.1 Overview . . . 7 4.2.2 FSK Simulation . . . 7 4.2.3 BPSK Simulation . . . 9 4.3 Hardware Design . . . 10 4.3.1 Transmission Amplifier . . . 10 4.3.2 Processing Modules . . . 11 4.4 FSK Software Design . . . 11 4.4.1 Transmitter Side . . . 11 4.4.2 Receiver Side . . . 12 4.4.3 Testing Results . . . 12 4.5 BPSK Software Design . . . 13 4.5.1 Transmitter Side . . . 13 4.5.2 Receiver Side . . . 13 4.6 Testing Results . . . 14 5 Project Evaluation 15 5.1 Future Works . . . 16 6 Summary 17 7 References 18
1
Introduction
Over 70% of the Earth’s surface is covered with water, and yet we have only explored less than 10% of it. The main reason we have explored very little of the oceans because it is very hard for human beings to explore underwater. The traditional way to explore underwater environments is by diving, but diving is a very rigorous process, requiring extensive training, while having severe limitations on maximum depth, typically less than 40 meters for non-specialized applications [1]. The other way to explore is to use underwater robots. Underwater robots are much more capable than divers, with a typical depth rating of 3000 meters [2]. However, because of their scarcity, they are typically custom built for a specific purpose, which makes them very expensive, costing millions of US dollars, making it very hard for anyone outside of a government organization, multinational company, or large research institute to use.
In recent years, this trend is starting to change, with the influx of cheap underwater robots starting to appear in the market [3, 4]. This can be attributed by the adaptation of new technologies developed for different industries in underwater robotics, such as improvements in battery capacity and electric motors from electric vehicles, motion sensors from smart phones, or advanced materials from automotive and aerospace industries. However, one area that has been lacking is the development of an low-cost commercially viable underwater communication system, as there is little overlap with other industries where existing research can be leveraged. Because of this, these new robots are tethered to a remote operator on shore, severely reducing the range and effectiveness of these machines.
The aim of this project is to create a low-cost underwater wireless communication sys-tem using acoustic transceivers. Acoustic waves have favorable properties when underwater, where they can travel for thousands of miles, whereas more common wireless communication methods, such as Radio Frequency (RF) or Visible Light Communication (VLC) can only travel for a few hundred meters. Based on this observation, acoustic waves could be used to create a low-cost underwater communication system, greatly increasing the versatility of an underwater robotics platform, or allowing for the creation of vast sensor networks without significant cost, resulting in greater, more flexible exploration opportunities.
2
Project Overview
2.1
Description
As stated in the introduction, the aim of this project is to create a low-cost underwater wireless communication system using acoustic transceivers. We believe this is necessary because there is no low-cost solution that already exists in the market for a similar system. With our proposed system, a researcher would be able to easily deploy a sensor network without having to create a large web of cabling between each sensor node. Furthermore, these nodes could be dynamically assigned and reconfigured, which increases the power and flexibility of such as system for any research applications. Another example would be in the case of micro-class underwater robots. These robots could use our proposed system to create a network between each of them, allowing for dynamic task allocation between each of the robots, or wireless communication between the robot and the operator, allowing for greater flexibility.
In order to achieve the goal of low-costs, we shall leverage existing products and technolo-gies in order to gain the most value proposition. This equates to utilizing commercially avail-able piezoelectric based ultrasonic transducers, combined with a low-power high-performance
ARM-based microcontroller, specifically the STM32F4-series microcontroller, which allows for Digital Signal Processing (DSP) algorithms to be used. By using DSP, we are able to remove the vast majority of analog components from the design, simplifying it exponentially, and reducing the cost. DSP also allows for the design to be very flexible, as the protocol definition is done entirely in software, and can be reconfigured instantly without any costly hardware changes.
2.2
Objectives
In order to undertake and evaluate the project, we must first define a series of objectives that we are aiming for. As stated in the project title, the main objective for this project is to build a low cost communications system, but this is a very vague objective that leaves a lot of room for error, and cannot be adequately evaluated at the end of the project. Therefore, we have created a more specific list of objectives below;
• The communications system should work at distances of at least 20 meters. • The communications system should have a per unit cost of less than USD100. • The communications system should have a bit error rate of no more than 10%.
• The communications system should be able to transmit of at least 200 bits per second.
2.3
Tasks
To be able to complete this project, a number of tasks must be finished, which can be seen as milestones in the development of the project. These tasks are described below.
• Research existing solutions to gain a better context. • Define protocol constraints from available components.
• Simulate various protocols in MATLAB to determine the optimum protocol. • Design and manufacture the hardware & software for a prototype device. • Test the prototype in a real-world scenario.
• Evaluate the performance of the prototype.
2.4
Schedule
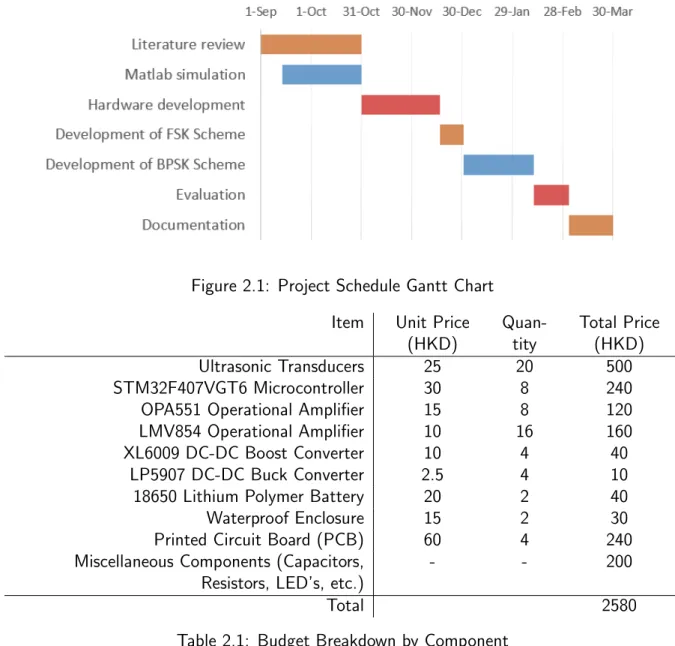
Based on the tasks listed in the previous section, we can then create a schedule for the project, shown in Figure 2.1. This details all the tasks that need to be performed before the project is complete, and the time frame that we have defined to accomplish it.
2.5
Budget
Table 2.1 shows the budget breakdown for the entire project. Based on the breakdown, we expect that the project will cost a total of just under HKD2600, which accounts for the equipment that is needed for testing, as well as the component costs for the various prototypes.
Figure 2.1: Project Schedule Gantt Chart Item Unit Price
(HKD) Quan-tity Total Price (HKD) Ultrasonic Transducers 25 20 500 STM32F407VGT6 Microcontroller 30 8 240
OPA551 Operational Amplifier 15 8 120
LMV854 Operational Amplifier 10 16 160
XL6009 DC-DC Boost Converter 10 4 40
LP5907 DC-DC Buck Converter 2.5 4 10
18650 Lithium Polymer Battery 20 2 40
Waterproof Enclosure 15 2 30
Printed Circuit Board (PCB) 60 4 240
Miscellaneous Components (Capacitors, Resistors, LED’s, etc.)
- - 200
Total 2580
Table 2.1: Budget Breakdown by Component
3
Existing Solutions
There are three main communications media that can be used in underwater applications. These are radio frequency, visible light, and acoustic wave, which are analyzed below to see what their comparative advantages and disadvantages are.
3.1
Radio Frequency
Radio Frequency (RF) communication is based on modulating data onto radio waves, which are then propagated through the chosen communication medium. RF is commonly used for wireless communication in air and space. However, when using RF in underwater commu-nications, it does not perform as effectively as it does in air. This is because water has a lot of mass, which absorbs the radio waves faster than radio waves in air, which results in a transmission range in the order of tens of meters, where a similar system in air can go for thousands of meters [5]. This means that the power requirements for using RF for underwater communication will be very high, resulting in a high system cost and lower battery life, which are not favorable properties for use in sensor networks or robotics applications.
3.2
Visible Light Communication
Visible Light Communication (VLC) is based on modulating data onto light waves, and in some ways, is very similar to RF communication. However, similar to RF, power requirements is also a concern. Although VLC can provide excellent data rate over a short distance, the underwater environment also absorbs the light waves much faster than in air [6], which increases the power requirements of a underwater VLC system. Moreover, VLC might have other unintended consequences, as it operates in the visible light spectrum, which can be perceived by humans and marine life. With the high power requirements necessary for communication, this could have adverse effects on both human operation, and marine life, which is highly undesirable for fragile environments.
3.3
Acoustic Communication
Acoustic communication is the process of transmitting data using acoustic waves. For under-water communication, acoustic waves are an ideal choice, especially when compared to RF and VLC, as it does not get attenuated as fast as RF or VLC, meaning it takes less power to transmit the same data as RF or VLC, and it does not have as many environmental side effects as VLC as long as certain constraints are met. Moreover, acoustic waves can be easily processed using audio processing technology derived from the music industry, making it a very mature technology.
3.4
Existing Acoustic Systems
The potential of acoustic communication for underwater applications has already been ac-knowledged by several researchers and organizations [7]. However, most commercially avail-able underwater acoustic communication systems cost thousands of US dollars [8].
WHOI has developed a cheap version of acoustic modem which is very reliable and has become popular among underwater researchers [9]. They have published their hardware and software design as an open source project. This project has been in development for 20 years and has been used in a wide variety of applications, such as controlling underwater vehicle. This project focuses on long range communication, thus consumes a large amount of power and is not suitable for applications like sensor networks and diver communication. The price of the WHOI modem is also far above our targeted price due to its high performance specifications.
Another notable effort to produce a low cost underwater acoustic modem is [8]. They successfully built a wireless communication system using ultrasonic acoustic waves which costs around USD300, which is considered very low compared to the available commercial modems, which cost thousands of US dollars. This device was created in 2010, employing Field Processing Gate Arrays (FPGAs) to transmit and receive the signal through custom-made transducer. They use an FPGA as Digital Signal Processors (DSP), to process the incoming signal, and as a microcontroller to decode the processed signal. This work could be considered as successful since it reduced the system to hundreds of dollars. However, with the latest advancements in technology, it is possible to create a more optimized system design.
3.5
Summary
Acoustic communication has a lot of benefits when compared to RF or VLC, they have the lowest attenuation in water, and therefore do not need as much power to send the same
information as RF or VLC. The potential of the acoustic channel as a wireless underwater communication method has been realized by some commercially available devices. However, the high price of these devices prevent the widespread adoption of this technology that is impeding the development of underwater exploration. With that being said, there has been some improvement in this respect, such as [8] and [9], but there is still room for further growth in this area.
4
Project Details
This section describes the procedure that was followed during the implementation of the prototype, as well as any constraints or goals that dictated certain design decisions.
4.1
Protocol Design
The first step in creating the project prototype is to define what the communications protocol will be. The protocol is derived from a number of factors, but it is mostly derived from the constraints derived from the ultrasonic transducers. With these constraints, we can define the protocol that will be implemented on the prototype, as well as a data frame specification that will be used for testing purposes.
4.1.1 Transducer Selection
One of the major restrictions on the project is the availability of underwater ultrasonic trans-ducers, and the specifications of such transducers. As such, a lot of the design decisions were made with regards to the specifications of the available ultrasonic transducers. We chose to use the 400EP18A from Pro-Wave, as it is available for purchase at a suitable cost and quan-tity from various Chinese resellers. The specifications for the transducer, as seen in Table 4.1 [10], show that the transducer operate at a frequency at 40kHz with a bandwidth of 1.5kHz. Therefore, all the chosen communication protocols are designed with a central frequency of 40kHz, and a bit rate which will ensure the symbol rate is less than 1.5kHz.
Parameter Value
Center Frequency 40.0 ± 1.0kHz Bandwidth (−6dB) 1.5kHz
Transmitting Sound Pressure Level 108dB min. Receiving Sensitivity −75dB min.
Nominal Impedance 750Ω Ringing 1.2ms max. Capacitance at 1kHz ± 20% 2600pF Max Driving Voltage (Cont.) 100Vrms
Total Beam Angle (−6dB) 85◦
Table 4.1: Specifications for 40kHz Piezoelectric Ultrasonic Transducer 4.1.2 Frequency Shift Keying
The first modulation scheme that was chosen is based on Frequency Shift Keying (FSK), specifically Binary Frequency Shift Keying (BFSK). BFSK works by transmitting at a different
frequency depending on the input data, with one frequency to represent the bit ”1”, known as the Mark Frequency, and another frequency to represent the bit ”0”, known as the Space Frequency. The advantage of using BFSK is that it is trivial to build a non-coherent receiver for BFSK, which simplifies the receiver design exponentially, as there is no longer a need to perform carrier recovery. However, this does have a large performance penalty, as there is a +3dB gain in noise due to the non-coherent nature of decoding.
As stated in the objectives, we are aiming for a bit rate of at least 200 bits per second, so to account for some overhead losses, we added a 20% safety margin, and therefore, our proposed bit rate is 242 bits per second, which equates to a symbol time of 4.13ms. This, combined with the transducer specifications seen in Table 4.1, result in the specification for the FSK modulation scheme shown in Table 4.2.
Parameter Value Mark Frequency 41kHz Space Frequency 39kHz Symbol Time 4.13ms Sampling Rate 160kHz
Table 4.2: Specifications for FSK-based modulation scheme 4.1.3 Binary Phase Shift Keying
The second modulation scheme that has been chosen is based on Binary Phase Shift Keying (BPSK). BPSK works by changing the phase of the transmitted wave based on the binary data. For the bit ”0”, the phase offset is 0, and for the bit ”1”, the phase offset is π. Compared to FSK, BPSK has a better noise margin than FSK, with a +3dB gain in signal to noise ratio (SNR), due to the use of coherent decoding. However, because BPSK requires a coherent decoder, carrier recovery is necessary, which increases the complexity of the receiver design. The specifications for the BPSK protocol are similar to the FSK protocol, with the same symbol time and center frequency because of the defined objectives, although further optimizations can be made in the future. These specifications are listed in Table 4.3
Parameter Value Center Frequency 40kHz
Symbol Time 4.13ms Sampling Rate 200kHz
Table 4.3: General Specifications for BPSK-based modulation scheme 4.1.4 Frame Specifications
In order to ensure high reliability for the initial prototype, the frame structure shown in Table 4.4 is chosen. This structure is used because it provides 3 bits of data for every 12 bits, which is reasonably efficient, while also allowing for a minimum Hamming distance of 4. With a minimum Hamming distance of 4, we can detect up to 3 bit errors, or correct one bit error. We deliberately chose to trade off efficiency for redundancy, to ensure that the prototype is as accurate as possible, after which optimizations can be made to improve the protocol in this respect.
Start Bit Data Even Parity
0 1 1 1 1 a b c a ⊕ b b ⊕ c a ⊕ c a ⊕ b ⊕ c
Table 4.4: Frame Specifications for the communication protocols
4.2
Simulation
4.2.1 Overview
With the protocols defined in Section 4.1, the next step in the project is to simulate the chosen protocols to determine how these protocols would be implemented, and the performance we should expect from them. To perform the simulations, we chose to use MATLAB , as it has many libraries that speed up the development time of the simulation, and we have a large amount of experience with it.
For the simulation, the underwater channel is modeled with an Additive White Gaussian Noise (AWGN) model, where a each sample in the waveform is summed with a random noise source, modeled as an white Gaussian noise source. However, a more appropriate model would be that of a Tapped Delay Line (TDL) model, which more accurately represents the underwater channel, as there are a lot of multi-path components in the underwater channel. An AWGN model is used for the simulation because there is no usable data for a TDL model, as the model depends highly on the testing environment, and without a prototype to generate testing data, there is no method to construct the model.
4.2.2 FSK Simulation
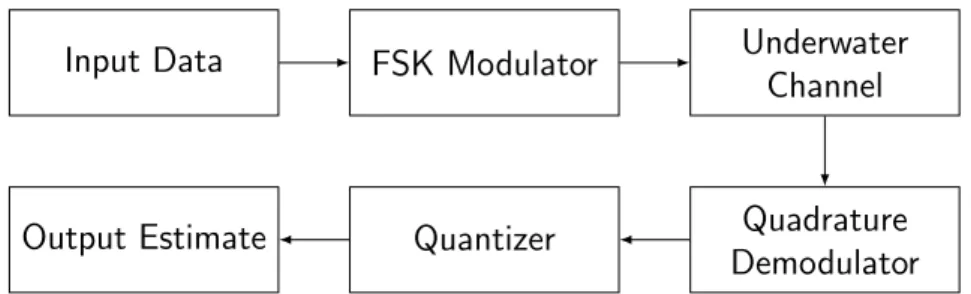
Input Data FSK Modulator Underwater
Channel
Quadrature Demodulator Quantizer
Output Estimate
Figure 4.1: Block Diagram for MATLAB FSK Simulation
Design Figure 4.1 shows the block diagram for the FSK simulation. Based on the specifica-tions from Table 4.2, the FSK Modulator turns the binary input data directly into a modulated waveform, where the length of each symbol is derived from the sampling rate and the symbol time, and the frequency is derived from the input data and the mark/space frequencies. The generated waveform is then passed through the Underwater Channel, which adds a random noise source to each sample based on an assumed Signal to Noise Ratio (SNR) of 10dB. 10dB is used as the power level as it is considered a reasonable minimum power level for accurate data transmission for our purposes The modified waveform is then passed to a quadrature demodulator, where a analog signal is created that corresponds to the desired binary output. Finally, a binary estimate is made from the analog signal using the quantizer, which takes a array of the analog signal, and estimates the binary data based on the average of those samples, where the length of the array is derived from the sampling rate and symbol time, similar to the FSK modulator.
Input waveform Bandpass Filter Multiplier Lowpass Filter Output waveform 90◦ Delay
Figure 4.2: Block Diagram for MATLAB FSK Quadrature Demodulator
Then advantage of using FSK is the non-coherent quadrature demodulator, which can be seen in Figure 4.2. The quadrature demodulator works by first removing excess noise using the Bandpass Filter. It then generates a 90◦ phase offset by taking advantage of the sampling frequency being four times the center frequency by delaying by one symbol. By multiplying the original and offset signal together, and taking the low pass the generated signal, a waveform can be generated that can be used to derive the bit sequence.
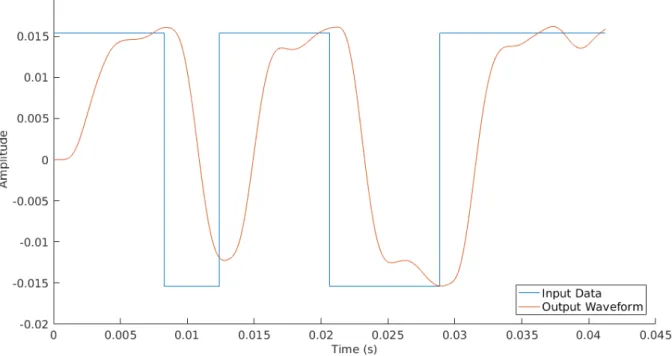
Testing To test the FSK protocol, an random binary input data source was created with a length of 10,000 bits. This was then passed through the FSK simulation depicted in Figure 4.1, and the output estimate was compared to the input data source to get an estimate for the bit error rate. The simulation results demonstrate a bit error rate (BER) of 0.001 at signal to noise ratio of 10dB, which can be determined to be suitable for use in the real-world prototype.
Figure 4.3: Sample plot of the received waveform from MATLAB FSK simulation Figure 4.3 shows an example of what the input binary data looks like compared to the output derived from the Quadrature Demodulator. The output of the Quadrature Demod-ulator can be seen to be a delayed version of the input binary data, with some variations in amplitude, which shows that the Quadrature Demodulator can be used in the real-world prototype to create a non-coherent receiver, with suitable BER characteristics.
Summary In summary, the FSK simulation in MATLAB demonstrates that the protocol specified in Table 4.2 is feasible to implement, and that at for a reasonable transmission power (10dB), the received data can be accurate 99.9% of the time, which is very suitable for a communications system. However, there are many effects that have not been included in the simulation that can vary the results in a real-world experiment.
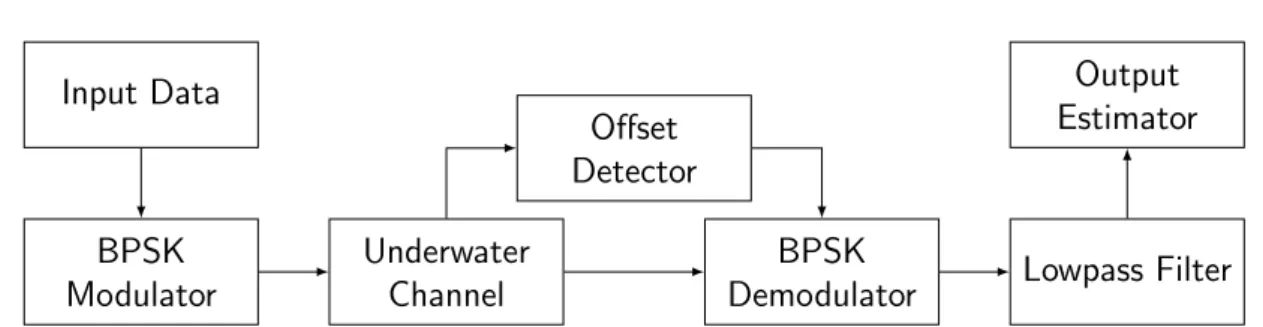
4.2.3 BPSK Simulation Input Data BPSK Modulator Underwater Channel Offset Detector BPSK
Demodulator Lowpass Filter Output Estimator
Figure 4.4: Block Diagram for MATLAB BPSK Simulation
Design Figure 4.4 shows the block diagram for the BPSK simulation. First, a random binary input data source is randomly generated with a constant starting pattern of 13 bits. The input data is then directly modulated to a BPSK waveform using the parameters from Table 4.3. This waveform is then passed through the underwater channel model. Using the constant starting pattern, the offset detector convolves a pre-computed pattern against the simulated received waveform, to detect the position of the start of a transmission. This is then passed to the BPSK Demodulator, which uses the position as an offset when multiplying the received signal with a 40kHz sine wave. This, combined with the low-pass filter, performs the demodulation operation. Finally, the bit estimator takes a mean of an array of samples to calculate the estimate of the transmitted bit.
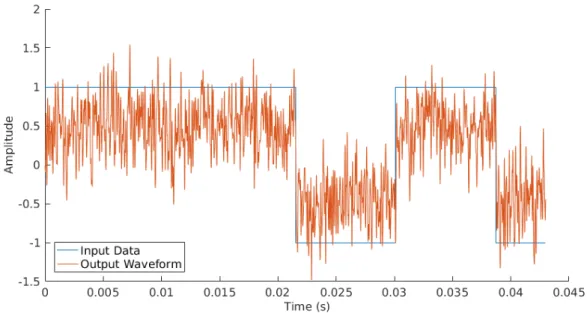
Testing To test the BPSK protocol, a random binary input data was created with a length of 10,000 bits. This was then passed through the BPSK simulation depicted in Figure 4.4, and the output estimate was compared to the input data source to get an estimate for the bit error rate (BER). The simulation results demonstrate a bit error rate of 0, which shows that the BPSK protocol is well suited for real-world testing with a signal to noise ration of 10dB. Figure 4.5 shows an example of what the output data stream is for the BPSK simulation. The output of the BPSK simulation has a lot more noise than the FSK simulation, because of the possible phase delay, but there is a clear distinction between a bit ”1” and bit ”0”. This shows that this technique can be used for BPSK decoding on the prototype.
Summary In summary, the BPSK simulation in MATLAB demonstrates that the protocol specified in Table 4.3 is feasible to implement, and that at for a reasonable transmission power (10dB), the received data can be accurate 100% of the time. This is ideal for a communications system. However, there are many effects that have not been included in the simulation that can vary the results in a real-world experiment, so this figure should be verified with testing.
Figure 4.5: Sample plot of the received waveform the MATLAB BPSK simulation
4.3
Hardware Design
In this section, the design, implementation, and verification of our hardware design will be discussed. The hardware design consists of 3 different modules. The transmission amplifier, the reception amplifier, and the processing modules. The processing modules is where the STM32F4 microcontroller is placed, and is responsible for generating an output signal, or decoding the input signal, depending on whether the processing module is connected a trans-mission or reception amplifier. The transtrans-mission amplifier boosts the generated signal from 3V from the microcontroller, to 30V for the transducer. The reception amplifier boosts the received signal from 10mV to 3V so the microcontroller can process it.
4.3.1 Transmission Amplifier
Figure 4.6: Schematic of the inverting amplifier circuit
from the microcontroller to the transducer, the first item would be a low-pass filter formed by R7 and C10, this removes and high-frequency components from the signal that could damage the amplifier or transducer, while also allowing the amplifier to be driven from square wave sources. The signal is then fed to the inverting input of the amplifier though a DC blocking capacitor (C2), the capacitor is used (C2) to both protect the processor from any feedback that can arise from the amplifier stage, and to ensure the maximum possible amplification of the signal. A feedback loop is created using C6, R3, and R4, which sets the gain for the system, using the formula A = R4R3. In this circuit, this has a gain of 9V/V, so for a 3.3V input signal, the output will be a 30V, which is used to drive the ultrasonic transducer. A model of the transducer is shown in the schematic, formed by L1, C8, C9, and R6.
4.3.2 Processing Modules
We chose to use the STM32F407 microcontroller because wide variety of features at a rea-sonable price. It features a Floating Point Unit (FPU), three 12-bit ADCs (Analog to Digital Converter), two DACs (Digital to Analog Converter), a DMA (Direct Memory Access) con-troller, hundreds of GPIO (General Purposes Input Output) ports, multiple hardware timers, and several communication interfaces, not to mention the fast processor. These features are crucial for our communication application as we need to sample analog signals in a timely manner and process them in the microcontroller to get the information that is being sent.
On the receiver board, two operational amplifiers are used in a 2-stage 40kHz bandpass configuration to amplify and filter the received signals from the ultrasonic transducer to the microcontroller’s ADC. The amplification is needed since the voltage received from the transducer is around 10mV to-peak, but the microcontroller needs a voltage of 3V peak-to-peak. A bandpass circuit is used to filter out extra noise to improve the quality of the signal.
On the transmitter board, we integrate a DC-DC Boost Converter to supply a 30V for the transmission amplifier. The waveform is generated using the microcontroller’s timers or DAC, and is then passed through the transmission amplifier described in Section 4.3.1 to the ultrasonic transducer.
4.4
FSK Software Design
Using the hardware architecture defined in Section 4.3, we have all the pieces necessary to create a full communications system using Digital Signal Processing (DSP). To aid with this process, the chosen microcontroller, the STM32F407, has both a DSP library and a floating point computation unit (FPU)[11]. The DSP library is helpful because implements many common algorithms, such as Finite Impulse Response filters, Infinite Impulse Response filters, Fast Fourier Transforms [12].
4.4.1 Transmitter Side
The software implementation on the transmitter side uses a very simple hardware accelerated setup. The hardware UART module is used as the binary source, as it provides a binary input source that can dynamically be assigned the input. This input is parsed in the main loop of the software to create the bit stream that is used to setup the waveform generation.
The waveform is generated using a combination of a hardware timer, Digital to Analog Converter (DAC), Direct Memory Access (DMA) controller, and a sine wave look-up table. The look-up table contains 20 data points to generate a smooth sine wave, which are formatted
for use directly with the DAC. The DMA controller is setup to push the values from the look-up table to the DAC, triggered by the hardware timer. The hardware timer is setlook-up so that it triggers at 39 × 20kHz, 41 × 20kHz, or not at all. By setting the hardware timer to the three different states, the DAC will either output a sine wave at 39kHz, 41kHz, or not at all, which produces the FSK modulated waveform that can be sent to the transmission amplifier, and then to the ultrasonic transducer.
4.4.2 Receiver Side
The software implementation on the receiver makes use of a wide variety of hardware features on the STM32F407 microcontroller to implementing the quadrature decoding algorithm. The design uses a constant decoding system, so that once it is initialized, it constantly outputs a bit estimate based on the waveform from the ultrasonic transducer.
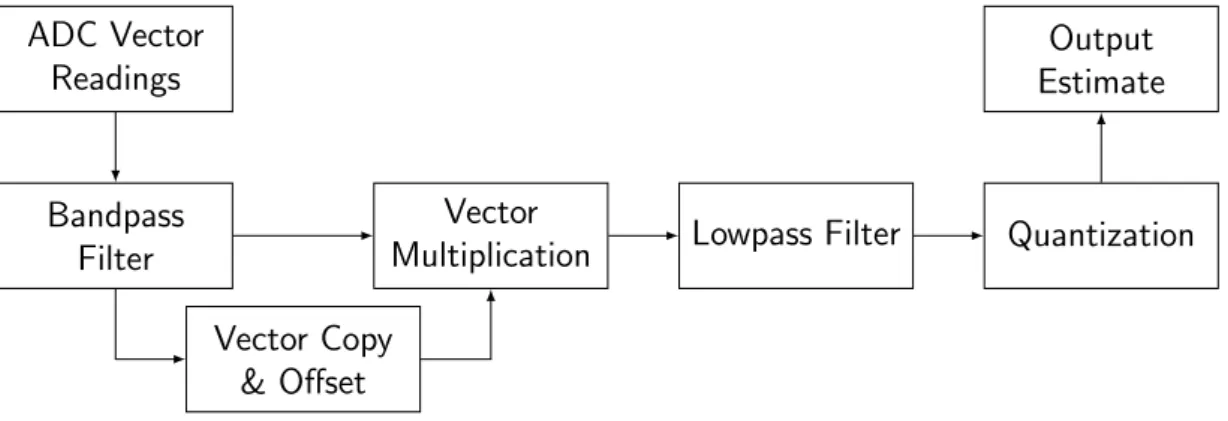
The receiver works in a similar fashion to the transmitter. A hardware timer is initialized to update at 160kHz, which triggers the DMA controller. The DMA controller is setup to get an ADC reading every time the hardware timer is triggered, and once 660 readings are collected, the resulting vector is passed onto the Quadrature Demodulation function. 660 readings are required because that is equal to 4.13ms worth of samples at the sampling rate of 160kHz. ADC Vector Readings Bandpass Filter Vector Copy & Offset Vector
Multiplication Lowpass Filter Quantization Output Estimate
Figure 4.7: Block diagram for the Quadrature Decoding function
Figure 4.7 shows the Quadrature Demodulation function used on the receiver module. Similar to the implementation used in the FSK simulation, the 660 ADC readings are passed to the function as a vector reading, when is then passed to a 40kHz Bandpass filter, using the Finite Impulse Response (FIR) filter in the DSP library. The output of the filter is then copied with a one sample delay to form the two vectors that are needed. These two vectors are multiplied together, and the result passes through another FIR filter, this time a low pass filter. Finally, a bit estimate is generated by finding the mean of the 660-length vector, and determining the bit estimate based on the value of the mean.
4.4.3 Testing Results
After initial testing with the full hardware and software setup, it was determined that FSK cannot be used. In Figure 4.8, it can be seen that the sensitivity and sound pressure level of the chosen transducer have different peaks, which causes non-linearities in the frequency domain for the communications channel. This causes problems with FSK, because FSK assumes that the frequency response of the channel is flat. In order to utilize FSK, channel estimation and equalization needs to be performed before useful data can be received, which eliminates
Figure 4.8: Sensitivity/Sound Pressure Level for the 400EP18A ultrasonic transducer [10] any benefits that FSK has over BPSK. Because of this, the FSK design is scrapped, and the testing and evaluation will be performed on the BPSK design only.
4.5
BPSK Software Design
The software discussed in this section is all being implemented on STM32F407. In this section, the software implementation of BPSK modulation on transmitter side and BPSK demodulation on the receiver side will be discussed.
4.5.1 Transmitter Side
Unlike the FSK implementation, the software implementation of the BPSK transmitter uses a much simpler setup. The BPSK signal uses a hardware timer setup at 80kHz to generate the signal, by toggling the output every time the timer is triggered. The data is modulated in this fashion by inverting the signal whenever the input bit is ”1”, and keeping it normal when the input bit is ”0”. This results in a square wave output instead of the sine wave output from the FSK stage, which increases the bandwidth requirements and adds more noise to the channel. However, because BPSK operates at a fixed frequency, an low-pass filter based on the RC circuit is added before the signal is sent to the transmission amplifier, to create a sine wave output.
4.5.2 Receiver Side
Similar to the FSK implementation discussed earlier, the software implementation of the receiver makes use of the same timer, DMA, and ADC setup to obtain the input waveform. One of the STM32F4 hardware timers is setup to trigger at a rate of 200kHz, this timer triggers the DMA controller to take an ADC reading. Once 826 ADC readings are obtained, the DMA passes the resulting vector to the decoding software to get a bit estimate. 826 readings are required because that is 4.13ms worth of samples at the sampling rate of 200kHz.
Figure 4.4 shows the block diagram for the decoding algorithm. The algorithm works by first passing the first 15 readings to the Offset Detector, which convolves the readings
-50 -60 i-70 ·.; C: QJ (j) -80 i.-[....I V L-,,
v
~...
I I',I
l)
V
I
./
v
V VI'-~
~
rl.. I'-..1
,
I'-..
-
I'--
r--. r,.. I'--, 130 120co
~ 110 ::; a. (j) 100 -90 00 35 36 37 38 39 40 41 42 43 44 45 Frequency (Khz)ADC Vector Readings
Offset Detector
Downsampler Demodulator Phase
Calculator
Strength Calculator
Bit Es-timator
Figure 4.9: Block Diagram for the BPSK decoding algorithm
with a pre-computed sine wave, to calculate the phase offset of the input waveform. With the phase offset, the input data is then down-sampled to 100kHz by throwing away half the readings, to reduce the computation power required. Then, the down-sampled data is demodulated by multiplying it with a 40kHz sine and cosine wave. Each data point on the demodulated waveform can then be passed to the Phase & Strength calculators to get the phase and strength of each data point. The Bit Estimator uses the strength of the data points to determine whether an actual signal has been received, or whether the reading is just random noise. Once it passes a certain adjustable threshold, the phase of the data point is used to calculate whether a bit ”1” or a bit ”0” was sent. Finally, as an additional processing step, utilizing the frame specification defined in Section 4.1.4, the parity of each frame can be calculated, to ensure that valid data has been received and decoded by the module, and if not, either correct or remove that data point respectively.
4.6
Testing Results
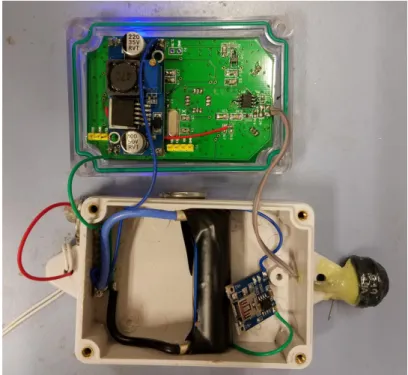
The BPSK software implementations has been tested in water by using a prototype remote control (shown in Figure 4.10) in various environments, including the air, a freshwater pool, and the sea. The board, the transducer, and battery are placed inside a waterproof box.
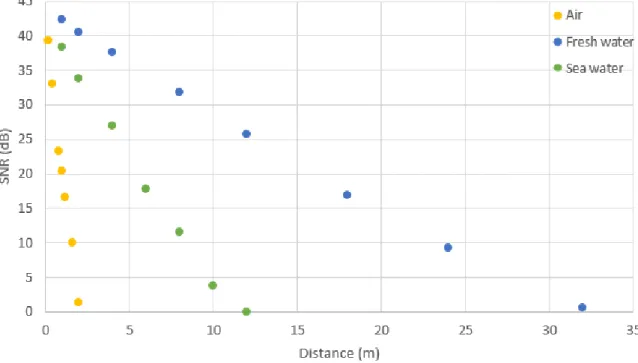
Figure 4.11 show the relationship between distance and Signal-to-Noise Ratio (SNR). It can be seen that air has the largest attenuation, while fresh water has the smallest attenuation. Although we have successfully achieve our target to transmit messages reliably over 20 meters in fresh water, we only able to transmit over 10 meters in sea water with zero frame errors. This zero frame errors means that we could transmit the packet with BER < 0.25 since the frame could detect up to 3 bits error per packet.
Figure 4.11: Distance vs Signal to Noise Ratio for three different media
5
Project Evaluation
Based on the objectives stated at the beginning of the project, we are able to evaluate the performance of our prototype, and define whether the project can be deemed successful or not, and what can be improved in the future.
The communications system should work at distances of up to 20 meters.
The communications system should have a bit error rate of no more than 10%. As shown in Figure 4.11, we are able to achieve a signal to noise ratio of approximately 15dB at a distance of 20 meters in fresh water. This represents frames that were received with no errors after parity checking. Due to the nature of our implementation, we do not have concrete bit error rate metrics, but instead need to infer bit error rate from the signal to noise ratio, simulation results, and the nature of the received data. Based on these factors, at a distance of 20 meters in fresh water, we can see a large number of intact packets being received and decoded correctly, which implies a bit error rate of less than 10%. This is further reinforced from our simulation results, which shows that our BPSK setup is able to achieve an error rate of 0%. Therefore, we can say that we able to achieve both of these objectives.
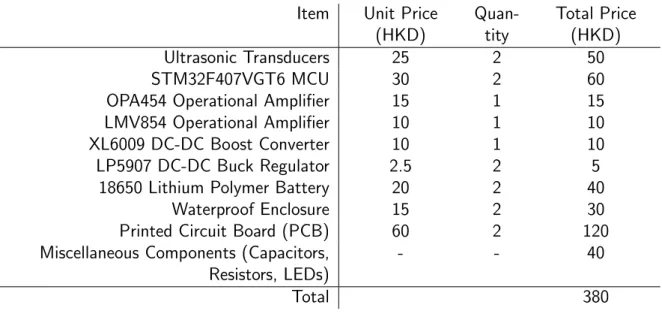
The communications system should have a per unit cost of less than USD100. From Table 5.1, we can find that the per unit cost for our prototype is HKD380, which is roughly USD50, which is well under the design target of USD100 that we set for ourselves. Therefore, in terms of cost, we can say that project is successful. Given that the per unit cost is USD50, we have a lot of room to improve the performance of this project.
Item Unit Price (HKD) Quan-tity Total Price (HKD) Ultrasonic Transducers 25 2 50 STM32F407VGT6 MCU 30 2 60
OPA454 Operational Amplifier 15 1 15
LMV854 Operational Amplifier 10 1 10
XL6009 DC-DC Boost Converter 10 1 10
LP5907 DC-DC Buck Regulator 2.5 2 5
18650 Lithium Polymer Battery 20 2 40
Waterproof Enclosure 15 2 30
Printed Circuit Board (PCB) 60 2 120
Miscellaneous Components (Capacitors, Resistors, LEDs)
- - 40
Total 380
Table 5.1: Bill of Materials for a single prototype setup
The communications system should be able to transmit of at least 200 bits per second. The prototype’s design is able to achieve a bit rate of 242 bits per second, which is well above the objective of 200 bit per second. However, this is still well below the theoretical limits of what is achievable with the chosen transducers of 1500 bits per second. This can be improved in future works.
5.1
Future Works
Since the per unit cost of the project is very low, the next generation of the design can have uprated components that are able to give better performance. These improvements are suggested below;
• Use ultrasonic transducers with a higher frequency and bandwidth for better bit rates. • Use a faster microcontroller for more complex modulation schemes which can improve
bit rates and bit error rates.
• Redesign the reception amplifier for lower noise thresholds.
6
Summary
The potential of wireless underwater communication is massive, with major implications on underwater exploration and research opportunities. While there are some solutions that are commercially available, the cost of these solutions are very high, precluding their widespread adoption in the underwater domain. This project aims to fill the gap in the market for a low-cost (under USD100) wireless underwater communication system, which can spearhead a new wave of underwater robots and sensors that can increase the accessibility of underwater environments for everyone, allowing for a better understanding of the oceans.
Our findings dictate that acoustic waves are the most suitable medium for underwater communication in this application, especially compared to RF and VLC. To reach our objective of creating an inexpensive communication system, we take advantage of advancements in technologies, especially Digital Signal Processing, which allows for the majority of the system to be implemented on a low-power high-performance STM32F4 ARM microcontroller, using Digital Signal Processing. This allows for the a large amount of flexibility with the same hardware, as a new protocol can be implemented with a software update, and reduces the cost of the hardware since not much analog circuitry is needed.
After some MATLAB simulations, we were able to implement a BPSK based protocol on the actual prototype, and were able to achieve real-world results of over 200 bits per second of data over 20 meters away with less than 10% error rate, all at a cost which is markedly less than our target of USD100. However, this comes after some setbacks, mostly with the FSK implementation, and the knowledge that the design can be optimized highly.
7
References
[1] A. Brylske, H. Averill, and K. Shreeves, The Encyclopedia of Recreational Diving. PADI, 2008.
[2] “Magnum Plus Spec Sheet,” Oceaneering International, Inc., 2016. [Online].R Available:
http://www.oceaneering.com/oceandocuments/brochures/rov/rov-magnumplus.pdf [3] “OpenROV Trident - An Underwater Drone for Everyone,” Kickstarter, Sep 2016.
[Online]. Available: https://www.kickstarter.com/projects/openrov/ openrov-trident-an-underwater-drone-for-everyone
[4] “Fathom One — The Affordable, Modular, HD Underwater Drone,” Kickstarter, Sep 2016. [Online]. Available: https://www.kickstarter.com/projects/1359605477/ fathom-one-the-affordable-modular-hd-underwater-dr
[5] L. Butler, “Underwater radio communication,” Amateur Radio, 1987. [Online]. Available: http://users.tpg.com.au/users/ldbutler/Underwater Communication.pdf [6] M. Lanzagorta, “Underwater communications,” Synthesis Lectures on
Communications, vol. 5, no. 2, pp. 32–37, 2012.
[7] S. Sendra, J. Lloret, J. M. Jimenez, and L. Parra, “Underwater acoustic modems,” IEEE Sensors Journal, vol. 16, no. 11, pp. 4063–4071, June 2016.
[8] B. Benson, “Design of a low-cost underwater acoustic modem for short-range sensor networks,” Ph.D. dissertation, University of California, San Diego, 2010.
[9] L. Freitag, M. Grund, S. Singh, J. Partan, P. Koski, and K. Ball, “The WHOI micro-modem: an acoustic communications and navigation system for multiple
platforms,” in Proceedings of OCEANS 2005 MTS/IEEE. IEEE, 2005, pp. 1086–1092. [10] “400EP18A Air Ultrasonic Ceramic Transducer,” Pro-Wave Electronic Corp., 2005.
[Online]. Available: http://www.prowave.com.tw/english/products/ut/ep/40ep18a.htm [11] “RM0090 Reference Manual: STM32F405/415, STM32F407/417, STM32F427/437
and STM32F429/439 advanced ARM -based 32-bit MCUs,” STMicroelectronics,R 2016. [Online]. Available:
http://www.st.com/content/ccc/resource/technical/document/reference manual/3d/ 6d/5a/66/b4/99/40/d4/DM00031020.pdf/files/DM00031020.pdf/jcr:
content/translations/en.DM00031020.pdf
[12] “CMSIS DSP Software Library,” ARM Limited, 2015. [Online]. Available: http://www.keil.com/pack/doc/CMSIS/DSP/html/index.html
![Figure 4.8: Sensitivity/Sound Pressure Level for the 400EP18A ultrasonic transducer [10] any benefits that FSK has over BPSK](https://thumb-ap.123doks.com/thumbv2/9libinfo/7431368.107617/15.892.182.711.112.395/figure-sensitivity-sound-pressure-level-ultrasonic-transducer-benefits.webp)