For Peer Review Only
Production and diagnostic application of a purified, E. coli-expressed, serological specific chicken anemia virus antigen
VP3
Journal: Journal of Veterinary Medicine Series A Manuscript ID: TBED-OA-096-10
Manuscript Type: Original Article Date Submitted by the
Author: 06-Oct-2010
Complete List of Authors: Lee, Meng-Shiou; China Medical University, School of Chinese Medicine Resources
Chou, Yu-Mei; China Medical University, School of Chinese Medicine Resources; China Medical University, School of Chinese Medicine Resources
Lin, Ming-Kuem; China Medical University, School of Chinese Medicine Resources; China Medical University, School of Chinese Medicine Resources
Chang, Wen-Te; China Medical University, School of Chinese Medicine Resources
Lien, Yi-Yang; National Pingtung University of Science and Technology, Dept. of Veterinary Medicine
Lee, Meng-Shiunn; Tung’s Taichung MetroHarbor Hospital, Department of Medical Research
Lai, Guan-Hua; China Medical University, School of Chinese Medicine Resources
Chen, Hsi-Jien; MingChi University of Technology, Dept. of Safety, Health and Environmental Engineering
Lin, Wen-Hsin; China Medical University, School of Pharmacy Undergraduate Program, Master Degree Program, Ph.D Program Subject Area: Diagnostics, Virus, Assay
For Peer Review Only
Production and diagnostic application of a purified, E. coli-expressed,
1
serological specific chicken anemia virus antigen VP3
2
Meng-Shiou Lee1ψ*, Yu-Mei Chou1ψ, Ming-Kuem Lin1, Wen-Te Chang1, Yi-Yang 3
Lien2, Meng-Shiunn Lee 3, Guan-Hua Lai 4, Hsi-Jien Chen5, Wen-Hsin Lin 6ξ*, 4
Chi-Hung Huang 4ξ* 5
1
School of Chinese Medicine Resources, China Medical University, Taichung, Taiwan; 6
2
Dept. of Veterinary Medicine, National Pingtung University of Science and 7
Technology, Pingtung, Taiwan; 3 Department of Medical Research, Tung’s Taichung 8
MetroHarbor Hospital, Taichung,Taiwan; 4Institute of Biochemistry, College of Life 9
Science, National Chung Hsing University, Taichung, Taiwan; 5Dept. of Safety, 10
Health and Environmental Engineering, MingChi University of Technology, Taipei, 11
Taiwan; 6China Medical University, School of Pharmacy Undergraduate Program, 12
Master Degree Program, Ph.D Program, Taichung, Taiwan; 7Graduate school of 13
Biotechnology, Hung kuang University, Taichung, Taiwan. 14
ψ
These authors contributed equally to this work. 15
*Correspondence: Meng-Shiou Lee, School of Chinese Medicine Resources, 16
China Medical University, Taichung 40402, Taiwan. 17
E-mail: [email protected]; Telephone: +886-4-2205-3366#5208; Fax: 18
+886-4-22078083. 19
ξ*Co-correspondence: Dr. Chi-Hung Huang. and Dr. Wen-Hsin Lin 20
Dr. Chi-Hung Huang, Graduate school of Biotechnology, Hung kuang University, 34 21 3 4 5 6 7 8 9 10 11 12 13 14 15 16 17 18 19 20 21 22 23 24 25 26 27 28 29 30 31 32 33 34 35 36 37 38 39 40 41 42 43 44 45 46 47 48 49 50 51 52 53 54 55 56 57 58 59 60
For Peer Review Only
Chung-Chie Rd, Sha Lu, Taichung, Taiwan. 1
E-mail: [email protected]; Telephone: +886-4-2284-0468#222; Fax: 2
+886-4-22853487. 3
Dr. Wen-Hsin Lin, China Medical University, School of Pharmacy Undergraduate 4
Program, Master Degree Program, Ph.D Program, Taichung, Taiwan. 5
E-mail: [email protected]; Telephone: +886-4-2205-3366#5111; Fax: 6 +886-4-22078083. 7 8 9 Summary 10
The aim of this study was to evaluate the production of chicken anemia virus VP3 11
protein in different E. coli strains and to address the diagnostic application of purified 12
E. coli expressed VP3 protein for the detection of CAV infection and the development 13
of an ELISA kit. Three E. coli strains, BL21, BL21 codonplus RP and BL21 pLySs, 14
each harboring a VP3 protein expressing plasmid, were investigated after induction to 15
produce recombinant VP3 protein. After IPTG induction, VP3 protein was 16
successfully expressed in all three E. coli strains. The BL21 pLySs strain gave the 17
best performance in terms of protein productivity and growth profile. In addition, the 18
optimal culture temperature and IPTG concentration were found to be 0.25 mM and 19
20℃, respectively. Using Ni-NTA-purified VP3 protein as an ELISA coating antigen, 20
the purified VP3 was shown to be highly antigenic and able to discriminate sera from 21
chickens infected with CAV from those that were uninfected during an evaluation of 22
CAV infection serodiagnosis. A VP3-based ELISA demonstrated 100% (6/6 × 100%) 23
specificity and sensitivities of 91.3% (21/23 × 100%) and 82.6% (19/23 × 100%) 24
using cut-off values of the mean plus 2 S.D. and the mean plus 3 S.D., respectively. 25 3 4 5 6 7 8 9 10 11 12 13 14 15 16 17 18 19 20 21 22 23 24 25 26 27 28 29 30 31 32 33 34 35 36 37 38 39 40 41 42 43 44 45 46 47 48 49 50 51 52 53 54 55 56 57 58 59 60
For Peer Review Only
Keywords: chicken anemia virus, VP3, recombinant protein, production, diagnosis 1
2
Introduction 3
Chicken anemia virus (CAV) is an important veterinary pathogen worldwide that 4
infects young chickens. This virus was first isolated in Japan and has been identified 5
as the major chicken anemia agent responsible for the induction of various clinical 6
disease including anemia, aplasia of bone marrow and atrophy of thymus (Adair, 7
2000). The virus belongs to the genus Gyrovirus of the family Circoviridae and 8
contains a circularized negative sense single-stranded DNA genome of about 2.3 kb, 9
which consists of three open reading frames (ORFs) (Claessens et al., 1991; Kamada 10
et al., 2006; Koch et al., 1995). The three ORFs respectively encode VP1 (51 kDa), 11
VP2 (28 kDa) and VP3 (13 kDa), which partially overlap on the CAV genome. 12
During CAV infection, the accumulation of VP2 and VP3 in host cell has been 13
reported to occur within 12 hours post infection, while VP1 is detected only after 24 14
hours (Lucio et al., 1990). Epidemiological studies have shown that almost all 15
new-born chicks are susceptible to CAV infection (Deng et al., 2009). Generally, 16
young chicks less than two weeks old are very susceptible to CAV infection through 17
the vertical transmission. In Taiwan, a mortality rate as high as 55% and a morbidity 18
rate of 80% have been reported when chicks are infected with CAV (Hsu et al., 2002). 19
Therefore, the monitoring of CAV infection is a critical step when controlling CAV 20
infection. 21
At present, there are several conventional methods that can be used to 22
diagnose the CAV pathogen (McNulty et al., 1989 & 1990; Noteborn et al., 1991 & 23
1998; Brentano et al., 2005; Iwata et al., 1998). Enzyme-linked immunosorbent assay 24
(ELISA) is a popular assay for detecting CAV infection and screens for CAV-specific 25
antibodies in the sera of the chickens (McNulty et al., 1990; Noteborn et al., 1991; 26 3 4 5 6 7 8 9 10 11 12 13 14 15 16 17 18 19 20 21 22 23 24 25 26 27 28 29 30 31 32 33 34 35 36 37 38 39 40 41 42 43 44 45 46 47 48 49 50 51 52 53 54 55 56 57 58 59 60
For Peer Review Only
Iwata et al., 1998). However, the propagation of CAV in cell culture or chicks is not 1
convenient, is time-consuming and has a low yield. Moreover, virion purification is 2
also a tedious and cost-ineffective process. Therefore, DNA recombinant technology 3
has been chosen as a better way to produce CAV viral protein for use as an ELISA 4
antigen. Previously several expression systems, including E. coli, baculovirus-insect 5
cells and plant cells, have been exploited to express CAV viral proteins (Noteborn et 6
al., 1991; Iwata et al., 1998; Lacorte et al., 2007; Wang et al., 2007; Pallister et al., 7
1994; Lee et al., 2009). Among these, the E. coli expression system is easier to 8
operate and more economic to apply for viral protein production. In terms of 9
cytotoxicity, it is still difficult to express full-length VP1 protein in E. coli because 10
this protein is rich in highly charged amino acids (Pallister et al., 1994; Lee et al., 11
2009). Therefore, VP2 and VP3 protein expression in E. coli has been employed in a 12
number of previous studies. Among these two non-structural proteins, the lower 13
molecular weight of VP3 at 13 kDa makes it more suitable for expression in E. coli 14
than the VP2 protein at 26 kDa (Lacorte et al., 2007; Pallister et al., 1994; 15
Nogueira-Dantas et al., 2007). However, recombinant VP3 protein has rarely been 16
explored for protein production in E. coli and neither has this protein been exploited 17
to any great extent for use in ELISA systems that examine chicken sera. 18
In this study, we examine a number of different recombinant E. coli strains 19
harboring a CAV VP3 protein expression cassette that can be used to produce 20
recombinant VP3 protein. This was done with the aim of systematically assessing 21
protein productivity under various operational parameters and treatments. Moreover, 22
the purified E. coli-expressed VP3 was then used as coating antigen in an ELISA 23
assay and gave good performance in terms of antigenicity and specificity when 24 detecting VP3 antibodies. 25 3 4 5 6 7 8 9 10 11 12 13 14 15 16 17 18 19 20 21 22 23 24 25 26 27 28 29 30 31 32 33 34 35 36 37 38 39 40 41 42 43 44 45 46 47 48 49 50 51 52 53 54 55 56 57 58 59 60
For Peer Review Only
1
Materials and methods 2
Construction of VP3 expression vectors 3
The VP3 cDNA was amplified from our previous plasmid pGEX-1-6P-VP2 by PCR 4
(Huang et al., 2010). Standard recombinant DNA methods were used and followed the 5
approaches used in previous studies for plasmid construction (Sambrook et al., 6
1989). To introduce an Nde I and Xho I cleavage site into the 5’ and the 3’end of the 7
CAV VP3 gene, respectively, one specifically designed PCR primer set, CH103 (5’- 8
ggaattccatatgaacgctctccaagaag-3’) and CH54 (5’- ccgctcgagcagtcttatacaccttcttg-3’) 9
was used to perform PCR using the plasmid pGEX-6P-1-VP2 as template DNA. The 10
resultant PCR product was cloned into plasmid pVI127 (modified from pET21b by 11
adding the TAT sequences from HIV at the 5' terminus of the multi-cloning site and 12
introducing His-tags at the 5’ and 3’ ends of the multi-cloning site. The resultant 13
construct, pVI127-VP3, was analyzed by restriction enzyme digestion and sequencing 14
before it was used for further protein expression. 15
16
VP3 protein expression and purification 17
Three recombinant E. coli strains harboring the VI127-VP3 plasmid were used to 18
express VP3 protein under induction by 1 mM isopropyl-β-D-thiogalactoside (IPTG) 19
for 4 hours. The recombinant strains were cultured in LB medium and the culture 20
condition used were as described in previous studies (Lee at al., 2009). For 21
purification of the recombinant VP3 protein under denaturing conditions, the detailed 22
procedures and the buffer solutions were the same as described in our previously work 23
(Lee at al., 2009). The VP3 proteins were analyzed by 15% SDS–PAGE and 24
visualized by staining with Coomassie blue. 25 3 4 5 6 7 8 9 10 11 12 13 14 15 16 17 18 19 20 21 22 23 24 25 26 27 28 29 30 31 32 33 34 35 36 37 38 39 40 41 42 43 44 45 46 47 48 49 50 51 52 53 54 55 56 57 58 59 60
For Peer Review Only
1
Quantification of the E. coli-expressed VP3 proteins 2
The E. coli cell pellets expressing VP3 protein were collected by centrifugation at 3
12000xg for 10 mins and dissolved in PBS. The dissolved volume was determined 4
according to the OD280. After disrupting the cells by sonication using a 20% pulsed 5
activity cycle (Vibra cell, Sonics & Materials, Inc.), the soluble protein extract and 6
insoluble protein pellet was separated by centrifugation at 20000xg for 30 mins. Both 7
soluble and insoluble protein were resolved on 15% SDS-PAGE, and then transferred 8
to PVDF membrane. Western blot analysis was performed using an antibody targeting 9
the His-tags. The banded protein intensity was analyzed by ImageQuant TL software 10
(GE Healthcare) using purified VP3 as standard for protein content calibration. The 11
concentration of recombinant VP3 proteins was measured by BCA protein assay (Lee 12
at al., 2009). 13
14
Recombinant VP3 protein based enzyne-linked immunosorbent assay 15
ELISA plates (Nunc) were coated with 100µl volume of 10µg/ml purified 16
recombinant VP3 protein in coating buffer (0.35 mM NaHCO3, 0.15 mM Na2CO3, 17
0.1% NaN3, pH 9.6). After coating at 4℃ for 16 h, blocking was carried out with 18
200µl of blocking buffer (5% skim milk in PBS) at 37℃ for 1 h. Each well was then 19
washed thoroughly with PBS containing 0.1% Tween-20 (PBST) three times. After 20
washing, each well received 100 µl of 1000x diluted serum samples in PBS and the 21
plates were incubated at 37℃ for 1 h. Subsequently, the plates were washed with 22
PBST five times, each for 5 min; the plates were then treated with horseradish 23
peroxidase (HRP)-conjugated rabbit anti-chicken IgG (Jackson) diluted 1: 4000 in 24
PBS at 37℃ for 45 min. Following three similar washes, 100 µl of freshly prepared 25
chromogen/substrate solution (ABTS single solution, Zymed) was added into each 26 3 4 5 6 7 8 9 10 11 12 13 14 15 16 17 18 19 20 21 22 23 24 25 26 27 28 29 30 31 32 33 34 35 36 37 38 39 40 41 42 43 44 45 46 47 48 49 50 51 52 53 54 55 56 57 58 59 60
For Peer Review Only
well and the plate was incubated at room temperature for 20 min. The optical density 1
of each well was read at 405 nm using a microplate reader (Thermo). Each sample 2
was repeated three times. 3
4
Matrix-Assisted Laser Desorptiony Ionization Mass Spectrometric (MALDI-MS) 5
Protein gel bands were extracted for tryptic mapping by MALDI-MS in a similar 6
manner to our previous study (Lee at al., 2009). Individual protein bands were 7
respectively excised, destained, washed, and digested with modified trypsin (Nnheim); 8
the resulting peptides were extracted with acetonitrile. After vacuum drying, each 9
sample was redissolved in 10µl reaction buffer containing 1% trifluoroacetic acid and 10
50% acetonitrile. A portion (0.5 ml) of this sample solution was loaded into the 11
MALDI-MS sample plate together with 0.5 ml of matrix solution (2, 12
5-dihydroxybenzoic acid). MALDI-MS measurements were obtained using a delayed 13
extraction time-of-flight mass spectrometer (Voyager DE PRO, Applied Biosystems) 14
operated in reflector mode. 15
16
Results 17
Construction of the expression plasmid 18
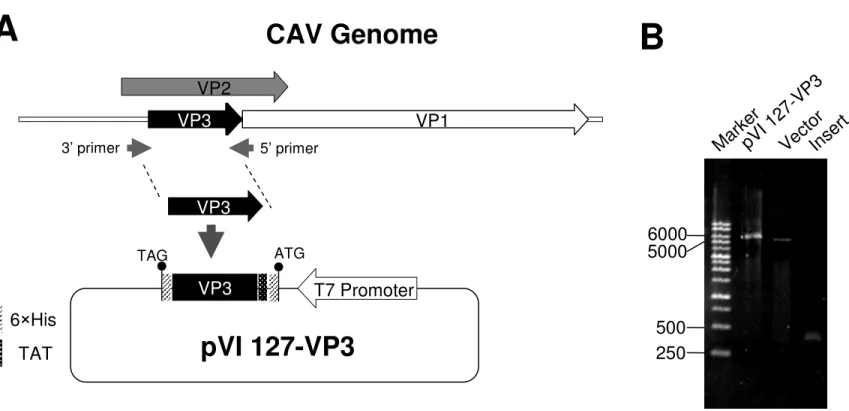
In the CAV DNA genome, the three open reading frames (ORFs) partially overlap 19
(Claessens et al., 1991; Kamada et al., 2006; Koch et al., 1995). As ORF1 within the 20
VP2 gene, the full-length VP3 gene, which consists of 323 nucleotides, is present in 21
this ORF as illustrated in Fig. 1A. To express the VP3 protein of CAV, the VP3 cDNA 22
was created by PCR using the VP2 cDNA of CAV as the template DNA. By PCR with 23
the specifically designed primers, the VP3 gene was amplified and cloned into 24
pVI127 using the NdeI and XhoI restriction sites, which created a protein with 25 3 4 5 6 7 8 9 10 11 12 13 14 15 16 17 18 19 20 21 22 23 24 25 26 27 28 29 30 31 32 33 34 35 36 37 38 39 40 41 42 43 44 45 46 47 48 49 50 51 52 53 54 55 56 57 58 59 60
For Peer Review Only
in-frame His-Tags. The resultant construction, pVI127-VP3, is shown in Fig. 1B. This 1
plasmid was then transformed into the various E. coli strains for further testing of 2
protein expression. 3
4
Expression and production of VP3 protein using different recombinant E. coli 5
strains 6
To examine the expression of VP3 protein in E. coli, three E. coli strains, BL21, 7
BL21 codonplus RP and BL21 pLySs, each harboring the pVI127-VP3 plasmid, were 8
induced with 1 mM IPTG at 37℃ for 4 hours. As illustrated in Fig. 2B, the protein 9
expression patterns of the bacterial total extract of the three E. coli strains were 10
examined by SDS-PAGE and Western-blot assay. The results demonstrated that the 11
different E. coli strains used are able to successfully express the recombinant VP3 12
under IPTG induction. The total expressed VP3 protein, including soluble and 13
insoluble portions, of BL21 pLySs was found to be greater than that produced by 14
BL21 or BL21 codonplus RP (Fig. 2C). In terms of soluble protein, the VP3 protein 15
productions of the three different strains were almost the same (0.037, 0.038, 0.055 16
mg/mL by BL21, BL21 codonplus RP and BL21 pLyss , respectively). In contrast, in 17
terms of insoluble VP3 protein, the protein productivity of the BL21 pLySs strain was 18
found to be much higher (0.37 mg/mL) than the BL21 (0.01 mg/mL) or codonplus RP 19
strains (0.01 mg/mL), respectively. In terms of the growth profiles of the E. coli 20
strains, there were significant differences in the effect of IPTG on the growth of three 21
E. coli strains in terms of the OD value at 600 nm (OD600) (Fig 2A). The OD600 22
growth of BL21 pLySs was higher than that of either BL21 or BL21 codonplus RP 23
(Fig. 2A). 24
25
Effect of IPTG concentration on the production of VP3 protein in E. coli 26 3 4 5 6 7 8 9 10 11 12 13 14 15 16 17 18 19 20 21 22 23 24 25 26 27 28 29 30 31 32 33 34 35 36 37 38 39 40 41 42 43 44 45 46 47 48 49 50 51 52 53 54 55 56 57 58 59 60
For Peer Review Only
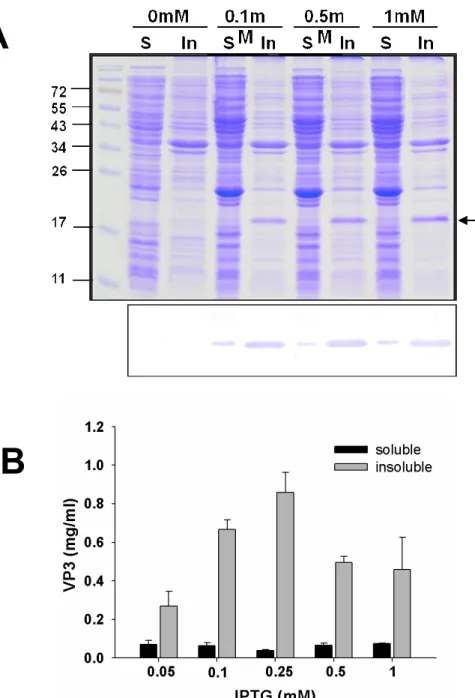
To examine the effect of IPTG concentration on protein productivity, various 1
concentrations of IPTG were used for induction. Increasing the concentration of IPTG 2
(from 0.05 to 0.25 mM) with E.coli BL21 pLySs obviously improved the production 3
of insoluble VP3 protein from 0.27 to 0.86 mg/mL (Fig. 3A, 3B). However, when a 4
level higher than 0.25 mM IPTG was used, the highest productivity reached was only 5
about 0.5mg/mL. Therefore there was no significant improvement in protein 6
productivity at these high levels of IPTG. In contrast to the situation in terms of 7
insoluble VP3 protein, increasing the concentration of IPTG (from 0.05 to 1 mM) had 8
no effect on the productivity of soluble VP3 protein with E.coli BL21 pLySs. Among 9
the above, therefore, 0.25 mM IPTG was determined to be the optimal concentration 10
for VP3 protein production using E.coli BL21 pLySs strain. 11
12
Effect of temperature on the production of VP3 protein in E. coli 13
To evaluate the effect of temperature on production of VP3 protein, the recombinant 14
BL21 pLySs strain was used. Figure 4A shows the various levels of productivity for 15
soluble and insoluble VP3 protein at three different temperatures, 20℃, 30℃ and 16
40℃. Under IPTG induction, both insoluble and soluble VP3 increased with 17
declining temperature. Moreover, there were significantly differences in the growth 18
profiles of the E. coli strains across three different temperatures in terms of OD value 19
at 600 nm (OD600), which are illustrated in Fig. 4C. The growth (OD600) of E. coli 20
BL21 pLySs at 30℃ was higher than at 20℃ or 40℃ at 4 hrs post-induction. After 8 21
hr post-induction, it was no obviously difference in OD600 over the three 22
temperatures. 23
24
Purificationt, characterization and antigenicity of E. coli-expressed VP3 protein 25
To purify the E. coli-expressed VP3 protein, Ni-NTA affinity resin was used. 26 3 4 5 6 7 8 9 10 11 12 13 14 15 16 17 18 19 20 21 22 23 24 25 26 27 28 29 30 31 32 33 34 35 36 37 38 39 40 41 42 43 44 45 46 47 48 49 50 51 52 53 54 55 56 57 58 59 60
For Peer Review Only
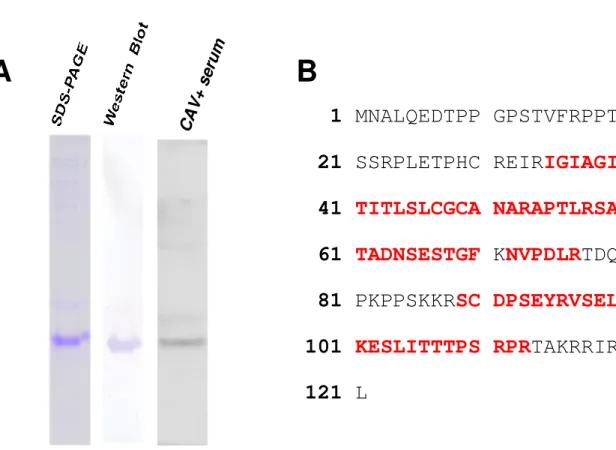
After affinity chromatography purification, the presence of purified denatured VP3 1
protein was confirmed (Fig. 5A). The purity of the VP3 protein was close to 2
homogenicity in the elution fraction, as shown by SDS-PAGE (Fig 5A). In addition, 3
the His-tag fused VP3 protein was recognized by anti-His-tag antibody using 4
Western-blot analysis (Fig. 5A). This confirms that the purification of His-tag fused 5
VP3 protein is feasible by Ni-NTA resin. Moreover, after examining the purified VP3 6
protein by mass spectrometry, six peptides from VP3 were identified from the trypsin 7
digest. These demonstrated a good alignment with a high score. The longest peptide 8
fragment, RSCDPSEYRVSELKENLITTTPSRPR, consisted of 26 amino acid 9
residues (Fig. 5B). The identity of this peptide sequence completely matched that of 10
CAV VP3 protein. All together the MS results provided 52% (64/121 amino acids) 11
exact match coverage of the previous reported amino acid sequences of VP3 12
(Accession No. M55918.1 for VP3 [22]). Therefore, we concluded that the E. coli 13
expressed VP3 protein had indeed originated from CAV. In addition, the purified 14
protein also reacted with CAV positive serum specifically (Fig. 5A) and there was no 15
cross reaction with CAV negative serum (data not shown). Taken together these 16
results demonstrated that the purified E. coli-expressed VP3 protein will be able to act 17
as a potential antigen candidate with high antigenicity when used for the development 18
of a detection kit for CAV infection. 19
20
Application of VP3 protein based ELISA for diagnosis of CAV infection 21
To apply the E. coli-expressed VP3 as coating antigen for the diagnosis of CAV 22
infection, an CAV VP3-based indirect ELISA was set up to evaluate the possibilities 23
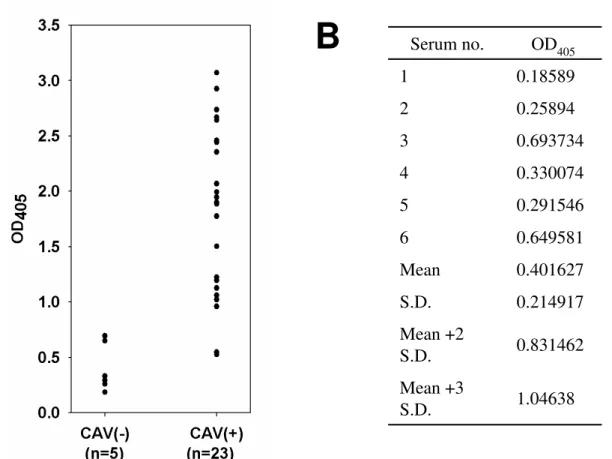
in terms of detection kit development. As shown as in Fig. 6, five CAV-negative and 24
23 CAV-positive specific chicken sera, which were collected from an experimental 25 3 4 5 6 7 8 9 10 11 12 13 14 15 16 17 18 19 20 21 22 23 24 25 26 27 28 29 30 31 32 33 34 35 36 37 38 39 40 41 42 43 44 45 46 47 48 49 50 51 52 53 54 55 56 57 58 59 60
For Peer Review Only
farm, showed different levels of reactivity against the VP3 protein as measured by the 1
OD value at 405 nm (OD405). Purified VP3 protein demonstrated poor reactivity 2
against CAV-negative sera. In contrast, purified VP3 protein demonstrated a high 3
antigenicity and there was a significant difference in the OD values between the CAV 4
negative and positive sera (p<0.01). This indicated the VP3 protein is highly antigenic 5
and can discriminate chicken sera that have been CAV infected from those that have 6
not been infected. Additionally, the individual OD405 values of the six CAV-negative 7
chicken sera against VP3, as shown in Table 1, were averaged to define a positive 8
threshold. The OD405 values obtained from the CAV-positive sera were all higher than 9
this cut-off value. In addition, when the positive/negative cut-off values were 10
determined as the mean plus 2 standard deviations (mean + 2 S.D.) or plus 3 standard 11
deviations (mean + 3 S.D.), all VP3-based ELISAs demonstrated 100% (6/6 × 100%) 12
specificity. The sensitivities of the VP3-based ELISA were 91.3% (21/23 × 100%) 13
and 82.6% (19/23 × 100%) when the cut-off values were set at mean plus 2 S.D. and 14 plus 3 S.D., respectively. 15 16 Discussion 17
The VP3 protein of CAV was successfully produced by the three E. coli strains 18
used in this study. The production of VP3 protein has been reported for various 19
eukaryotic and prokaryotic systems (Noteborn et al., 1998; Iwata et al., 1998; 20
Nogueira-Dantas et al., 2007) and the reason for this is that the VP3 protein has 21
important serodiagnostic applications. The cost of antigen production is related to the 22
source of the antigen. Using recombinant antigen for serodiagnosis has several 23
advantages, such as lower costs, ease of production and the fact that the antigenicity 24
of recombinant proteins is simpler to characterize. Indeed, the final factor is a critical 25 3 4 5 6 7 8 9 10 11 12 13 14 15 16 17 18 19 20 21 22 23 24 25 26 27 28 29 30 31 32 33 34 35 36 37 38 39 40 41 42 43 44 45 46 47 48 49 50 51 52 53 54 55 56 57 58 59 60
For Peer Review Only
consideration when developing a diagnostic kit to detect a pathogenic infection. The 1
plant expressing system was found to have a number of disadvantages when 2
producing CAV VP3 protein, such as the tedious procedure when constructing a 3
transfomant, the very low production yield and the uncharacterized nature of the 4
protein’s antigenicity (Lacorte et al., 2007). When an insect cell-baculovirus system 5
was used, the serum supplemented culture medium was costly and the whole system 6
was not easy to maintain (Noteborn et al., 1998; Iwata et al., 1998). Therefore, a 7
prokaryotic expressing system would seem to be more suitable as an expression 8
system for the production of CAV VP3 protein. A previous study showed the VP3 of 9
CAV, when expressed in E. coli, is able to produce 200µg/100 ml of protein 10
(Nogueira-Dantas et al., 2007). Nonetheless, up to the present, how to obtain the 11
optimal productivity of VP3 in any of the above systems has not been addressed. To 12
the best of our knowledge, this is first report to evaluate the production of VP3 13
protein in different E. coli strains and to determine the optimal parameters for 14
culturing these three E. coli strains to produce VP3. In this study, the three different 15
recombinant E. coli strains used for protein production were BL21, BL21 codonplus 16
RP and BL21 pLySs, each harboring pVI127-VP3. BL21 pLySs was found to give 17
the best performance in terms of both protein productivity and growth profile (Fig 2A, 18
2B and 2C). The VP3 protein of CAV is a nuclear protein with DNA binding activity 19
(Tavassoli et al., 2005). Previous studies have been demonstrated that expression of a 20
DNA binding protein might be harmful to the growth of the host cell [17 24, 25]. In 21
addition to this potential problem, expression of VP3 protein at high levels may result 22
in a metabolic burden on the host that could influence maximal growth rate or protein 23
productivity, especially this may be true for the BL21 and BL21 codonplus RP strains 24
(Pallister et al., 1994; et al., Saïda et al., 2006; Miller et al., 1989). In addition to this 25
potential problem, expression of VP3 protein at high levels may result in a metabolic 26 3 4 5 6 7 8 9 10 11 12 13 14 15 16 17 18 19 20 21 22 23 24 25 26 27 28 29 30 31 32 33 34 35 36 37 38 39 40 41 42 43 44 45 46 47 48 49 50 51 52 53 54 55 56 57 58 59 60
For Peer Review Only
burden on the host that could influence maximal growth rate or protein productivity, 1
especially this may be true for the BL21 and BL21 codonplus RP strains (Kurland et 2
al., 1996). The present study demonstrates that, notwithstanding the above potential 3
problems, BL21 pLySs strain has good potential when used to produce large amounts 4
of recombinant VP3. This is possibly because growth rate and protein productivity 5
characteristics of this strain are more suitable than those of the other strains. 6
IPTG is used to induce over-expression when an IPTG-inducible promoter is 7
present. However, the cost of inducer, contamination of the end-product and the 8
toxicity of the inducer have been suggested as problems that may limit its use in terms 9
of protein production, the quality of the final product and an efficient recovery 10
process (Figge et al., 1988; Baneyx et al.,1999). Thus, the IPTG concentration used 11
herein is important when addressing protein over-expression in E. coli. The other 12
parameter that may affect protein production is temperature, which can influence 13
protein productivity and protein solubility. A previous study has been shown that 14
lowering the bacterial growth temperature decreases periplasmic aggregation and 15
increases the yield of soluble protein (Baneyx et al.,1999) and our results in this study 16
agreed with this finding. Under IPTG induction, both insoluble and soluble VP3 17
protein production by BL21 pLySs increased with declining temperature. Combining 18
the results of protein productivity and growth rate, a culture temperature between 19
20℃ and 30℃ would seem to be optimal for VP3 protein production (Fig. 4B, 4C). 20
Using the optimized conditions for VP3 production in terms of different bacterial 21
strains, temperature and induction conditions, the productivity of VP3 was estimated 22
to be 1.99mg/mL approximately (data not shown) for BL21 pLySs, which is a much 23
higher productivity than published in previous studies (Nogueira-Dantas et al., 2007). 24
The His-tag fusion system is a versatile and popular method for expression, 25
purification and detection of fusion proteins. In this study, we constructed 26 3 4 5 6 7 8 9 10 11 12 13 14 15 16 17 18 19 20 21 22 23 24 25 26 27 28 29 30 31 32 33 34 35 36 37 38 39 40 41 42 43 44 45 46 47 48 49 50 51 52 53 54 55 56 57 58 59 60
For Peer Review Only
pVI127-VP3 with two His-tags at either end of the VP3 protein to allow recovery 1
during downstream processing; our results indicated that it is feasible to purify the 2
VP3 protein by Ni-NTA column in one step. Moreover, this process is easy to 3
scale-up for commercial protein production in the future. Importantly, the purified 4
E.coli expressed VP3 protein possesses discriminating immunorelevant epitopes and 5
has high sensitivity when reacting with CAV specific antibodies. The VP3-based 6
ELISA assay developed in this study was found to be a useful serodiagnostic kit for 7
detection of CAV infection. In addition to using the full length VP3 protein for such 8
kits, antigenic domains screening of the VP3 protein in the future will be helpful in 9
improving the sensitivity of the indirect ELISA. 10
In summary, the full-length CAV VP3 gene was cloned and the production 11
parameters of the VP3 protein in E.coli were investigated. The purified E.coli 12
-expressed VP3 protein described here has the potential to become a valuable 13
candidate as an ELISA coating antigen for developing CAV antibodies detection kits. 14
In this context, the E. coli-expressed VP3-based ELISA established here shows high 15
specificity and sensitivity. These results provide useful information that will help the 16
large-scale production of recombinant VP3 protein for routine serodiagnosis, for 17
epidemiological investigations of CAV infection and will help with assessing the 18
immunization efficacy after vaccination of farm-bred young chickens. 19
20
Acknowledgements 21
This work was supported by the grant from the National Science Council (NSC 22
95-2313-B-039-004-, NSC96-2313-B-276-001-MY3) and China Medical University 23
(CMU-97-273) of Taiwan, Republic of China. 24 3 4 5 6 7 8 9 10 11 12 13 14 15 16 17 18 19 20 21 22 23 24 25 26 27 28 29 30 31 32 33 34 35 36 37 38 39 40 41 42 43 44 45 46 47 48 49 50 51 52 53 54 55 56 57 58 59 60
For Peer Review Only
1
Legends 2
Figure 1. Construction of recombinant CAV VP3 gene in a E. coli expression system 3
(A). A 323-bp of VP3 gene was amplified from VP2 gene; and cloned into E. coli 4
expression vector pVI127 under control of T7 promoter (B). The primer set used for 5
amplification of VP3 gene was illustrated by arrows. Two six-His tag fused to the N- 6
and C-terminus of VP3 protein, respectively, was shown as hatched box. 7
8
Figure 2. (A) Growth profiles of recombinant E. coli BL21 (DE3), BL21 (DE3) 9
codonplus RP and BL21 (DE3) pLyss, respectively, harboring pVI127-TAT-VP3 in 10
LB medium during post-induction by adding of IPTG. (B) Expression of recombinant 11
VP3 in three different recombinant E. coli strains was analyzed by SDS-PAGE and 12
Western blot, respectively, during post-induction by adding of IPTG. (C) Production 13
yield of recombinant VP3 in three different recombinant E. coli strains. 14
15
Figure 3. Effect of used IPTG concentration on the expression level of total VP3 16
protein. (A) SDS-PAGE and Western Blot were performed for analysis of 17
recombinant VP3 expression under different concentration of IPTG induction. (B) 18
The relative quantity of produced soluble and insoluble VP3 protein was respectively 19 3 4 5 6 7 8 9 10 11 12 13 14 15 16 17 18 19 20 21 22 23 24 25 26 27 28 29 30 31 32 33 34 35 36 37 38 39 40 41 42 43 44 45 46 47 48 49 50 51 52 53 54 55 56 57 58 59 60
For Peer Review Only
determined at different IPTG concentration used for induction. The band-intensity 1
was analyzed by AlphaDigiDocRT software. 2
3
Figure 4. Effect of the cultivation temperature on expression of recombinant VP3 4
protein in soluble form. (A) Western Blot analysis of expressed soluble and insoluble 5
protein at various culture temperatures. All samples were analyzed under the same 6
amount of cells loading; S, Soluble fraction; In, insoluble fraction. (B) The solubility 7
of VP3 protein at different cultivation temperature was calculated as the ratio of 8
band-intensity of soluble VP3 protein to total VP3 protein. The band-intensity was 9
analyzed by AlphaDigiDocRT software. (C) Growth profiles of recombinant E. coli 10
BL21 (DE3) pLyss harboring pVI127- VP3 in LB medium during post-induction by 11
adding of IPTG at various culture temperatures. 12
13
Figure 5. Purification of E. coli expressed recombinant VP3 by Ni-NTA resin. (A) The 14
purity of recombinant VP3 was determined by SDS-PAGE and Western Blot analysis. 15
The antibodies against His-tag (middle panel) and CAV (right panel) were used 16
respectively. (B) Amino acid sequence of the VP3 protein determined by 17
MALDI-TOF. The red letters represent the actural amino acid sequence matched. 18 19 3 4 5 6 7 8 9 10 11 12 13 14 15 16 17 18 19 20 21 22 23 24 25 26 27 28 29 30 31 32 33 34 35 36 37 38 39 40 41 42 43 44 45 46 47 48 49 50 51 52 53 54 55 56 57 58 59 60
For Peer Review Only
Figure 6. (A) Reactivity of chicken serum with recombinant VP3 protein determined 1
by ELISA. Five CAV-negatives and 23 CAV-positive chicken serum were respectively 2
used to react with VP3-based ELISA assay. The reactivity was determined in terms of 3
obtained OD value at 405 nm (OD405). (B) Determination of cut-off value to 4
reactivity of ELISA on CAV-negative chicken serum. Sera no.1-5 was obtained from 5
SPF chickens in the experimentally farm. These sera were all identified as negative 6
using commercial ELISA kit purchased from IDEXX laboratory Inc. Serum no.6 was 7
negative serum obtained from IDEXX commercial kit. S.D., standard deviations. 8 3 4 5 6 7 8 9 10 11 12 13 14 15 16 17 18 19 20 21 22 23 24 25 26 27 28 29 30 31 32 33 34 35 36 37 38 39 40 41 42 43 44 45 46 47 48 49 50 51 52 53 54 55 56 57 58 59 60
For Peer Review Only
References1
Adair, B.M., 2000: Immunopathogenesis of chicken anemia virus infection. Dev. 2
Comp. Immunol. 24, 247–255. 3
Claessens, J. A., C. C.Schrier, A. P. Mockett, E. H. Jagt, P. J. Sondermeijer, 1991: 4
Molecular cloning and sequence analysis of the genome of chicken anaemia agent. 5
J. Gen. Virol. 72, 2003–2006. 6
Kamada, K., A. Kuroishi, T. Kamahora, P. Kabat, S. Yamaguchi, S. Hino, 2006: 7
Spliced mRNAs detected during the life cycle of chicken anemia virus. J. Gen. 8
Virol. 87, 2227–2233. 9
Koch, G., D. J. van Roozelaar, C. A. Verschueren, A. J. van der Eb, M. H. M. 10
Noteborn, 1995: Immunogenic and protective properties of chicken anemia virus 11
proteins expressed by baculovirus. Vaccine 13: 763–770. 12
Lucio, B.A., K. A. Schat, H. L. Shivaprasad, 1990: Identification of the chicken 13
anemia agent reproduction of the disease and serological survey in the United 14
States. Avian Dis. 34, 146–153. 15
Deng, M., F. Li, B. A. Ballif, S. Li, X. Chen, L. Guo, X. Ye, 2009: Identification and 16
functional analysis of a novel cyclin e/cdk2 substrate ankrd17. J. Biol. Chem. 284, 17
7875-88. 18
Hsu, J.P., M. L. Lee, Y. P. Lu, H. T. Hung, H. H. Hung, M. S. Chein, 2002: Chicken 19 3 4 5 6 7 8 9 10 11 12 13 14 15 16 17 18 19 20 21 22 23 24 25 26 27 28 29 30 31 32 33 34 35 36 37 38 39 40 41 42 43 44 45 46 47 48 49 50 51 52 53 54 55 56 57 58 59 60
For Peer Review Only
infectious anemia in layer. J. Chin. Soc. Vet. Sci. 28, 153-160. 1
McNulty, M. S., T. J. Connor, F. McNeilly, D. Spackman, 1989: Chicken anemia 2
agent in the United States: isolation of the virus and detection of antibody in 3
broiler breeder flocks. Avian Dis. 33, 691-694. 4
Noteborn, M. H., V C. A.erschueren, G. Koch, , A. J.Van der Eb, 1998: Simultaneous 5
expression of recombinant baculovirus-encoded chicken anemia virus (CAV) 6
proteins VP1 and VP2 is required for formation of the CAV-specific neutralizing 7
epitope. J. Gen. Virol. 79, 3073–3077. 8
Todd, D., J. L. Creelan, M. S. McNulty, 1991: Dot blot hybridization assay for 9
chicken anemia agent using a cloned DNA probe. J. Clin. Microbiol. 29, 933-939. 10
Todd, D., K. A. Mawhinney, M. S. McNulty, 1992: Detection and differentiation of 11
chicken anemia virus isolates by using the polymerase chain reaction. J. Clin. 12
Microbiol. 30, 1661-1666. 13
McNulty, M. S., W. L. Curran, D. Todd, D. P. Mackie, 1990: Chicken anemia agent: 14
an electron microscopic study. Avian Dis. 34, 736-43. 15
Brentano, L., S. Lazzarin, S. S. Bassi, T. A. P. Klein, K. A. Schat, 2005: Detection of 16
chicken anemia virus in the gonads and in the progeny of broiler hens with high 17
neutralizing antibody titers. Vet. Microbiol. 105, 65-72. 18 3 4 5 6 7 8 9 10 11 12 13 14 15 16 17 18 19 20 21 22 23 24 25 26 27 28 29 30 31 32 33 34 35 36 37 38 39 40 41 42 43 44 45 46 47 48 49 50 51 52 53 54 55 56 57 58 59 60
For Peer Review Only
Iwata, N., M. Fujino, K. Tuchiya, A. Iwata, Y. Otaki, S. Ueda, 1998: Development of 1
an enzyme-linked immunosorbent assay using recombinant chicken anemia virus 2
proteins expressed in a baculovirus vector system. J. Vet. Med. Sci. 60, 175-80. 3
Lacorte, C., H. Lohuis, R. Goldbach, M. Prins, 2007: Assessing the expression of 4
chicken anemia virus proteins in plants. Virus Res. 129, 80-6. 5
Wang, X., H. Gao, Y. Gao, C. Fu, Z. Wang, G. Lu, Y. Cheng, X. Wang, 2007: 6
Mapping of epitopes of VP2 protein of chicken anemia virus using monoclonal 7
antibodies. J Virol. Methods 143, 194-199. 8
Pallister, J., K. J. Fahey, M. Sheppard, 1994: Cloning and sequencing of the chicken 9
anaemia virus (CAV) ORF-3 gene, and the development of an ELISA for the 10
detection of serum antibody to CAV. Vet. Microbiol. 39, 167-78. 11
Lee, M. S., Y. Y, Lien, S. H. Feng, R. L. Huang, M. C. Tsai, W. T. Chang, H. J. Chen, 12
2009: Production of chicken anemia virus (CAV) VP1 and VP2 protein expressed 13
by recombinant Escherichia coli. Process Biochem. 44, 390-395. 14
Nogueira-Dantas, E. O., A. J. P. Ferreira, C. S. Astolfi-Ferreira, L. Brentano, 2007: 15
Cloning and expression of chicken anemia virus VP3 protein in Escherchia coli. 16
Comp. Immun. Microbiol. Infect. Dis. 30, 133-142. 17
Huang, C. H., G. H. Lai, M. S. Lee, W. H. Lin, Y. Y. Lien, S. C. Hsuch, J. Y. Kao, W. 18
T. Chang, T. C. Lu, W. N. Lin, H. J. Chen, M. S. Lee, 2010: Development and 19 3 4 5 6 7 8 9 10 11 12 13 14 15 16 17 18 19 20 21 22 23 24 25 26 27 28 29 30 31 32 33 34 35 36 37 38 39 40 41 42 43 44 45 46 47 48 49 50 51 52 53 54 55 56 57 58 59 60
For Peer Review Only
evaluation of a loop-mediated isothermal amplification assay for rapid detection 1
of chicken anaemia virus. J. Appl. Microbiol. 108, 917-924. 2
Sambrook, J., E. F. Fritsch, T. Maniatis, 1989: Molecular cloning: a 3
laboratory manual, 2nd ed. Cold Spring Harbor Laboratory, Cold Spring 4
Harbor, N.Y. 5
Noteborn, M. H., G. F. de Boer, D. J. van Roozelaar, C. Karreman, O. Kranenburg, J. 6
G. Vos, S. H. Jeurissen, R. C. Hoeben, A. Zantema, G. Koch, 1991: 7
Characterization of cloned chicken anemia virus DNA that contains all elements 8
for the infectious replication cycle. J. Virol. 65, 3131-9. 9
Tavassoli, M., L. Guelen, B. A. Luxon, J. Gäken, 2005: Apoptin: specific killer of 10
tumor cells? Apoptosis 10, 717-24. 11
Saïda, F., M. Uzan, B. Odaert, F. Bontems, 2006: Expression of Highly Toxic Genes 12
in E. coli: Special Strategies and Genetic Tools. Curr. Protein Pept. Sci. 7, 13
47-56. 14
Miller, K. W., R. J. Evans, S. P. Eisenberg, R. C. Thompson. 1989: Secretory 15
leukocyte protease inhibitor binding to mRNA and DNA as a possible cause of 16
toxicity to Escherichia coli. J. Bacteriol. 171, 2166-2172. 17
Kurland, G. C., H. Dong, 1996: Bacterial growth inhibition by overproduction of 18
protein. Molecular Miocrobiol. 21, 1-4. 19
Figge, J., C. Wright, C. J. Collins, T. M. Roberts, D. M. Livingston, 1988: Stringent 20 3 4 5 6 7 8 9 10 11 12 13 14 15 16 17 18 19 20 21 22 23 24 25 26 27 28 29 30 31 32 33 34 35 36 37 38 39 40 41 42 43 44 45 46 47 48 49 50 51 52 53 54 55 56 57 58 59 60
For Peer Review Only
regulation of stably integrated chloramphenicol acetyl transferase genes by E. 1
coli lac repressor in monkey cells. Cell 52, 713–722. 2
Baneyx, F., 1999: Recombinant protein expression in Escherichia coli. Curr Opin 3 Biotechnol. 10, 411–421. 4 5 3 4 5 6 7 8 9 10 11 12 13 14 15 16 17 18 19 20 21 22 23 24 25 26 27 28 29 30 31 32 33 34 35 36 37 38 39 40 41 42 43 44 45 46 47 48 49 50 51 52 53 54 55 56 57 58 59 60
For Peer Review Only
VP1 3’ primer 5’ primer VP3 VP3 VP2 VP3 ATG TAG 6×His TAT T7 PromoterpVI 127-VP3
CAV Genome
Mar ker pVI 1 27-V P3 Vect or Mar ker Inse rt 250 500 50006000A
B
Figure 1. Construction of recombinant CAV VP3 gene in a E. coli expression system (A). A 323-bp of VP3 gene was amplified from VP2 gene; and cloned into E. coli expression vector pVI127 under control of T7 promoter (B). The primer set used for amplification of VP3 gene was illustrated by arrows. Two six-His tag fused to the N- and C-terminus of VP3 protein, respectively, was shown as hatched box.
Transboundary and Emerging Diseases - submitted manuscript 3 4 5 6 7 8 9 10 11 12 13 14 15 16 17 18 19 20 21 22 23 24 25 26 27 28 29 30 31 32 33 34 35 36 37 38 39 40 41 42 43 44 45 46 47 48 49 50 51 52 53 54 55 56 57
For Peer Review Only
A
B
C
3 4 5 6 7 8 9 10 11 12 13 14 15 16 17 18 19 20 21 22 23 24 25 26 27 28 29 30 31 32 33 34 35 36 37 38 39 40 41 42 43 44 45 46 47 48 49 50 51 52 53 54 55 56 57 58 59For Peer Review Only
Figure 2. (A) Growth profiles of recombinant E. coli BL21 (DE3), BL21 (DE3) codonplus RP and BL21 (DE3) pLyss, respectively, harboring pVI127-TAT-VP3 in LB medium during post-induction by adding of IPTG. (B) Expression of recombinant VP3 in three different recombinant E. coli strains was analyzed by SDS-PAGE and Western blot, respectively, during post-induction by adding of IPTG. (C) Production yield of recombinant VP3 in three different recombinant E. coli strains. 3 4 5 6 7 8 9 10 11 12 13 14 15 16 17 18 19 20 21 22 23 24 25 26 27 28 29 30 31 32 33 34 35 36 37 38 39 40 41 42 43 44 45 46 47 48 49 50 51 52 53 54 55 56 57 58 59
For Peer Review Only
A
B
Figure 3. Effect of used IPTG concentration on the expression level of total VP3 protein. (A) SDS-PAGE and Western Blot were performed for analysis of
recombinant VP3 expression under different concentration of IPTG induction. (B) The relative quantity of produced soluble and insoluble VP3 protein was
respectively determined at different IPTG concentration used for induction. The band-intensity was analyzed by AlphaDigiDocRT software.
3 4 5 6 7 8 9 10 11 12 13 14 15 16 17 18 19 20 21 22 23 24 25 26 27 28 29 30 31 32 33 34 35 36 37 38 39 40 41 42 43 44 45 46 47 48 49 50 51 52 53 54 55 56 57 58 59
For Peer Review Only
A
B
C
℃ ℃ ℃ 3 4 5 6 7 8 9 10 11 12 13 14 15 16 17 18 19 20 21 22 23 24 25 26 27 28 29 30 31 32 33 34 35 36 37 38 39 40 41 42 43 44 45 46 47 48 49 50 51 52 53 54 55 56 57 58 59For Peer Review Only
Figure 4. Effect of the cultivation temperature on expression of recombinant VP3 protein in soluble form. (A) Western Blot analysis of expressed soluble and
insoluble protein at various culture temperatures. All samples were analyzed under the same amount of cells loading; S, Soluble fraction; In, insoluble fraction. (B) The solubility of VP3 protein at different cultivation temperature was calculated as the ratio of intensity of soluble VP3 protein to total VP3 protein. The band-intensity was analyzed by AlphaDigiDocRT software. (C) Growth profiles of recombinant E. coli BL21 (DE3) pLyss harboring pVI127- VP3 in LB medium during post-induction by adding of IPTG at various culture temperatures.
3 4 5 6 7 8 9 10 11 12 13 14 15 16 17 18 19 20 21 22 23 24 25 26 27 28 29 30 31 32 33 34 35 36 37 38 39 40 41 42 43 44 45 46 47 48 49 50 51 52 53 54 55 56 57 58 59
For Peer Review Only
1 MNALQEDTPP GPSTVFRPPT
21 SSRPLETPHC REIR
IGIAGI
41
TITLSLCGCA NARAPTLRSA
61
TADNSESTGF
K
NVPDLR
TDQ
81 PKPPSKKR
SC DPSEYRVSEL
101
KESLITTTPS RPR
TAKRRIR
121 L
B
A
CA V+ se ru mFigure 5. Purification of E. coli expressed recombinant VP3 by Ni-NTA resin. (A) The purity of recombinant VP3 was determined by SDS-PAGE and Western Blot analysis. The antibodies against His-tag (middle panel) and CAV (right panel) were used respectively. (B)
Amino acid sequence of the VP3 protein determined by MALDI-TOF. The red letters represent the actural amino acid sequence matched.
Transboundary and Emerging Diseases - submitted manuscript 3 4 5 6 7 8 9 10 11 12 13 14 15 16 17 18 19 20 21 22 23 24 25 26 27 28 29 30 31 32 33 34 35 36 37 38 39 40 41 42 43 44 45 46 47 48 49 50 51 52 53 54 55 56 57
For Peer Review Only
1.04638 Mean +3 S.D. 0.831462 Mean +2 S.D. 0.214917 S.D. 0.401627 Mean 0.649581 6 0.291546 5 0.330074 4 0.693734 3 0.25894 2 0.18589 1 OD405 Serum no.Figure 6. (A) Reactivity of chicken serum with recombinant VP3 protein determined by ELISA. Five CAV-negatives and 23 CAV-positive chicken serum were respectively used to react with VP3-based ELISA assay. The reactivity was determined in terms of obtained OD value at 405 nm (OD405). (B) Determination of cut-off value to reactivity of ELISA on CAV-negative chicken serum. Sera no.1-5 was obtained from SPF chickens in the experimentally farm. These sera were all identified as negative using commercial ELISA kit purchased from IDEXX laboratory Inc. Serum no.6 was negative serum obtained from IDEXX commercial kit. S.D., standard deviations.
A
B
Transboundary and Emerging Diseases - submitted manuscript 3 4 5 6 7 8 9 10 11 12 13 14 15 16 17 18 19 20 21 22 23 24 25 26 27 28 29 30 31 32 33 34 35 36 37 38 39 40 41 42 43 44 45 46 47 48 49 50 51 52 53 54 55 56 57