Influences of internal tapered abutment designs on bone stresses around a dental implant: three-dimensional finite element method with statistical evaluation
Chun-Ming Chu*†/ Heng-Li Huang*†/ Jui-Ting Hsu / Lih-Jyh Fuh*
*School of Dentistry, China Medical University, Taichung, Taiwan. † indicates equal contribution
Running Head: Internal tapered abutment designs on surrounding bone stress
Corresponding Author: Lih-Jyh Fuh. School of Dentistry, China Medical University, Taichung, Taiwan. Full Address: School of Dentistry, China Medical University, No.91 Hsueh-Shih Road, 40402 Taichung, Taiwan. Fax: +886-4-22014043 Phone: +886-4-22053366 ext. 2312. E-mail: [email protected]
Summery
Background: The aim of this study was to determine the effects of various designs of internal tapered abutment joints on the stress induced in peri-implant crestal bone by using the three-dimensional finite element method and statistical analysis.
Methods: Thirty-six models with various internal tapered abutment–implant interface
designs including different abutment diameters (3.0 mm, 3.5 mm, and 4.0 mm), connection depths (4 mm, 6 mm, and 8 mm), and tapers (2°, 4°, 6°, and 8°) were constructed. Force of 170 N was applied to the top surface of the abutment either vertically or 45° obliquely. The maximum von Mises bone stress values in the crestal bone surrounding the implant were analyzed statistically using ANOVA. In addition, patterns of bone stress around the implant were examined. Results: The results demonstrated that a smaller abutment diameter and a longer abutment connection significantly reduced the bone stresses (p < 0.0001) in both vertical and oblique loading conditions. Moreover, more parallel the tapered abutment–implant interfaced connection is the less bone stresses under vertical loading (p = 0.0002), whereas the abutment taper did not show significant effects on bone stresses under oblique loading (p = 0.83). The bone stresses were influenced mainly by the abutment diameter, followed by the abutment connection depth and then the abutment taper. Conclusion: It was suggested that for internal tapered abutment design a narrower and deeper abutment–implant interface produces the biomechanical advantage of reducing the stress concentration in the crestal region around an implant.
Keywords: dental abutments, dental implants, biomechanics, dental stress analysis, finite element analysis
Introduction
Overloading may induce microdamage to the bone and result in bone resorption1. The implant design influences the induced bone stress, with there usually being a high stress/strain around the implant that contributes to crestal bone loss and ultimately the failure of osseointegration2, 3. A tapered abutment (or Morse-taper connection) is one type of abutment–implant interface design that is becoming popular in clinics due to its high fatigue strength4, 5 and joint stability6, 7. Previous studies have demonstrated that the use of tapered abutment designs improves load transfer, and can thereby reduce the peak bone stresses around implants8, 9. Some researchers indicated that a tapered interference-fit connection provided superior force transmission10. However, certain factors may affect the mechanical performance of a tapered abutment–implant interface. A tapered connection also constitutes a type of platform-switching design, which means that connecting a reduced-diameter abutment to an implant can result in a circumferential horizontal mismatch around the implant shoulder. Some researchers have indicated that platform-switching configuration of tapered abutment-implant connection design reduced the bone loss around implants11. In addition, numerical analyses showed that a reduced abutment diameter lowered the stresses in peri-implant bone12 due to a shift in the area of stress concentration inwards, thereby ensuring that the high-stress area around the top surface of an implant was distant from the bone–implant interface13, which reduced the stresses translating to the peri-implant bone.
In addition to the abutment diameter affecting the mechanical performance of a tapered abutment–implant interface, Hansson14 found that using a conical abutment–implant interface with a deeper connection within the implant (relative to the flat-top abutment–implant interface) can resist larger axial loads. Some
researchers15 reported that the increased contact area at the abutment–implant interface when using a tapered abutment, such as connections in internal-hex systems, resulted in improved force distribution down to the fixture tip and reduced the stress concentration in the crestal region relative to external-hex systems. In addition, tapering the implant neck induced a favorable stress distribution in the bone16. This prompted us to investigate how the bone stresses are affected by the taper angle between the tapered abutment and implant, and also the connection depth, since these parameters may exert important effects on stress/strain translation.
Currently there is incomplete information on the biomechanical behavior at the tapered abutment–implant interface. The aim of this study was to determine how various designs of the tapered abutment–implant interface (i.e., abutment diameter, connection depth, and degree of taper) affect the stress distribution in peri-implant bone by using the finite element (FE) method and statistical analysis.
Material and methods
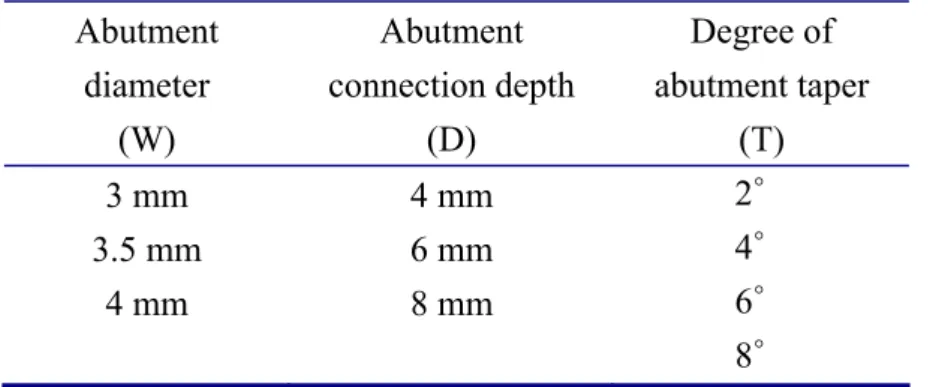
Three-dimensional FE modelingComputer-aided-design software† was used to construct a model of a screw-shaped root-form implant with a taper of 2°, length of 14 mm, and diameter of 5 mm. Implants with various abutment connection designs – comprising abutment diameters (W) from 3 to 4 mm, abutment connection depths (D) from 4 to 8 mm, and abutment tapers (T) from 2° to 8° – were created as indicated in Table 1 and Fig. 1 (e.g., the model designated as W3_D8_T2 had an abutment diameter of 3 mm, an abutment connection depth of 8 mm, and an abutment taper of 2°). A model of the bone block was constructed based on a cross-sectional image of the human mandible in the molar region. All models were combined by Boolean operations (Fig. 2a), and the IGES
format of the solid model was then exported to FE software‡ to generate the FE model (Fig. 2b) using 10-node tetrahedral h-elements (ANSYS solid 187). The interfacial condition between the implant and bone was set as bonded. The contact condition between the abutment and implant was set as a frictional coefficient (μ) of 0.317. Thirty-six abutment–implant models were analyzed. The material properties are listed in Table 218, 19. The material properties of implants and abutments were titanium with homogeneous and isotropic elastic properties. The bone block was considered to be anisotropic (i.e., properties differing with the direction). The mesial and distal surfaces of the bone block were constrained as the boundary condition. Two loading conditions were applied on the top surface of the abutment. Force of 170 N20 was applied to the top surface of the abutment either vertically or 45° obliquely to the long axis of the implant. Based on the results of convergence testing shown in the Fig. 3, an element size of 0.5 mm was used in all the models.
Statistical analysis
ANOVAs were performed to analyze the influence of abutment diameter, connection depth, and taper on the maximum von Mises stress around the implant under vertical loading (VL) and oblique loading (OL). Probability values of P ≤ 0.0001 were considered statistically significant by using commercial statistical software§ for statistical analyses.
† (SolidWorks 2008, SolidWorks Corp., Concord, MA, USA) ‡(ANSYS Workbench 10.0, Swanson Analysis, Huston, PA, USA) §(SAS® 9.1, SAS Institute, Cary, NC, USA)
Results
statistical analyses for the various abutment diameters, connection depths, and tapers are listed in Tables 3, 4, and 5.
Abutment diameter
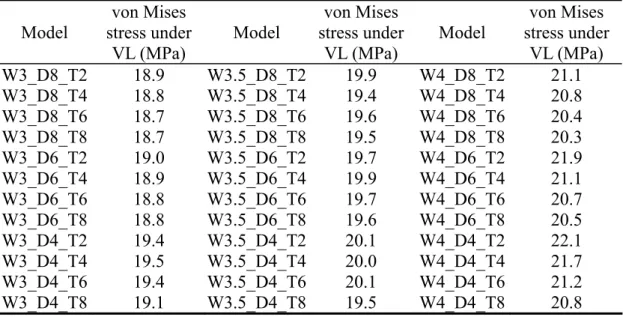
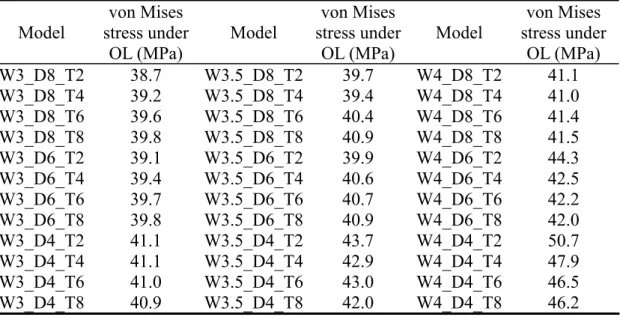
The data in Tables 3 and 4 were grouped to different abutment diameters of 3.0, 3.5, and 4.0 mm. The data showed that models with a smaller diameter of abutment induced a significantly smaller bone stresses in both VL and OL conditions (P < 0.0001).
Abutment connection depth
The data in Tables 3 and 4 were grouped based on abutment connection depths of 4, 6, and 8 mm. Models with a longer connection depth generated significantly lower stresses around the implant shoulder both in VL and OL conditions (P < 0.0001). Abutment taper
The data in Tables 3 and 4 were also grouped based on abutment tapers of 2°, 4°, 6°, and 8°. No significant relationship were found between bone stress and degree of taper in the VL condition (P = 0.0002) and OL condition (P = 0.83).
Discussion
Decreasing the bone stress around an implant remains an important goal for dental implant design. Many modifications to the design of a fixture have been suggested for reducing the bone stress. Nowadays, changing the designs of connection between the abutment and implant may also been suggested to decrease the bone stress. In this study, the FE method and statistical analyses were used to investigate the bone stresses for various designs of tapered abutment (i.e., abutment diameter, connection depth, and taper), and the relationships among these design factors.
both VL and OL, which might be due to the increased wall thickness of the fixture body. The stress distributions of models W3_D4_T2 and W4_D4_T2 under VL are shown in Fig. 4 as examples for comparison. For implants with the same diameter, the small-diameter abutment (W3_D4_T2) provides a thicker fixture wall for transmitting stresses than the wide-diameter abutment (W4_D4_T2). The higher thickness of fixture wall (W3_D4_T2) seems to provide the benefit to reduce the stress in the implant (Fig. 4a & c), leading to lower stresses in the bone (Fig. 4b & d). This is also why the platform-switched implants with tapered abutment design exhibit a superior stress-transmission characteristic than implants with matching abutment–implant diameters. However, some researchers21, 22 have reported that platform-switching designs with different horizontal mismatches produced almost identical stress distributions in the peri-implant bone, which is not in accordance with our observations. The difference between previous results and those of the present study might be related to the abutment designs (external-hex vs internally tapered), implant shapes (cylinder vs thread), and interface conditions (bonded vs frictional). However, the results of the present study did not indicate that it is advantageous to dramatically reduce the abutment diameter, since this may result in a higher stress concentration in the abutment and thus increase the risk of abutment fracture.
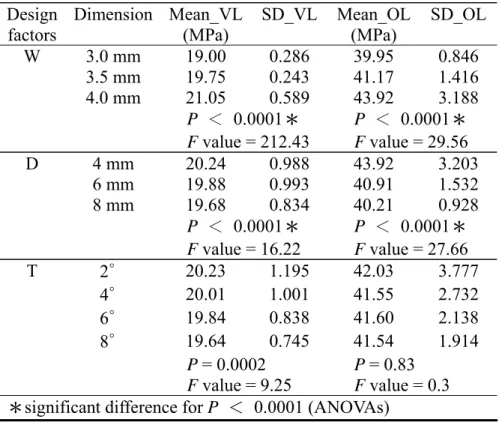
There was a statistically significant relation between the abutment diameter and the bone stress around the implant (P < 0.0001), with F values indicating differences in the two population variances (a higher F value indicates that the difference between two populations is more significant). The obtained F values indicated that the abutment diameter affected the stress in the surrounding bone more significantly in the VL condition than in the OL condition (F = 212.43 vs 29.56; see Table 5). The use of reduced-diameter abutments reduced the bone stress more for a vertically applied
force than for an oblique force.
Lengthening the abutment connection depth significantly decreased the bone stress under both VL and OL (P < 0.0001 for both), which might be due to the increased contact area between the abutment and implant. The stress distribution in models W4_D8_T2 and W4_D4_T2 under VL are shown in Fig. 5 for comparison. The cross-sectional views of the stress distributions in the fixtures (Fig. 5a & c) reveal that a longer abutment connection depth (W4_D8_T2 vs W4_D4_T2) provided a larger contact interface to transmit stresses. According to the definition of stress (σ = F/A; where σ, F, and A represent the stress, force, and area, respectively), a larger contact area will help to reduce the stress in the implant and hence also in the bone as shown in model W4_D8_T2 (Fig. 5b & d). The F values indicated that the abutment connection depth affected the stress in the surrounding bone stress more significantly in the OL condition than in the VL condition (F =27.66 vs 16.22; see Table 5). This indicated that the stress-reduction effect by increasing the abutment connection depth was more pronounced for an oblique force than for a vertical force.
The F values were higher for the abutment diameter than for the abutment connection depth, indicating that the former had a greater influence on the induced stresses (F =212.43 vs 16.22 for VL, and 29.56 vs 27.66 for OL). Therefore, the abutment diameter has been recommended as the major factor for reducing bone stress. However, increasing the connection depth between the abutment–implant joint could be another method for further reducing the bone stress. For the results of the comparison of the abutment taper, the relation between the abutment taper and the bone stress was not statistically significant under VL (P = 0.0002) and OL (P = 0.83) conditions. Even though taper-shaped implant has been suggested to reduced the surrounding bone stress23, the taper angle of a tapered implant–abutment interface
might have a negligible effect on the bone stress as compared to the abutment diameter and connection depth, as indicated by the respective P values.
The limitations of this study were the simplified implant geometry, material properties of bone, and loading condition. The impact of the abutment–implant interface on bone stress might be directly affected by the implant geometry, such as the implant shape19, 24 and the thread profile25. To the best of our knowledge, material properties of bone are anisotropic and inhomogeneous. Even though the bone model in this study are anisotropic material properties, real bone properties with inhomogeneous assumption in the FE analysis may result in different stress/strain patterns. In addition, the bone quality is different in various parts of the jaw. These limitations should be further investigated in future studies. Moreover, although static oblique and vertical loadings have been suggested to represent a realistic occlusal load26, other loading conditions combined with implant positions27 may also be considered in future investigations.
Conclusion
Within the limitations of this study, the following conclusions can be drawn: 1. With the internal tapered abutment–implant interface, the abutment diameter
might be the major factor to be considered for reducing the bone stress. Reducing abutment diameter had more pronounced effect on reducing the bone stress, especially under vertical loading, but it also produce a higher risk of abutment fracture.
2. Abutment connection depth might be another factor to be considered. Lengthening the connection depth would increase the contact area at the abutment–implant interface and could reduce the bone stress, especially in
the oblique loading condition.
3. Degree of taper in the tapered abutment–implant joint did not influence the bone stress under both vertical loading and oblique loading conditions. The degree of abutment taper might have a negligible effect on the bone stress compared to the abutment diameter and connection depth.
Conflict of interest statement
The authors declare no financial relationship with any private companies or organizations related to this study.
Acknowledgement
This research was supported by China Medical University (CMU99-S-22) in Taiwan.
References
1. Frost HM. A 2003 update of bone physiology and Wolff's law for clinicians. Angle Orthod 2004;74:3-15.
2. Brunski JB, Puleo DA, Nanci A. Biomaterials and biomechanics of oral and maxillofacial implants: current status and future developments. Int J Oral Maxillofac Implants 2000;15:15-46.
3. Huang HL, Hsu JT, Fuh LJ, Lin DJ, Chen MYC. Biomechanical Simulation of Various Surface Roughnesses and Geometric Designs on an Immediately Loaded Dental Implant. Comput Biol Med 2010;40:525-532.
4. Mollersten L, Lockowandt P, Linden L. Comparison of strength and failure mode of seven implant systems: an in vitro test. J Prosthet Dent 1997;78:582-591. 5. Khraisat A, Stegaroiu R, Nomura S, Miyakawa O. Fatigue resistance of two
implant/abutment joint designs. J Prosthet Dent 2002;88:604-610.
6. Bozkaya D, Müftü S. Mechanics of the tapered interference fit in dental implants. J Biomech 2003;36:1649-1658.
7. Merz BR, Hunenbart S, Belser UC. Mechanics of the implant-abutment connection: an 8-degree taper compared to a butt joint connection. Int J Oral Maxillofac Implants 2000;15:519-526.
8. Bozkaya D, Muftu S, Muftu A. Evaluation of load transfer characteristics of five different implants in compact bone at different load levels by finite elements analysis. J Prosthet Dent 2004;92:523-530.
9. Baggi L, Cappelloni I, Maceri F, Vairo G. Stress-based performance evaluation of osseointegrated dental implants by finite-element simulation. Simul Model Pract Th 2008;16:971-987.
influencing mechanical characteristics of a single tooth implant placed in the maxilla using finite element analysis and the statistics-based Taguchi method. Eur J Oral Sci 2007;115:408-416.
11. Cochran DL, Bosshardt DD, Grize L, et al. Bone response to loaded implants with non-matching implant-abutment diameters in the canine mandible. J Periodontol 2009;80:609-617.
12. Schrotenboer J, Tsao YP, Kinariwala V, Wang HL. Effect of microthreads and platform switching on crestal bone stress levels: a finite element analysis. J Periodontol 2008;79:2166-2172.
13. Maeda Y, Miura J, Taki I, Sogo M. Biomechanical analysis on platform switching: is there any biomechanical rationale? Clin Oral Implants Res 2007;18:581-584. 14. Hansson S. A conical implant-abutment interface at the level of the marginal bone
improves the distribution of stresses in the supporting bone. An axisymmetric finite element analysis. Clin Oral Implants Res 2003;14:286-293.
15. Chun HJ, Shin HS, Han CH, Lee SH. Influence of implant abutment type on stress distribution in bone under various loading conditions using finite element analysis. Int J Oral Maxillofac Implants 2006;21:195-202.
16. Kong L, Sun Y, Hu K, Liu Y, Li D, Qiu Z, et al. Selections of the cylinder implant neck taper and implant end fillet for optimal biomechanical properties: a
three-dimensional finite element analysis. J Biomech 2008;41:1124-1130. 17. Alkan I, Sertgöz A, Ekici B. Influence of occlusal forces on stress distribution in
preloaded dental implant screws. J Prosthet Dent 2004;91:319-325.
18. O'Mahony AM, Williams JL, Spencer P. Anisotropic elasticity of cortical and cancellous bone in the posterior mandible increases peri-implant stress and strain under oblique loading. Clin Oral Implants Res 2001;12:648-657.
19. Huang HL, Chang CH, Hsu JT, Fallgatter AM, Ko CC. Comparison of implant body designs and threaded designs of dental implants: a 3-dimensional finite element analysis. Int J Oral Maxillofac Implants 2007;22:551-562.
20. Kawaguchi T, Kawata T, Kuriyagawa T, Sasaki K. In vivo 3-dimensional measurement of the force exerted on a tooth during clenching. J Biomech 2007;40:244-251.
21. Canay S, Akça K. Biomechanical aspects of bone-level diameter shifting at implant-abutment interface. Implant Dent 2009;18:239-248.
22. Hsu JT, Fuh LJ, Lin DJ, Shen YW, Huang HL. Bone strain and interfacial sliding analyses of platform switching and implant diameter on an immediately loaded implant: Experimental and 3D finite element analyses. J Periodontol
2009;80:1-12.
23. Degerliyurt K, Simsek B, Erkmen E, Eser A. Effects of different fixture geometries on the stress distribution in mandibular peri-implant structures: a 3-dimensional finite element analysis. Oral Surg Oral Med Oral Pathol Oral Radiol Endod 2010;110:e1-e11.
24. Petrie CS, Williams JL. Comparative evaluation of implant designs: influence of diameter, length, and taper on strains in the alveolar crest: A three-dimensional finite-element analysis. Clin Oral Implants Res 2005;16:486-494.
25. Chun HJ, Cheong SY, Han JH, et al. Evaluation of design parameters of osseointegrated dental implants using finite element analysis. J Oral Rehabil 2002;29:565-574.
26. Geng JP, Tan KBC, Liu GR. Application of finite element analysis in implant dentistry: a review of the literature. J Prosthet Dent 2001;85:585-598.
bone loss of an implant placed in the maxilla: prediction using FEA and SED bone remodeling algorithm. J Biomech 2010;43:644-651.
Figure legends
Fig. 1 The three parameters of the implant–abutment model: abutment diameter (W), abutment connection depth (D), and degree of abutment taper (T).
Fig. 2 Cross-sectional views of the solid model (a) and the finite element (FE) model (b).
Fig. 3 Convergence testing of the FE model meshed with various element sizes. Fig. 4 Stress distributions in the fixture and the cortical bone. Models W3_D4_T2 (a, b) and W4_D4_T2 (c, d) under VL are shown for comparison. Model W3_D4_T2 has a thicker implant wall to distribute the stress (a) and resulted in a lower peak bone stress (b) than model W4_D4_T2 (c, d) surrounding the implant shoulder.
Fig. 5 Stress distributions in the fixture and the cortical bone. Models W4_D8_T2 (a, b) and W4_D4_T2 (c, d) under VL are shown for comparison. Model W4_D8_T2 provided a larger contact interface between the implant and the abutment to distribute the stress (a) and resulted in a lower peak bone stress (b) than model W4_D4_T2 (c, d) surrounding the implant shoulder.
Table 1. Design parameters. Thirty-six implant–abutment models were constructed based on combinations of the various parameters. Abutment diameter (W) Abutment connection depth (D) Degree of abutment taper (T) 3 mm 4 mm 2∘ 3.5 mm 6 mm 4∘ 4 mm 8 mm 6∘ 8∘
Table 2. Material properties in finite element models. The symbols indicating the x, y, and z axes represent the mesiodistal, upper-lower, and linguobuccal directions, respectively.
Material Young’s modulus E (MPa) Poisson’s ratio ν Shear modulus G (MPa) Ex 19400 ννxy yz 0.390 0.300 Gxy 5700 Ey 12600 ννxz yx 0.390 0.253 Gyz 4850 Cortical bone Ez 12600 ννzy zx 0.300 0.253 Gxz 5700 Ex 1148 ννxy yz 0.055 0.010 Gxy 68 Ey 210 ννxz yx 0.322 0.010 Gyz 68 Trabecular bone Ez 1148 ννzy zx 0.055 0.322 Gxz 434 Titanium 117000 0.30
Table 3. Maximum von Mises stress of bone surrounding the implant shoulder under vertical loading (VL). Model von Mises stress under VL (MPa) Model von Mises stress under VL (MPa) Model von Mises stress under VL (MPa) W3_D8_T2 18.9 W3.5_D8_T2 19.9 W4_D8_T2 21.1 W3_D8_T4 18.8 W3.5_D8_T4 19.4 W4_D8_T4 20.8 W3_D8_T6 18.7 W3.5_D8_T6 19.6 W4_D8_T6 20.4 W3_D8_T8 18.7 W3.5_D8_T8 19.5 W4_D8_T8 20.3 W3_D6_T2 19.0 W3.5_D6_T2 19.7 W4_D6_T2 21.9 W3_D6_T4 18.9 W3.5_D6_T4 19.9 W4_D6_T4 21.1 W3_D6_T6 18.8 W3.5_D6_T6 19.7 W4_D6_T6 20.7 W3_D6_T8 18.8 W3.5_D6_T8 19.6 W4_D6_T8 20.5 W3_D4_T2 19.4 W3.5_D4_T2 20.1 W4_D4_T2 22.1 W3_D4_T4 19.5 W3.5_D4_T4 20.0 W4_D4_T4 21.7 W3_D4_T6 19.4 W3.5_D4_T6 20.1 W4_D4_T6 21.2 W3_D4_T8 19.1 W3.5_D4_T8 19.5 W4_D4_T8 20.8
Table 4 Maximum von Mises stress of bone surrounding the implant shoulder under oblique loading (OL).
Model von Mises stress under OL (MPa) Model von Mises stress under OL (MPa) Model von Mises stress under OL (MPa) W3_D8_T2 38.7 W3.5_D8_T2 39.7 W4_D8_T2 41.1 W3_D8_T4 39.2 W3.5_D8_T4 39.4 W4_D8_T4 41.0 W3_D8_T6 39.6 W3.5_D8_T6 40.4 W4_D8_T6 41.4 W3_D8_T8 39.8 W3.5_D8_T8 40.9 W4_D8_T8 41.5 W3_D6_T2 39.1 W3.5_D6_T2 39.9 W4_D6_T2 44.3 W3_D6_T4 39.4 W3.5_D6_T4 40.6 W4_D6_T4 42.5 W3_D6_T6 39.7 W3.5_D6_T6 40.7 W4_D6_T6 42.2 W3_D6_T8 39.8 W3.5_D6_T8 40.9 W4_D6_T8 42.0 W3_D4_T2 41.1 W3.5_D4_T2 43.7 W4_D4_T2 50.7 W3_D4_T4 41.1 W3.5_D4_T4 42.9 W4_D4_T4 47.9 W3_D4_T6 41.0 W3.5_D4_T6 43.0 W4_D4_T6 46.5 W3_D4_T8 40.9 W3.5_D4_T8 42.0 W4_D4_T8 46.2
Table 5. Mean and standard deviation (SD) values of the
maximum von Mises bone stress under VL and OL for different values of abutment diameter (W), connection depth (D), and degree of taper (T). Design factors Dimension Mean_VL (MPa) SD_VL Mean_OL (MPa) SD_OL W 3.0 mm 19.00 0.286 39.95 0.846 3.5 mm 19.75 0.243 41.17 1.416 4.0 mm 21.05 0.589 43.92 3.188 P < 0.0001* F value = 212.43 P < 0.0001* F value = 29.56 D 4 mm 20.24 0.988 43.92 3.203 6 mm 19.88 0.993 40.91 1.532 8 mm 19.68 0.834 40.21 0.928 P < 0.0001* F value = 16.22 P < 0.0001* F value = 27.66 T 2∘ 20.23 1.195 42.03 3.777 4∘ 20.01 1.001 41.55 2.732 6∘ 19.84 0.838 41.60 2.138 8∘ 19.64 0.745 41.54 1.914 P = 0.0002 F value = 9.25 P = 0.83 F value = 0.3 *significant difference for P < 0.0001 (ANOVAs)