應用於區域觀光產業之色彩意象化目的地推薦研究 - 政大學術集成
113
0
0
全文
(2) Abstract. This research presents a recommendation service system that considers the image as a uniform representation of tourist images (include self-image and emotional needs), destinations, and local SMEs. Images carried by each stakeholder roles are modeled and managed by several system modules, and they also evolve to reflect the real time situations of each entity. In addition, the system is dynamic in terms of its emphasis on the relationships among these roles. When interactions occur, image mixing will be conducted to derive extra image attributes for the adjustments of the. 政 治 大. images. Besides, since colors can be mapped onto emotions, we use colors to. 立. operate the image matching and mixing process to find good matches of. ‧ 國. 學. destinations for the recommendation. This image related approach we proposed is domain-independent. We believe our method could contribute to other areas of. ‧. practical applications and academic studies.. sit. y. Nat. n. al. er. io. Keywords: Recommendation System, Image Modeling, Image Mixing, Destination Recommendation, Color Science.. Ch. engchi. i. i n U. v.
(3) TABLE OF CONTENT CHAPTER 1 INTRODUCTION ................................................................................... 1 1.1 Background and Motivation ............................................................................ 1 1.2 Research Question ........................................................................................... 3 1.3 Research Method ............................................................................................. 4 1.4 Purpose and Contribution ................................................................................ 6 1.5 Content Organization ....................................................................................... 7 CHAPTER 2 LITERATURE REVIEW ......................................................................... 9 2.1 Travel recommendation system ....................................................................... 9 2.2 Tourist Expectation Formation....................................................................... 15 2.3 Color Emotion and Color Mixture ................................................................. 20. 政 治 大 3.1 Conceptual Framework of uVoyage Service Platform ................................... 24 立 3.2 uVoyage System Architecture ........................................................................ 26. CHAPTER 3 MOTIVATING APPLICATIONS .......................................................... 24. ‧ 國. 學. CHAPTER 4 COLOR IMAGERY FOR DESTINATION RECOMMENDATION ... 29 4.1 The Conceptual Framework ........................................................................... 29. ‧. 4.2 System Architecture ....................................................................................... 33 4.3 Modeling Module........................................................................................... 36. y. Nat. 4.4 Interaction Module ......................................................................................... 41. sit. 4.5 Adaption Module ........................................................................................... 47. al. er. io. 4.6 Matching Module ........................................................................................... 48. v. n. CHAPTER 5 Application Scenario .............................................................................. 50. Ch. i n U. 5.1 Service journey of the application ................................................................. 50. engchi. CHAPTER 6 EVALUATION ...................................................................................... 57 6.1 Hypotheses ..................................................................................................... 57 6.2 Assumptions ................................................................................................... 59 6.3 Design Parameters ......................................................................................... 60 6.4 Experiments and Results ................................................................................ 83 CHAPTER 7 CONCLUSION...................................................................................... 95 7.1 Contributions.................................................................................................. 95 7.2 Managerial Implications ................................................................................ 97 7.3 Limitations and Future works ........................................................................ 97 REFERENCE ................................................................................................................. a Appendix A – The mapping relations between image words and colors ....................... g. ii.
(4) TABLE OF CONTENT (FIGURE) Figure 1. Determinants of Users' Expectations .......................................................... 2 Figure 2. The Process of Motivation and Expectation Formation ........................... 17 Figure 3. The destination branding and tourist decision-making process................ 19 Figure 4. Single Color Image Scale ......................................................................... 22 Figure 5. Key Word Image Scale ............................................................................. 22 Figure 6. Conceptual framework of uVoyage service platform ............................... 25 Figure 7. uVoyage Service System Platform Architecture ....................................... 27 Figure 8. Conceptual framework of the destination recommendation system ......... 29. 政 治 大 Figure 10. Image Matrices in three formats ............................................................. 41 立 Figure 11. Concept of mapping emotional words onto colors ................................. 41 Figure 9. Architecture of the destination recommendation system .......................... 35. ‧ 國. 學. Figure 12. Influences of the interactions among stakeholders‘ roles ....................... 43 Figure 13. The image mixing process for an alliance comprising the images of 3. ‧. SMEs (Pounded Tea, Bull Cart, And Kiln BBQ) ............................................. 44 Figure 14. Harmonic templates on the hue wheel. A collection of colors that fall. y. Nat. into the gray areas is considered to be harmonic. ............................................ 49. sit. Figure 15. The Service journey of business and tourist ........................................... 51. al. er. io. Figure 16. The Service journey of destination and tourist ....................................... 52. v. n. Figure 17. Registration page for tourist users on uVoyage platform ....................... 53. Ch. i n U. Figure 18. Travel service recommendation page on uVoyage platform .................. 54. engchi. Figure 19. Service information page on uVoyage platform ..................................... 55 Figure 20. Image elements we use in RGB space .................................................... 61 Figure 21. Basic Concept of Image Mixing ............................................................. 67 Figure 22. Shortened distance between image models‘ centers of gravity after several times of interactions............................................................................. 68 Figure 23. The comparison of image mixing performance after ‗dirty image filter‘ adopted ............................................................................................................. 71 Figure 24. Image mixing with different settings ...................................................... 75 Figure 25. Image mixing of image models whose main images come from different angles of color pairs ......................................................................................... 76 Figure 26. Life cycle of a service provider‘s image model ..................................... 77 Figure 27. Visualization of image mixing process (30% shortened distance) ......... 78 Figure 28. Visualization of image mixing process (81% shortened distance) ......... 79 iii.
(5) Figure 29. Validation of designed weights for interactions between different stakeholder roles .............................................................................................. 82 Figure 31. The entry page of the experimental site.................................................. 86 Figure 32. Recommendation page ........................................................................... 87 Figure 33. The second search page for a user .......................................................... 87 Figure 34. Transforming processes of two travel regions in different contexts ....... 94 Figure 35. Changing of service diversities of two destinations in different contexts .......................................................................................................................... 94. 立. 政 治 大. ‧. ‧ 國. 學. n. er. io. sit. y. Nat. al. Ch. engchi. iv. i n U. v.
(6) TABLE OF CONTENT (TABLE) Table 1. The Comparison among Recommendation Technologies .......................... 15 Table 2. Exemplars of Image Attributes/Elements in Modified Color Image Scale 40 Table 3. Computing of image mixing ...................................................................... 46 Table 4. Experiment of image mixing ...................................................................... 47 Table 5. Initial Quantity Setting of Image Elements in an Image Model ................ 62 Table 6. Typical Tourist Image Models .................................................................... 63 Table 7. Shortened distance average of two settings of the image mixing method . 68 Table 8. Adjective Category of Image Elements...................................................... 69. 政 治 大 Table 10. The Image Attributes of Kenting‘s Image ................................................ 72 立 Table 11. The Image Attributes of Taroko‘s Image .................................................. 73 Table 9. Dirty Image Elements which Frequently Appear but Are Unwanted ........ 70. ‧ 國. 學. Table 12. Tourist Type Description .......................................................................... 85 Table 13. Genre options for user registration ........................................................... 85. ‧. Table 14. Statistics of precision value for the first experiment ................................ 89 Table 15. Statistics of precision value for the second experiment (search. n. al. er. io. sit. y. Nat. keywords are open-anwsered).......................................................................... 90. Ch. engchi. v. i n U. v.
(7) CHAPTER 1 INTRODUCTION 1.1 Background and Motivation. Over the past twenty years, the supply and demand of tourism have transformed for the dynamism of the global economy and the evolution of technology. These changes include the severer competition between destinations, more and more international tourists, and the increased frequency of short trips for people (OECD, 2010). Besides, experience economy is a trend emerging into tourism. Innovation occurred in the service delivery and the product development for SMEs within. 治 政 destinations (e.g. restaurants, accommodations) (OECD, 大 2010); tourists incline to 立 customized and flexible travel products and services (Stamboulis and Skayannis, ‧ 國. 學. 2003). In the end, SMEs as service providers co-create service experiences with. ‧. their customers during the journey. Then tourists gain the value through evaluating the customized service experiences (Sandström et al., 2008).. y. Nat. er. io. sit. The destination recommendation system (DRS) or the travel recommendation system is one of the information technologies having impacts on value creation. al. n. v i n (OECD,C2010). Its functions include hengchi U. chains of tourism. not only the travel. information provision, but also suggesting end consumers destinations and arouse their desires to visit the places (Skadberg et al., 2005). Therefore, DRS is supposedly an appropriate tool to increase the destinations‘ competence level by establishing a mutual relationship between destinations and tourists, and satisfy tourists all over the world via recommending favorable destinations (Yuksel and Bilim, 2009). DRS provide an object situation for tourists to review existing destinations. These destinations are dynamic ranked by DRS according to individual customers 1.
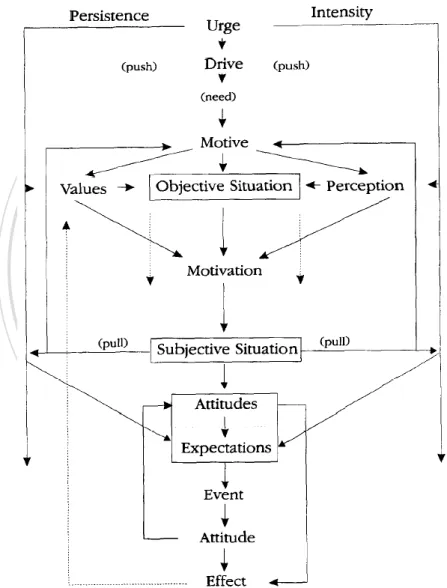
(8) for alleviating their burden of searching through thousands and hundreds of tourism products and services on the Internet. Nevertheless, it has been widely recognized that a gap exists between customers‘ expected services and their perceived services provided by information systems as shown in Figure 1 (Pitt et al., 1995). Being an information system, it is vital for DRS to understand what tourists want, i.e. the customers‘ expectations, in order to close this gap. Actually, capturing the personal needs (as shown in Figure 1) of tourists is an essential step to derive the tourist satisfaction of recommenders that aim at providing. 政 治 大 Further, tourism is an experience based industry. These experiences are 立. information of desirable destinations and SMEs within tourism destinations.. ‧ 國. 學. individually unique and emotion attached. It was claimed that insufficient attention has been paid to the service experiences, including the emotional. ‧. dimensions (Sandström et al., 2008). Therefore, a DSR should have capabilities of. sit. y. Nat. capturing tourists‘ needs, especially the emotional needs, and producing. n. al. er. io. recommendation according to the psychological or emotional properties of tourism products and services.. Ch. engchi. i n U. v. Figure 1. Determinants of Users' Expectations (Pitt et al., 1995). 2.
(9) 1.2 Research Question. Since the emotional information and experiences of tours occur and are confined to only individuals, we argued that a DRS have to capture both tourists‘ minds, i.e. the emotional needs, and the psychological elements of destinations, in order to suggest customers the best fit results. Without capturing tourists‘ minds in recommendations, the DRS would find itself only satisfied restricted market segments that people favor popular attractions. Reviewing. recommendation. systems. or. platforms. 政 治 大. nowadays,. the. technologies they used are generally categorized into content-based, collaborative. 立. filtering, knowledge-based, and hybrid methods. However, we found all of these. ‧ 國. 學. technologies are function oriented, such as content-based recommendation deals with the product descriptions (Zhang et al., 2009); collaborative filtering stresses. ‧. on the rating data (Wang et al., 2006); and knowledge-based infers. y. Nat. n. al. er. io. the mapping relations between them (Burke, 2002).. sit. recommendation results from functional knowledge about customers, items, and. i n U. v. Besides, in the previous research, customer expectations and needs were only. Ch. engchi. represented with questionnaires (Quader, 2009; Robledo, 2001) or a query input describing item information and constraints. But for an efficient travel recommendation system, there have to be a uniform representation which can stand for tourist expectations (emphasizing the emotional needs), destinations, and SMEs so that we can manipulate them to do the matching through a uniform comparison of their similarities. In this way, the flexibility of questionnaires appears to be insufficient to reflect these three stakeholder roles‘ real-time images, because the result data is static and limited by the question designers. For the competition in the flourishing tourism industry, the images perceived 3.
(10) by consumers play an important role to destinations and SMEs. Images convey experiences that consumers are likely to gain from a journey. In the decision making process, consumers can reduce the number of alternatives through comparing their expectations with the images of destinations and SMEs. Images can also be a key component in the destination positioning process (Echtner and Ritchie, 2003). Destinations and SMEs can also create their own positive images in order to differentiate themselves from competitors by modifying their operations and policies through diagnosing their own images.. 政 治 大 destinations, SMEs, and tourists in our DRS. The reasons include: (1) image is an 立. We believe that images can serve as the uniform representation for. ‧ 國. 學. output of the mental picturing process which people will execute before starting a trip; and (2) images have been commonly used in the marketing of tourism. ‧. destinations (Robledo, 2001); (3) images can be expressed in languages, so that. y. sit. n. al. er. io. open-ended.. Nat. the material for images can be obtained from Web resources and is dynamic and. v. In this research, we investigate two research questions. The first is how to. Ch. engchi. i n U. devise a systematic method to measure and model images. The second is what will happen to these images when roles interactions and social events occur. This research proposes a resolution method and system in response to two questions and the method has two main components—Image Modeling and Image Mixing— that will be illustrated later.. 1.3 Research Method. In our system, each tourist, destination, and SME has their own image, which consists of psychological adjectives. We utilize color as a tool to model all the 4.
(11) images of these stakeholder roles. Color impacts our everyday life. We can treat it as a source of information to make decisions based on the aroused emotions. It is widely accepted that color can be mapped onto emotions (Xin et al., 1998; Kobayashi, 1981, 1992, 2001; Nijdam, 2005; Ou et al., 2004; Suk and Irtel, 2010). To name a few, the red color can stand for festive and hot feelings; green can be associated with a peaceful or health image. Although the reaction to colors varies person by person, researchers have clarified that there exist universal color factors, including warm–cool, heavy–light,. 政 治 大 Kobayashi and the Nippon Color & Design Research Institute developed 立. active–passive, and hard–soft (Ou et al., 2004).. ‧ 國. 學. Color Image Scale (Kobayashi, 1981, 1992, 2001), which specified the meaning of 130 basic colors according to the two factors: warm–cool and hard–soft. These. ‧. meanings were assigned with 180 image words (adjectives). On the scale, the. sit. y. Nat. similarity and dissimilarity of the emotional word meanings are indicated with the. n. al. er. io. distances between the corresponding colors.. v. With these color-emotion mapping knowledge, we can obtain more. Ch. engchi. i n U. information dimensions about our image models than word meanings, such as their inter relations with precise distances on a color space, the possible matching pairs among them according to the color harmony theory. For example, a man with an image model mainly colored red which means festive and dazzling, and hot. He will be pleased with our recommendation—Taichung and Pingxi Sky Lantern, in all likelihood. Sometimes, things with different images or emotions will be put together to obtain a fresh new image. For example, SMEs will forge an alliance to build distinguishing features for attractiveness and uniqueness. Besides, the images 5.
(12) carried by tourists, SMEs, and destinations will influence each other during their interactions. To understand the consequences of these alliances and interactions to the images, the image mixture should be functioned in our system. Since images can be represented by colors, the image mixture may have a strong connection to the color mixture. We propose that the additive color mixing method (normally used to do the light mixture) can serve as the tool for image mixing, for the reason that image or impression is virtual. That means there is no need to concern about its spectral composition, which is a consideration when. 政 治 大 1992). With this color mixing method, we can not only shrink the distance 立. mixing pigment or printed colors which use subtractive color mixing (Broackes,. ‧ 國. 學. between the images and the real status of the stakeholder roles by reflecting the real-time interactions between these stakeholder roles, but also foreseen the results. ‧. of potential SME alliances.. y. Nat. n. er. io. al. sit. 1.4 Purpose and Contribution. v. The aim of this research is to demonstrate a destination recommendation system. Ch. engchi. i n U. that uses images to capture tourists‘ needs or intrinsic motives, and recommends destinations and SMEs which can meet tourists‘ emotional needs. In addition, the design, method, and architecture of this system could be domain-independent and applicable to a wide range of services. It recommends people things what they can be satisfied based on images which represent both objects and humans‘ minds. The results of the system are dynamic which evolve over time through the expected changes derived from the 3 stakeholders‘ role interactions and the unexpected changes caused by casual events of society. With this approach, we can find good matches between human and objects (tangible, intangible) based on 6.
(13) emotional needs. In addition, none of the field of information system studies has ever utilized images as the representation of customer expectations, and recommended people the destinations and SMEs according to their images. It is difficult because images are psychological related. Our system is also in line with Service-Dominant Logic (Vargo & Lusch 2004), which is a mindset distinguished from Goods-Dominant Logic. Service-Dominant Logic highlights several perspectives such as service exchange,. 政 治 大 people can rethink role relationships, resources integration, IT facilitation, etc. to 立 operant resources, co-creation of value, and value in-use. With these concepts,. ‧ 國. 學. gain profound understanding about the service system. In the end, they can be innovative means with a combination of integrated operand and operant resources. ‧. to fulfill demands. In this research, the recommendation information system is. sit. y. Nat. also a dynamic service system which evolves over time. Images of tourists,. n. al. er. io. destinations, and SMEs will change according to the interactions between each. v. other. The active image, therefore, can be regards as an operant resource.. Ch. engchi. i n U. Moreover, the good matches can only be found when customers have a willingness to provide their needs or intrinsic motives of destinations and to be involved in the image modeling process, e.g. attendance of trips and feedbacks, which correspond to the concept of value in-use.. 1.5 Content Organization. This research is organized as follow brief introductions: . Chapter 2 – Literature Review This chapter compares different recommendation technologies in the 7.
(14) mainstream. Each of them has their own merits and shortcomings. By introducing the between them and ours, our system can be positioned as a model-based recommendation system. . Chapter 3 – Motivation Application This chapter depicts the whole picture of our research project that this research is one of its underlying components.. . Chapter 4 – Color Imagery for Destination Recommendation In this chapter we introduce the conceptual framework and the system. 政 治 大 detailed design and methodology will be described, including the explanation 立. architecture of the color imagery destination recommendation system. The. ‧ 國. Chapter 5 – Application Scenario. . Chapter 6 – Evaluation. ‧. . 學. of Image Modeling and Image Mixing components.. y. sit. n. al. er. Chapter 7 – Conclusion. io. . Nat. Hypotheses and six experiments for evaluation are depicted in this chapter.. v. Contributions, implications, limitations, and future works of our research are. Ch. provided in this chapter.. engchi. 8. i n U.
(15) CHAPTER 2 LITERATURE REVIEW. This section reviews three topics. First, we briefly introduce and discuss popular recommendation technologies used in recommendation systems today, and position our research work through identifying their similarities and differences and examining the characteristics of tourism environment. Second, we overview the tourism expectation formation and define our target customers by clarifying their needs. Last, we introduce the relationship between color and emotion, color mixture, and their related works. From the literature review about colors and their. 政 治 大. relations to psychology and mathematics, we believe colors can serve as a. 立. modeling tool for representing and computing the images of the tourist expressive. ‧ 國. 學. needs (psychologically dominant) and the images of destinations. In this research, we propose a model-based DRS that is based on color modeling and computing. ‧. and emphasizes the emotional tourist service experience. sit. y. Nat. io. n. al. er. 2.1 Travel recommendation system. i n U. v. Recommendation systems (RS) are designed for comforting people searching for. Ch. engchi. objects they want/need including but not limiting to products and services, or for navigating them with information in a complex environment where a large number of options exist. With characteristics actively or passively provided by users, recommendation systems can facilitate their decision making process in an individualized way (Burke, 2002; Göksedef and Gündüz-Ö güdücü, 2010; Zhang et al., 2009). In practice, recommendation systems are widely applied in e-commerce, for example, Amazon.com successfully utilizes recommendation technology upon the principle ―people who bought X also bought Y‖ to suggest customers‘ favorable 9.
(16) merchandises (Burke, 2002; Towle and Quinn, 2000; Wang et al., 2006). As one of e-commerce instances, the travel information service has additional features including wide-data, diverse types, and highly experience-related (OECD, 2010; Zhang et al., 2009). Before discussing travel recommendation systems, we reviewed several recommendation technologies commonly used today in the following paragraphs. Technologies used in recommendation systems can be generally categorized into content-based recommendation, memory-based (includes user-based and. 政 治 大 recommendation, and hybrid recommendation 立. item-based) and model-based methods of collaborative filtering technology, knowledge-based. systems. ‧ 國. 學. composed by some of above technologies and other technologies as extensions (e.g. grid technology and semantic ontology) (Burke, 2002; Ricci, 2002; Towle. ‧. and Quinn, 2000; Wang et al., 2006; Weng et al., 2009; Zhang et al., 2009).. sit. y. Nat. Content-based recommendation utilizes item descriptions whose format can. n. al. er. io. be either text-based or attribute-value based. Basically, it retrieves items to match. v. user needs, preferences, and constraints represented in provided languages (e.g.. Ch. engchi. i n U. attributes) (Bridge et al., 2005; Ricci, 2002). In advance, similar to item-based approach emphasizing on rating data, Burke (2002) and Huang (2008) declare that content-based approach performs the recommendation based on the similarities between the content of a particular object and the contents of those objects in the current user‘s selection history. The most significant shortcoming of content-based method is the difficulty to analyze the multimedia content of items (Huang, 2008; Zhang et al., 2009). Another issue may arise owing to the necessity of constructing categories with a set of feature variables for each kind of item. This is also the reason why many travel recommendation systems only focus on the suggestion of 10.
(17) destinations, which are comparatively stable and reusable concepts (Ricci, 2002). Instead of dealing with item contents, collaborative filtering approaches usually concentrate on rating data enabling the ability to represent complex objects such as music and movies. They are often divided into two categories: memory-based (which includes user-based and item-based method) and model-based (Burke, 2002; Wang et al., 2006). In memory-based approach, a user-item matrix will form in the recommendation system through collecting scoring information explicitly or implicitly from users. With this matrix,. 政 治 大 items according to the historical rating data of his ―nearest neighbors‖, a team of 立. user-based collaborative filtering predicts the scores of the current user‘s unrated. ‧ 國. 學. users having similar preferences with the current user; while pure item-based collaborative filtering predicts the score of a particular item by averaging the. ‧. current user‘s rating data of similar items in the past. However, there often exists. sit. y. Nat. sparsity problem due to that only rated items can be recommended, or a user must. n. al. er. io. have rating records to be a candidate of ―nearest neighbors‖ (Bridge et al., 2005;. v. Burke, 2002; Göksedef and Gündüz-Ö güdücü, 2010; Wang et al., 2006; Zhang et. Ch. engchi. i n U. al., 2009). In certain cases, item-based approach is a better choice because the item quantity is comparatively stable. Generally, there is an option to pursue efficiency - unifying user-based and item-based approaches brings the expansibility against the limited accuracy caused by a small portion usage of the user-item matrix (Wang et al., 2006; Zhang et al., 2009). Model-based recommendation uses training examples (often historical rating data) with various learning technique (e.g. neural networks (Jennings and Higuchi, 1993), latent semantic indexing (Foltz, 1990), and Bayesian networks (Condliff et al., 1999)) to derive a model or to find patterns to predict item ratings for the 11.
(18) current user. It can dynamically reflect user interests, and soothe the sparsity problem to a certain degree (while knowledge-based approach is considered as a better solution to this problem but more difficult to realize). Although numerous parameters are needed to be tuned and the model construction is time-consuming (which can be implemented off-line), it is still worthwhile to adopt this approach because the quality of the recommendation results are usually found satisfying (Burke, 2002; Wang et al., 2006; Zhang et al., 2009). Knowledge-based recommendation infers the prediction with pre-existing. 政 治 大 being one of solutions to the challenges of memory-based collaborative filtering 立 functional knowledge describing how favorable items can meet user needs. While. ‧ 國. 學. there is still a tough point of this approach, the acquisition of knowledge. It requires knowledge about objects, knowledge about mappings between user needs. ‧. and objects, and user knowledge. Google search engine is a good example using. sit. y. Nat. knowledge about the relations between Web pages to infer the desired query. n. al. er. io. results (Burke, 2002). Furthermore, once the development of semantic ontology is. v. mature, the vision of the accurate, automatic, and intelligent recommendation. Ch. engchi. i n U. systems will come true (Burke, 2002; Hatala and Wakkary, 2005; Towle and Quinn, 2000; Zhang et al., 2009). Hybrid recommendation systems combine two or more recommendation techniques to construct a module for better performance (Burke, 2002; Göksedef and Gündüz-Ö güdücü, 2010). Hybridization methods are various including Weighted,. Mixed,. Switching,. Feature. Combination,. Cascade,. Feature. augmentation, and Meta-level. To adapt the dynamic e-commerce environment and various user needs, hybrid recommendation technologies are suitable solutions if adequate research work is conducted to define the tradeoffs (Burke, 12.
(19) 2002). Overall, recommendation technologies we. have discussed are. all. function-oriented which can be demonstrated in the following facts: 1) Content-based recommendation retrieves items from their descriptions. All the elements in this process including the queries from users, the matching method, and the item contents mainly manipulate functional item features such as a title and an author name of a book. 2) Collaborative filtering accounts on rating information from users. 3) Knowledge-based approach grounds functional knowledge related to. 政 治 大 2002). However, since tourism is an industry which is highly experience-related, it 立. items, users, and the relationship between the items and the user needs (Burke,. ‧ 國. 學. is beneficial for travel recommendation systems to take emotional elements of travel products and psychological emotional needs of tourists into account.. ‧. According to the review of tourism executed by OECD (2010), experience. sit. y. Nat. economy is a trend and innovating product development and service delivery in. n. al. er. io. tourism. SMEs within a travel destination provide services as value propositions. v. and co-create service experiences with their customers, where a service experience. Ch. engchi. i n U. is defined by B. Edvardsson (2005) as ―a service process that creates the customer‘s cognitive, emotional, and behavioral responses, resulting in a mental mark, a memory.‖ Finally, tourists evaluate the consumed service experiences according to the individual and situational filter, which results in the so-called value-in-use (Sandström et al., 2008). Service experience creates value. However, Sandström et al. (2008) claimed that ―insufficient attention has been paid to the total service experience, including the emotional dimensions.‖ Besides, experiences are memorable, revealed, sensed by individual (Pine and Gilmore, 1998). That is, we cannot conclude that any two 13.
(20) travelers‘ trips are the same even though they went together (Ricci, 2002). The comparison among different kinds of recommendation technology including ours is shown as the table 1.. 立. 政 治 大. ‧. ‧ 國. 學. n. er. io. sit. y. Nat. al. Ch. engchi. 14. i n U. v.
(21) Table 1. The Comparison among Recommendation Technologies Technique. Content-based Collaborative Filtering. Knowledge-based. Color Imagery. User-based /. Association. Item-based. Rules (Zhang et al., 2009) Content,. Descriptions. from Users,. Data. Items, Users, and. Transaction. Item. Mappings between. Data. Information. Items and User. 治 Features 政 Text or User-item 大 Attribute-value Matrix 立 Content-based. Knowledge. (Rules). Case-based. and Item. ‧. Retrieving. Nearest. Apriori. Neighbors,. Algorithm,. Case Similarity. sit. n. Books, Music. C h(Amazon.com) engchi Meteren and (PRES) (van. van Someren,. iv n (SurfLen) U Websites. Mixing Operational. Destinations,. Amplifiers. Service. Television Programs (PTVPlus) (Bridge et al., 2005). 2.2 Tourist Expectation Formation. In the previous section, we learned that most of recommendation systems do not catch users‘ expectations of suggested objects (preference-driven systems) or 15. Color Color. (Zhang et al., (Analog Devices) 2009). 2000). (Color. Matching ,. Item Similarity Frequency. al. Model-based Image). Model). Articles. Word / Color Vector. Memory-based Model-based Knowledge-based, (User Model. io. Output. Needs.. Nat. Algorithm. Information about. 學. Type. Transaction. ‧ 國. Mechanism. Rating Data. y. Representation. Item. er. Input. Providers.
(22) merely via inputting item descriptions and constraints (data-driven systems). However, customer expectations play an important role in IS service quality equaling the gap between the perception and the expectation of a service (Pitt et al., 1995). Capturing tourist expectations (emphasizing emotional needs) is thus essential to increase customer satisfactions of travel recommendation systems, which is highly experience related. Understanding tourist expectations is beneficial to tourism management and product development. According to Gnoth (1997), tourism expectation is defined. 政 治 大 and conations, whereby the conational element expresses itself in two aspects: the 立. as ―… positively or negatively inclined and contain measures of cognitions, affect,. ‧ 國. 學. intensity and persistence with which the confirmation or falsification is desired or longed for, and the extent to which the tourist evaluates levels of possible. ‧. satisfaction the targeted experiences might procure. In other words, expectations. sit. y. Nat. are tentative (mental or neural) representations of future events or unfinished. n. al. er. io. learning processes.‖ On the other hand, Truong and Foster (2006) considered. v. destination attractiveness or images perceived to examine the ability of satisfying. Ch. engchi. tourists‘ vacation needs as part of expectations.. i n U. The tourism expectation formation process was well illustrated in Gnoth (1997)‗s work shown as Figure 2. Initially, needs are established as an urge, which is emotional and can be deemed as an action tendency (pull factors). This action tendency leads to a person‘s perception reviewing an objective situation where objects such as destinations can satisfy tourists‘ motives. Motives here are distinct from motivations. The former can be regarded as latent needs and implies a direction and a target, while the latter actually includes the targets and becomes the results of the interaction between motives and situations with a person‘s 16.
(23) perception and value (or an individual filter, can be either cognition-dominant or emotion-dominant). Once motivations formed, people then stand in a subject situation existing stimuli of tourism objects (pull factors). Thus attitudes and expectations of travel products or services are shaped while the latter takes emotions into account.. 立. 政 治 大. ‧. ‧ 國. 學. n. er. io. sit. y. Nat. al. Ch. engchi. i n U. v. Figure 2. The Process of Motivation and Expectation Formation (Gnoth, 1997). In our destination recommendation system, things we capture from tourist are the intrinsic needs or the motives in Figure 2 (push factors), which are psychologically dominant and formed before the perception of value propositions 17.
(24) provided by SMEs in regional tourism (pull factors) (Gibson and Yiannakis, 2002). To adapt the rising demand for customized and flexible products and services in experience-based tourism (Stamboulis and Skayannis, 2003), we further narrowed our tourists‘ needs down to expressive needs (the other category is utilitarian needs), ―requirements for products/services that provide social or aesthetic utility‖, defined by MacInnis and Jaworski (as cited in Yuksel and Bilim, 2009). Expressive needs are composed of ―socially expressive needs (i.e., the desire to express one‘s actual self or ideal self-image) and experiential needs (i.e., the. 政 治 大. desire to consume products/service for their cognitive or sensory stimulation). 立. (Yuksel and Bilim, 2009)‖. ‧ 國. 學. During the tourism expectation formation process, questionnaires like the SERVQUAL and the HOLSAT instrument are the most common tools to represent. ‧. or model needs, motivations, and expectations (Pitt et al., 1995; Robledo, 2001;. sit. y. Nat. Truong and Foster, 2006). For the purpose of modeling psychological needs in a. al. er. io. recommendation system, however, the flexibility of questionnaires is insufficient to. v. n. reflect roles‘ real-time images, i.e. the result data is static and limited by the. Ch. engchi. i n U. question designers. Instead, a uniform, dynamic, and open-ended modeling tool has to be developed. Yuksel and Bilim (2009) declared that the more a brand personality of a destination is similar to a tourist‘s needs and the self-image, the more likely this destination is to satisfy him/her. The tourist decision process is shown as Figure 3, indicating that the destination branding starts from the evaluation of destination image with a strong emotion attached. The destination branding succeeds when a mutual relationship is established between destinations and tourists by satisfying their needs or motives. 18.
(25) The brand personality here can be treated as the destination image, a component authorities used to position the destination (Echtner and Ritchie, 2003). Tourists make decisions based on these images that will be interpreted by their motives and later become the attitudes and expectations toward the corresponding destinations (Yuksel and Bilim, 2009). On the other hand, the self-image is defined as ―the totality of the individual‘s thoughts and feelings having reference to himself/herself as an object or how individuals perceive themselves to be (Chon and Olsen; Litvin and Kar (as cited in. 政 治 大 Morrison (as cited in Yuksel and Bilim, 2009)).‖ Tourists preserve or enhance their 立 Yuksel and Bilim, 2009)) and as a mental picture of themselves (Chon and Olsen;. ‧ 國. 學. self-images via visiting favorable destinations and service providers whose images are regarded as matching with their own images (Yuksel and Bilim, 2009).. ‧. n. er. io. sit. y. Nat. al. Ch. engchi. i n U. v. Figure 3. The destination branding and tourist decision-making process (Yuksel and Bilim, 2009). 19.
(26) 2.3 Color Emotion and Color Mixture Color can evoke human‘s emotional feelings (Xin et al., 1998; Kobayashi, 1981; Nijdam, 2005; Ou et al., 2004; Suk and Irtel, 2010). Kobayashi (1981) stated that every color has its own meaning, which can be mapped onto one or more words. For example, ―red is regarded as adventurous, sociable, and powerful; yellow is thought to be cheerful, jovial, and exciting (Xin et al., 1998)‖ These emotional feelings, impressions, or images are called color emotions (Ou et al. 2004). Researchers contributed efforts to quantify the relationship between color and. 政 治 大. emotion for the advantages brought by the integration of color‘s physical property. 立. of the spectrum of light and its psychological nature. One of these advantages is that. ‧ 國. 學. color selection can be more objective if the emotions every color conveys are specified. Another is that using numerical value or standard colorimetric systems. ‧. such as RGB or CIE to represent color emotions facilitates the communication. y. Nat. sit. between different parties (e.g. Web designers and programmers) (Xin et al., 1998).. n. al. er. io. To achieve the goal of quantifying the color emotions, four color-emotion. i n U. v. factors are claimed to cross-culturally exist, including warm–cool, heavy–light,. Ch. engchi. active–passive, and hard–soft (Ou et al., 2004). These factors can be considered as color semantics or high-level properties which are color-induced sensations, whereas low-level properties are the syntactic characteristics such as hue, luminance and saturation (Corridoni et al., 1999). In the content based image retrieval field, researchers often combine the syntactic level and the semantic level to devise formulas for transforming colors into emotions (Corridoni et al., 1999; Solli and Lenz, 2009). However, the number results calculated by these formulas are convenient for machine computation but have a lack of human readability. Kobayashi intensified the combination of color science, color emotion and 20.
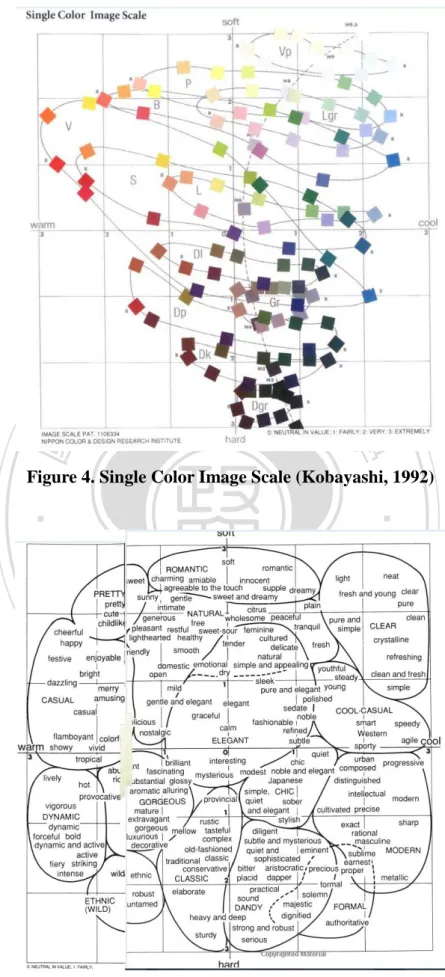
(27) word semantics. He and his team at the Nippon Color & Design Research Institute have developed Color Image Scale (Kobayashi, 1981, 1992, 2001), which explicitly defined the meanings of 130 basic colors (Figure 4) and over 1000 color combinations. Each of them is assigned one or more image words (an adjective) (Figure 5) through investigation and factor analysis. These colors are categorized with Hue and Tone System (Kobayashi, 1981, 1992, 2001), consisting of 40 hues and 12 tones (value-chroma) and based on the ISCC-NBS color naming method and the Munsell color System.. 政 治 大 correspond to the hue, value, and chroma in the Munsell system (Kobayashi, 1981). 立 Three psychological axes including warm-cool, soft-hard, and clear-greyish. ‧ 國. 學. The closer the distance between colors on the scale, the greater the similarity between their images. On the Single Color Image Scale, colors belonging to the. ‧. same tone are arranged in order of hue, whose images vary but have common. n. al. er. io. clear, full of life, and attract attention (Kobayashi, 1992).. sit. y. Nat. characteristics the tone conveys. Take vivid tone for example, it means vivid, bold,. Ch. engchi. 21. i n U. v.
(28) 立. 政 治 大. ‧ 國. 學. Figure 4. Single Color Image Scale (Kobayashi, 1992). ‧. n. er. io. sit. y. Nat. al. Ch. engchi. i n U. v. Figure 5. Key Word Image Scale (Kobayashi, 1992) 22.
(29) Newton‘s ―centre of gravity‖ law of additive color mixing is ―a method to predict the colour of a mixture of lights from the colours of its component lights, using a diagram in which the colours of the spectrum are arranged on the circumference of a circle, and white (the colour of the mixture of all of these kinds of light) lies at the centre. If you consider the points on the colour circle that represent the component spectral lights in the mixture, and assign to each of them a weight proportional to the intensity of light of that kind, then the centre of gravity of the resultant figure will represent the colour of the mixture of lights (Broackes,. 政 治 大 The additive color mixing has been applied to many fields such as painting 立. 1992).―. ‧ 國. 學. restoration (Pei et al., 2004), OLED display (Wu et al., 2006), and colored visual cryptography (Yang and Chen, 2008) for its natures of saturation and de-saturation. ‧. concept, preventing the introduction of unnatural colors, and the capability of. sit. y. Nat. brightness manipulation (Lucchese et al., 2001; Pei et al., 2004).. n. al. er. io. The equation (1) (Lucchese et al., 2001) illustrates the Center of Gravity Law. v. of color mixing, where C2 (x2, y2, Y2) results from the mixture of Cw (xw,yw,Yw) and. Ch. engchi. i n U. Cs (xs, ys, Ys). These coordinates use CIE xyY color space representations, which can be converted from RGB values and then be obtained from the normalization of CIE XYZ system as equation (2) and (3).. 23.
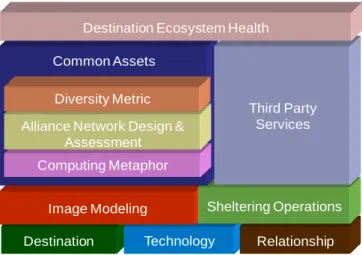
(30) CHAPTER 3 MOTIVATING APPLICATIONS This chapter depicted the whole picture of our research project – ―uVoyage‖. The proposed mechanism in this research, including image model creation, evolvement, and matching, is one of its underlying components.. 3.1 Conceptual Framework of uVoyage Service Platform. The uVoyage conceptual framework is composed of four tiers as shown in Figure 6. The first tier includes (1) a destination which is the target environment where. 政 治 大. SMEs reside; (2) entry level technology embedded in the environment; and (3). 立. relationships among businesses and consumers enables different B2B and B2C. ‧ 國. 學. business models.. To encourage the business development of SMEs, the second tier of the. ‧. conceptual model consists of image modeling and sheltering operations which are. y. Nat. sit. mechanisms for the frontline service provision of the centric platform. As. n. al. er. io. described in Chapter 4, image modeling is an automatic mechanism for gathering. i n U. v. and analyzing the feedback, customer behavior, and other data resources, in order. Ch. engchi. to model the images of destinations, tourists, and businesses. On the other hand, sheltering operations energize marketing and managerial operations and increase the productivity for the businesses.. 24.
(31) Destination Ecosystem Health Common Assets Diversity Metric. Third Party Services. Alliance Network Design & Assessment. Computing Metaphor Sheltering Operations. Image Modeling. Technology. Destination. Relationship. Figure 6. Conceptual framework of uVoyage service platform. 政 治 大. Diversity metric, alliance network design and assessment and computing. 立. metaphor are the common assets of uVoyage conceptual framework in the left side. ‧ 國. 學. of the third tier. These common assets aim to create incentives for business cooperation, including partner recommendation and selection for business. ‧. cooperation to achieve given goals, evaluate possible alliance value network. y. Nat. n. al. Ch. er. io. measure the service diversities of the ecosystem.. sit. formation and compute the selected alliance value network‘s feasibility, and. i n U. v. Third party service providers, such as transportation or other independent. engchi. software vendors, act as auxiliary enablers built on top of the common assets in order to supply their services for value network operation. On the top of the conceptual model, the destination ecosystem health measures the growth and diversity of service development through the prosperity of business and their cooperation. The unique properties of the uVoyage conceptual framework are protective, proactive and prosperous: . Proactive implies that businesses can keep being alert to the changes of the environment and the customers based on the image modeled. After the changes are discovered, the common assets of the technology can then 25.
(32) facilitate businesses to create niches and complementary partners for growth. . Prosperity shows the outcome of value co-creation in an ecosystem. Our framework aims to encourage businesses proposing better value propositions in terms of different value networks. Therefore, the ecosystem which contains many value networks would also receive benefits from business development.. . Productiveness highlights the features of industrial cooperation for customers to enhance overall productivity of a regional industry.. 立. The implementation. 政 治 大 of first two tiers which discover. and understand. ‧ 國. 學. customers‘ needs and business relationships in the environment on the basis of the destination image theory is to assist the value creation process in the tourism. ‧. ecosystem.. y. Nat. n. er. io. al. sit. 3.2 uVoyage System Architecture. v. There are mainly six modules uVoyage as shown in Figure 7. The modules of. Ch. engchi. i n U. image modeling and image mixing are related to the first two tiers of the uVoyage conceptual framework which are responsible for sensing the dynamics environment and customers according to their image models. The sheltering service management module is designed for realizing the sheltering operations for SMEs mentioned in the technology. The other two modules named SME alliance service formation and alliance feasibility management module aim for assisting business cooperation and value sharing. The keystone strategy can be achieved through the six modules through facilitating business value creation to value sharing in the ecosystem. 26.
(33) Environment Data. Tourist Preference Input. SMEs Data. Image Modeling. Image Mixing. Sheltering Service Management. 立. 政 治 大. uVoyage B2C / B2B Service Modules. uVoyage Service Design. 學. uVoyage Service Experiences. ‧ 國. Alliance Feasibility Measurement. SME Alliance Service Formation. Destination Service Matching. Figure 7. uVoyage Service System Platform Architecture. ‧. sit. y. Nat. Both tourists and regional tourism SMEs are the target users in uVoyage, that. io. er. is, tourists search for desired services through evaluating their images, whereas. al. SMEs cooperate to achieve the specific images. Tourist preferences and the. n. v i n Ch personality, SME related data, and environment data e n g c h i U are used as the primary input for the image modeling module that constructs images for destinations, businesses and tourists. SMEs within the region can search cooperation and combine their services to meet tourists‘ changing needs or create new services facilitated by the alliance service formation modules. When cooperative intention occurs, images from collaborated services with different SMEs or destinations will be calculated by the image mixing module. Meanwhile, every cooperation suggestion resulted from the alliance service formation module will be evaluated by the alliance feasibility 27.
(34) measurement module for assessing the possibility of cooperation success. Afterward, the destination service matching module recommends services to tourists by matching images of tourists (aggregated with their emotional needs) and SMEs‘ services. With the sheltering service management module fulfills related electronic cooperation management and marketing functions, tourism SMEs can deliver their services more effectively. In the end, both tourists‘ and SMEs‘ service experiences as feedbacks will affect both environment data (i.e., discussion on web or blog) and all involved role images.. 立. 政 治 大. ‧. ‧ 國. 學. n. er. io. sit. y. Nat. al. Ch. engchi. 28. i n U. v.
(35) CHAPTER. 4. COLOR. IMAGERY. FOR. DESTINATION. RECOMMENDATION 4.1 The Conceptual Framework. The underlying conceptual framework (i.e., the main ideas) of our method is shown in Figure 8 prescribing the interrelationships (arrow (1)~(4)) of the basic concepts (tourist emotional needs, destination images, image modeling, image mixing and destination alternatives). In Figure 8, we assume tourist images and destination images are the targets. 政 治 大. to be processed to attain the matching, that is, pairs of tourist images and. 立. destination images being the outputs of the recommendation process.. ‧. ‧ 國. 學 sit. y. Nat. n. al. er. io. Figure 8. Conceptual framework of the destination recommendation system. Ch. engchi. i n U. v. Tourist Emotional Needs: People often do traveling to fulfill their emotional needs. In the planning stage of the journey, they have some motives for the destinations and SMEs (i.e. local stores, like restaurants or hostels) before reviewing existing tourism products and services. For example, in the hot summer, people may want their vacations are hold at a cool and refreshing mountain; a couple just married might want to spend their honeymoon at a paradisiacal island with a sweet and romantic hotel room. Destination Images: It includes not only images of attractions but also those of SMEs. As mentioned in Chapter 1 and 2, an image can deliver perceptions, 29.
(36) feelings, or experiences that customers may have while visiting a destination and a SME. Images can then assist customers to decide a destination through the comparison and analysis between the images and the expectations. Although everyone may have different versions of impressions of a destination or a SME, it is believed that there are common impressions of a destination that can be accepted by the public, such as sunny California, romantic Paris, diligent Asia, and natural wild Africa. Hence, we view images as attributes of a destination and of a SME in our system.. 政 治 大 destination images, customer emotional needs or motives are regarded as demands 立. Arrow (1) and (2): For the matching between tourist emotional needs and. ‧ 國. 學. and destinations are the candidates for these demands. Image as a medium is capable to express both emotional needs and destinations. In order to find the. ‧. matching image pairs, the images at both sides are represented with the same. sit. y. Nat. format for simple comparison computation. Eventually, each entity in the system. n. al. er. io. will carry its own image in a specific format, and the image can be obtained from. v. varied data resources which need further analysis with massive computing at the. Ch. engchi. system backend before the matching process.. i n U. Image Modeling: To make images, a uniform representation of customer emotional needs, destinations, and SMEs, which can enhance the efficiency of the recommendation process, is required and the Image Modeling component could be particularly designed to represent and measure the images in a systematic way. For representing an image, we propose a representation based on Echtner & Ritchie‘s definition. In our research, an image is composed of only psychological characteristics (e.g. pretty, casual, or mysterious) in contrast with those functional characteristics (e.g. prices, locations, or activities) that can be processed simply by 30.
(37) condition filters (Echtner and Ritchie, 2003; Mackay and Fesenmaier, 1997). The timing for the usage of these functional filters can be after the recommendation (i.e., provided as an optional service executed by customers themselves). The psychological characteristics are referred as ‖image attributes‖ or ―image elements‖ to avoid the confusion between the word ―images‖ as mentioned in previous discussion which indicate the holistic perspective. Given the ingredients of an image are psychological words, we can map these psychological words onto colors separately (e.g., red for dazzling, yellow for bright) according to color. 政 治 大 can then be composed of either psychological words or single colors as the 立. emotion researches and color psychology studies (e.g., Ou et al., 2004). An image. ‧ 國. 學. uniform representation used in our system.. Another issue here is to model the image through analysis of data from. ‧. various sources, which is also a process of searching for appropriate psychological. sit. y. Nat. words which are going to be fit into an image. There are three kinds of images. n. al. er. io. corresponding to each role in the system. For comprehensiveness, all of the actors‘. v. opinions, behaviors and transactions could be tracked and analyzed over time to. Ch. engchi. i n U. extract the required image attributes. This is where the massive computing required at the system‘s backend (that leads to the creation or updating of the image models vital to our system). In this research, we used transaction data for the analysis. The advantage of using color notations to represent images is its capacity for reducing the burden of computation at the front stage during matching that involves the characteristics of both physical and psychological. As color science is a mature discipline, scholars have done a lot of efforts to make color computable and adaptive in various uses, i.e. abstract mathematical color models and 31.
(38) inter-convertible color spaces like RGB, Munsell, CIE XYZ, etc. In addition, there are already many applications about semantics in color (Xin et al., 1998), i.e. mapping emotions onto colors in a space, from which we can attain the benefit. In addition, there is no foundational works that are wildly accepted to clarify the distances between two distinct emotions, i.e. no one can really tell how far it is between happy and sad. Therefore, we can use color notations to measure, monitor, manage, and most importantly, to match images. Arrow (3): Destination regions have different scales in reality (e.g. Taiwan is. 政 治 大 be for a big destination which is a union 立. comprised of 25 administrative divisions). There is a need to consider what the image will. of several regional. ‧ 國. 學. destinations. A drink could be a good example—a scene in an extravagant castle will flash into one‘s mind when he is drinking a tea named ―Wedding Imperial‖. ‧. whose image is given by just a few ingredients.. sit. y. Nat. This implied the union of images does not only equal to the sum of them. The. n. al. er. io. alliance of SMEs who collaborate to complement each other for building. v. distinguishing features for attractiveness and uniqueness can be viewed in the same. Ch. engchi. i n U. way. We argue images can be mixed, no matter how different they are. A realistic example is a fashion style called ―sweet punk.‖ Besides, not only the region unions and SMEs alliances, but also interactions between different roles will have their images changed. For instance, a bar people thought it cool, crazy, and alluring, when more and more elders come to be their guests, the style of this bar would then turn to be classic day by day, while it is still charming and a new romantic feeling floating around. For the sake of revealing the facts mentioned above, the image mixture have to be functioned in our system. 32.
(39) Image Mixing: In order to understand what is the extra image a union of interactions may derive, the Center of Gravity Law for Color Mixture (Lucchese and Mitra, 2000; Lucchese et al., 2001) in color science can be adopted. That is, there can be different levels of mixing, from simple compositions to well-mixed, depends on how accurate the results we want. Sometimes, losing some preciseness can gain extra surprises. Arrow (4): Finally, the matching of tourist emotional needs and destination images can then be realized and the recommendation can be accomplished in. 政 治 大. different levels with destination alternatives as system outputs.. 立. 4.2 System Architecture. ‧ 國. 學. In order to fit into the tourism environment featuring individuality, emotional. ‧. dimensions, wide data, and diverse product types (i.e. various services provided. sit. y. Nat. by hotels, restaurants, and entertainment stores), we position our system as a. al. er. io. model-based recommendation system. Since memory-based approach is unable to. v. n. distinguish personal travel experiences relying on ―nearest neighbors‖;. Ch. engchi. i n U. content-based lacks the ability to highlight the emotional dimensions, we engage psychological/emotional features of tourism products through explicitly modeling both destination images expected by users (emotional needs) and images of tourism products (popular mental impressions) as profiles of each stakeholder role. With the uniform representation of images, we can also avoid the costly construction of categories for each kind of tourism product. Additionally, based on the causal relations and interactions between these roles, their image models (profiles) mature over time. This learning mechanism alleviates the wide data 33.
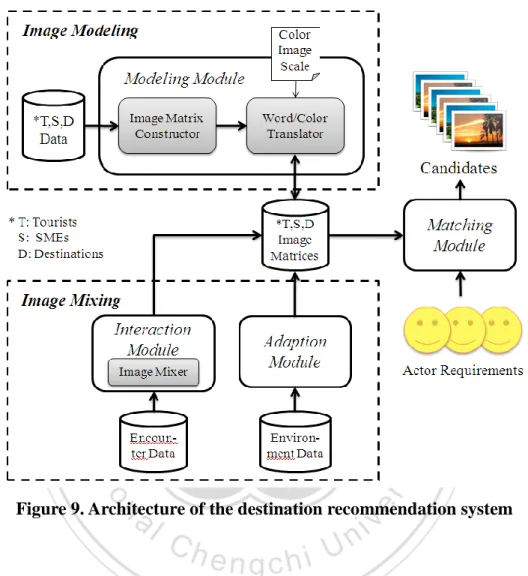
(40) management contributing the recommendation quality. In the end, we gain suggestions through a mapping between the image models belonging to users and tourism products. In this research, there are three assumptions adopted for our destination recommendation system as listed below. . Assumption 1: We do not consider possible combinations of destinations and activities (Ricci, 2002). All the activities recommended are within a previously chosen destination by. 政 治 大 based on other users‘ travel logs. 立. the current user. Tour packages or complete travel plans will be suggested. Assumption 2: Our customers seek deep tours which are able to meet their. ‧ 國. 學. . spiritual/emotional demands. Thus their expectations are narrowed down to. ‧. the individually emotional needs.. Assumption 3: Function-oriented selection can be done with a filtering option. sit. y. Nat. . al. er. io. provided by our system.. v. n. Ricci argued (2002) ―an effective travel recommendation system should not. Ch. engchi. i n U. only notice the user‘s main needs or constraints in a top-down way but also allow the exploration of the option space and support the active construction of user preferences (in a bottom-up way).‖ Thus, we keep the chances to explore destinations for users which may meet their potential demands by leaving the filter function (functional constraints) after the initial query results based on their destination image expectations and preferences derived from log files. The architecture of our destination recommendation system is presented in Figure 9 that is based on the underlying conceptual framework as mentioned in the previous section. That is, Image Modeling corresponds to Modeling Module; 34.
(41) Image Mixing corresponds to both Interaction Module and Adaption Module. The following is the whole picture of the recommendation system with four modules involved.. 立. 政 治 大. ‧. ‧ 國. 學 er. io. sit. y. Nat. al. n. Figure 9. Architecture of the destination recommendation system. Ch. engchi. i n U. v. In the system, all data from tourists, SMEs, and destinations are the materials for the image matrix constructor. Through Modeling Module, we then have the first versions of image matrices consisted of either words or colors. Since this is a dynamic system evolving over time, images will vary with each entity‘s active movements (e.g. tourists‘ images alter as he makes a journey) and inactive movements (e.g. destinations‘ images alter as feedback received). Interaction Module monitors the contacts between stakeholder roles and directly adjusts their images, because every kind of image interactions will 35.
(42) influence with each other. It can be explained by the fact that images of SMEs which resides in a region will collectively decide their belonged destination‘s image. In addition, this influencing process is unceasing and the images are updated upon the interactions over time. Adaptive Module detects occasional events that happen in the real world and bring impacts to a region. For example, people would like to visit and do business at the site where a popular movie was shot, and this makes destination image change.. 政 治 大 from their inputs made in a searching box every time when they want a tour. After 立. The last one, Matching Module, receives tourists‘ emotional needs converted. ‧ 國. 學. these instant emotional needs are added into the original tourists‘ images, Matching Module will find the opposite destinations and SMEs to realize the. ‧. recommendation. The following subsection will then detail the design and. sit. n. al. er. io. 4.3 Modeling Module. y. Nat. operation of the four modules.. Ch. engchi. i n U. v. This module is designed for modeling 3 kinds of images as profiles for each stakeholder, including tourists, destinations, and SMEs (service providers). Every image. model. is. composed. of. psychological. characteristic. attributes.. Corresponding to the concepts introduced in the previous section, the origin and the purpose of the three image model types are described below: . Tourist Image model: It reflects a tourist‘s self-image representing his/her personality and preference derived from a machine-learning process. When a tourist inputs an imagery-based query (considered as a short-term image representing the tourist instant emotional needs translated from a query when 36.
(43) planning a trip), the query would be used as a filter to build a candidate list from the database, followed by the list being sorted based on the tourist‘s long-term image model for personalization. . Destination Image model: It reflects the real-time mental vision or the impression of a destination from the population including tourists and resident SMEs.. . SME Image model: It reflects the real-time mental vision or the impression of a SME from the population. Meanwhile, SME owners can utilize it as an. 政 治 大 as a marketing / positioning tool by partially modifying their images. 立. examination tool to diagnose their operation strategies and processes, and also. ‧ 國. 學. Image matrix constructor and word/color translator form this module whose. ‧. input is the data from tourists, SMEs, and destinations and output is the. sit. y. Nat. corresponding image matrices for each role. The ways about how the data could. n. al. er. io. be retrieved from data sources and converted into each kind of images are then described as follows: . Ch. engchi. Data Sources for building Tourist Image. i n U. v. (1) Classification: We assume tourists are categorized into three tourist types—Independent Mass Tourist, Explorer, and Drifter (Lepp and Gibson, 2003). Images of each type are predefined based on their characteristics correspondingly and a tourist‘s classification can be attained from a simple questionnaire. (2) Learning from Tourist Behavior: As the initial images for every tourist are established, they can start to grow based on four main tracks of tourists‘ behavior. First, those on our recommendation system platform e.g. searching and browsing history. Second, information about the journeys they attended, including 37.
(44) destinations and stores they chose, and the time they spent on each site respectively. Third, feedback they gave, e.g. emotional words which convey their impressions about some places can stand for tourists‘ preference; and service index scores they gave can show their emphases. Forth, expecting destination images that we gain from tourists‘ inputs every time when they are planning a trip. This one is distinct from others because it has the immediacy. In the beginning of the matching process, we will prepare an additional short term image for a tourist, which stands for his/her instant emotional need to a destination or a trip, while the. 政 治 大 Data Sources for building SMEs Image 立. existing image is long term and has been growing. . ‧ 國. 學. (1) Initialization: SMEs managers establish their own images by giving emotional words (e.g., owners can edit their profile anytime when their services alter). If the. ‧. object is an alliance of SMEs, its image will be constructed by Interaction Module. sit. y. Nat. through mixing members‘ images.. al. er. io. (2) Rolling: 40% (this weight varies with regions) of an image will be decided by. v. n. their tourists‘ feedback. Besides, the image of the destination where they reside. Ch. engchi. i n U. will also influence their own images (Interaction Module‘s responsibility). . Data Sources for building Destination Image. (1) It is constructed by the emotional words given by SMEs and tourists, and changed dynamically over time. The image of a bigger region is composed of its sub region images. Similarly, it will be influenced by images of SMEs and their customers (Interaction Module‘s responsibility).. As mentioned in the conceptual framework section, the representation of images is composed of psychological words (i.e., a representation of image attributes). 38.
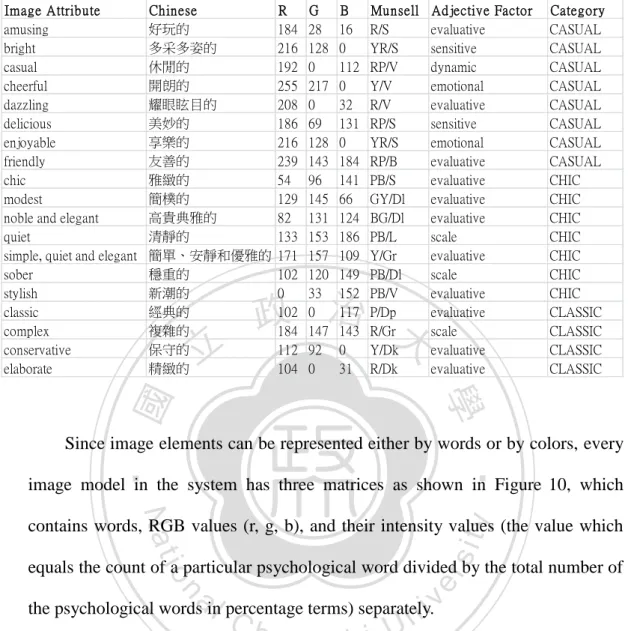
(45) These words come from Color Image Scale (Kobayashi, 1992) and all of them are adjectives. With Color Image Scale, converting the feelings about products, services, and experiences into mathematical notations becomes easier, because on the Internet, they are usually accompanied with text information which can be analyzed with text mining techniques. Table 2 presents part of image attributes taken to construct an image model within our system. In total, we choose 122 image attributes from Color Image Scale, and they can be categorized into 14 groups (casual, chic, classic, clear,. 政 治 大 and romantic) according to their meanings. The original Color Image Scale has 立. cool-casual, dandy, dynamic, elegant, formal, gorgeous, modern, natural, pretty,. ‧ 國. 學. 130 colors and 180 emotional words. However, their positions on the scale are not exactly and directly mapped, and some of colors are too close to be distinguished,. ‧. so only 122 relations among them could be clearly identified and used in our. sit. y. Nat. research.. n. al. er. io. Each image attribute in our system is represented by a psychological word. v. and has several properties: color notations, including Munsell and RGB value, and. Ch. engchi. i n U. adjective factor (evaluative, sensitive, dynamic, emotional, scale (Kobayashi, 1981)), which will be used in the image matching and mixing process. Because our raw data for building image models are gathered either by text mining from Internet or through open questions from tourists and SMEs, we will use DISCO, a JAVA tool (http://www.linguatools.de/disco/disco_en.html), to retrieve the semantic similarity between external words and psychological words in Color Image Scale. In consequence, all the external text contents could be translated into words within the boundary of our modified Color Image Scale.. 39.
(46) Table 2. Exemplars of Image Attributes/Elements in Modified Color Image Scale Chinese 好玩的 多采多姿的 休閒的 開朗的 耀眼眩目的 美妙的 享樂的 友善的 雅緻的 簡樸的 高貴典雅的 清靜的 簡單、安靜和優雅的 穩重的 新潮的 經典的 複雜的 保守的 精緻的. 立. R 184 216 192 255 208 186 216 239 54 129 82 133 171 102 0 102 184 112 104. G 28 128 0 217 0 69 128 143 96 145 131 153 157 120 33 0 147 92 0. B 16 0 112 0 32 131 0 184 141 66 124 186 109 149 152 117 143 0 31. Munsell R/S YR/S RP/V Y/V R/V RP/S YR/S RP/B PB/S GY/Dl BG/Dl PB/L Y/Gr PB/Dl PB/V P/Dp R/Gr Y/Dk R/Dk. 政 治 大. Adjective Factor evaluative sensitive dynamic emotional evaluative sensitive emotional evaluative evaluative evaluative evaluative scale evaluative scale evaluative evaluative scale evaluative evaluative. Category CASUAL CASUAL CASUAL CASUAL CASUAL CASUAL CASUAL CASUAL CHIC CHIC CHIC CHIC CHIC CHIC CHIC CLASSIC CLASSIC CLASSIC CLASSIC. 學. ‧ 國. Image Attribute amusing bright casual cheerful dazzling delicious enjoyable friendly chic modest noble and elegant quiet simple, quiet and elegant sober stylish classic complex conservative elaborate. Since image elements can be represented either by words or by colors, every. ‧. image model in the system has three matrices as shown in Figure 10, which. y. Nat. sit. contains words, RGB values (r, g, b), and their intensity values (the value which. n. al. er. io. equals the count of a particular psychological word divided by the total number of. i n U. the psychological words in percentage terms) separately.. Ch. engchi. v. After the image matrix in the word format is constructed and accompanied with intensity values, the word/color translator will map those words onto colors (Figure 11) according to our version of the Color Image Scale that we have adopted and slightly modified based on Nippon Color & Design Research Institute Inc. (NCD)‘s research (Kobayashi, 1992, 2001). In our version, for simplicity the relation of word and color is many to one (it is many to many in the original version), that is, every image attribute has its own meaning, and it can be presented either by multiple words or one single color.. 40.
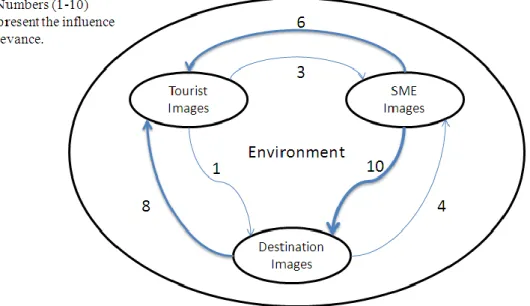
(47) Figure 10. Image Matrices in three formats. 立. 政 治 大. ‧. ‧ 國. 學 y. Nat. Figure 11. Concept of mapping emotional words onto colors (Kobayashi, 1992,. n. er. io. al. 4.4 Interaction Module. sit. 2001). Ch. engchi. i n U. v. Since each kind of stakeholder role‘s image has influences on others to a certain extent, Figure 12 depicts this mutually influencing concept considered in our recommendation system. Those numbers in the chart stand for the relative strength of the influences between the images of roles (bold lines are those above six). When interaction contacts occur, the images of the involving entities would slightly change in accord with the influences from the other‘s images. For example, a man with red image visit a place with yellow image, the man‘s image will turn to more orange, because this fact reveals the man‘s preference in an 41.
數據

+7

相關文件
You are given the wavelength and total energy of a light pulse and asked to find the number of photons it
好了既然 Z[x] 中的 ideal 不一定是 principle ideal 那麼我們就不能學 Proposition 7.2.11 的方法得到 Z[x] 中的 irreducible element 就是 prime element 了..
volume suppressed mass: (TeV) 2 /M P ∼ 10 −4 eV → mm range can be experimentally tested for any number of extra dimensions - Light U(1) gauge bosons: no derivative couplings. =>
Asymptotic Series and Borel Transforms Revisited Alien Calculus and the Stokes Automorphism Trans–Series and the Bridge Equations Stokes Constants and Asymptotics.. 4 The Airy
For pedagogical purposes, let us start consideration from a simple one-dimensional (1D) system, where electrons are confined to a chain parallel to the x axis. As it is well known
The observed small neutrino masses strongly suggest the presence of super heavy Majorana neutrinos N. Out-of-thermal equilibrium processes may be easily realized around the
The temperature angular power spectrum of the primary CMB from Planck, showing a precise measurement of seven acoustic peaks, that are well fit by a simple six-parameter
incapable to extract any quantities from QCD, nor to tackle the most interesting physics, namely, the spontaneously chiral symmetry breaking and the color confinement..
