國 立 交 通 大 學
機 械 工 程 學 系
博士論文
一氧化碳毒化對質子交換膜燃料電池性能
影響之分析
Analysis of CO Poisoning Effect on the Performance of
Proton Exchange Membrane Fuel Cell
研 究 生:王建評
指導教授:陳俊勳 教授
曲新生 教授
一氧化碳毒化對質子交換膜燃料電池性能
影響之分析
Analysis of CO Poisoning Effect on the Performance of
Proton Exchange Membrane Fuel Cell
研 究 生:王建評 Student:Chien-Ping Wang
指導教授:陳俊勳、曲新生 Advisor:Chiun-Hsun Chen
Hsin-Sen Chu
國 立 交 通 大 學
機 械 工 程 學 系
博 士 論 文
A ThesisSubmitted to Department of Mechanical Engineering National Chiao Tung University
in partial Fulfillment of the Requirements for the Degree of
Doctor of Philosophy in
Mechanical Engineering
June 2007
Hsinchu, Taiwan, Republic of China
一氧化碳毒化對質子交換膜燃料電池性能影響之分析
研究生:王建評
指導教授:陳俊勳、曲新生
摘要
近年來由於化石燃料的短缺及有限的蘊藏量,加上傳統應用化石燃
料發電方式所產生大量的溫室氣體,造成石油價格攀升及地球暖化等
重大議題。因此再生能源及潔淨能源科技的發展成為本世紀最重要的
研究課題之一。燃料電池因具有潔淨、高效率及模組化特性,使得燃
料電池此一新興能源科技的發展倍受重視。未來質子交換膜燃料電池
之重點研究方向有二,一為性能提昇及價格下降,另一為如何提高其
可靠度及耐久性
。質子交換膜燃料電池的操作性能與使用期限,與輸入燃氣中所含
的不純物質(如陽離子、一氧化碳) 有密切的影響。重組器中所含的一
氧化碳由於比氫氣具有與白金更強的鍵結能力,而附著於白金表面造
成觸媒參與電化學反應的有效面積降低,即使微量的一氧化碳亦是造
成燃料電池性能下降及縮短使用期限的重要因素。因此,本研究主要
目的即在建立一套完整的理論模式。探討一氧化碳影響電池性能的主
要機制,以及受到一氧化碳毒化後白金觸媒表面受到氫氣與一氧化碳
的覆蓋情形與電池內部包含氣體、液體的傳輸現象,研究提升電池抵
抗一氧化碳毒化的能力。
首先本文發展出一維暫態的
CO 毒化理論模式,探討 CO 在陽極觸
媒層中的暫態毒化現象。由理論結果顯示,氫氣在白金表面的覆蓋率
隨著時間而降低,這是由於
CO 佔據白金表面所造成。CO 的濃度愈
高使得氫氣能參與電化學反應的機會愈小,也縮短達到穩態的時間,
亦即縮短燃料電池的使用期限。另外在較低的
CO 濃度下,增加陽極
過電位及增加觸媒的孔隙度明顯增加產生的電流密度。
其次本文推導一維的兩相流理論模式探討
CO 毒化對 PEM 燃料電池
性能影響之分析。由結果顯示,高濃度的
CO 造成白金有效反應面積
下降。由於電化學反應減緩,陰極觸媒產生的液態水減少使得陽極與
陰極的液態水含量降低。在高
CO 濃度及稀薄的氫氣含量下,由於電
滲透效應降低及陰極反應生成的液態水減少,使得薄膜內的液態水分
佈梯度降低。CO 濃度的改變相較氫氣含量對電池內部液態水的分佈
具有較大的影響。CO 濃度在 10-50 ppm 之間電流密度急劇的降低。
在不同的
CO 濃度下,提高氫氣含量均可增加電池輸出之電流密度,
提高電池抵抗
CO 毒化的能力。
接下來本文推導出一維暫態的兩相流理論模式探討
CO 毒化對 PEM
燃料電池性能影響之暫態分析。結果顯示,高濃度的
CO 造成白金有
效反應面積下降也同時降低達到穩態所需的時間。在不同的
CO 濃度
下增加氫氣的含量可明顯增加達到穩態的時間。CO 濃度在 10 ppm,
操作電壓在 0.6 V 以上,可達到較佳的抗
CO 毒化的能力以維持燃料
電池的操作性能。
本文進一步探討高溫型
PBI 薄膜。由於操作溫度可達 200
oC,因此
水管理及一氧化碳毒化問題可有效解決,並分別由實驗量測及理論分
析同時驗證。由實驗結果得知,操作溫度愈高可得愈佳的電池性能,
因高溫下可提升化學反應速率。輸入
CO 濃度高達 3000 ppm 及 40% H2
下,電池性能僅下降約
26%。在不同的一氧化碳及氫氣濃度下,理論
分析結果與實驗非常符合。由本文的研究結果可準確分析燃料成份比
例對電池性能的影響,以及電池性能隨時間衰退的變化,提供電池或
重組器設計重要參考依據。
Analysis of CO Poisoning Effect on the Performance
of Proton Exchange Membrane Fuel Cell
student:Chien-Ping Wang
Advisor:Chiun-Hsun Chen
Hsin-Sen Chu
ABSTRACT
Recently, the increase of global energy demand will propel a more rapid depletion of world’s fossil fuel reserves and the burning of the fossil fuels for generating electricity will release greenhouse gases into the atmosphere. The requirements for developing the renewable energy and clean energy technology become the most important issue for the human being in this century. Much attention has been devoted to the developments of the fuel cells because they are clean, high efficient and capable of module. There are two major topics of the R&D programs for the PEM fuel cell systems. First, the improvement of the performance and the decrease of the cost, secondly, enhance the reliability and durability of the fuel cells.
Fuel cell performance and life time are strongly influenced by impurities in the fuel gas (cation and CO). Reforming from methanol or gasoline fuels is the most widely used method to generate hydrogen fuel. Even trace amount CO would reduce the hydrogen electro-oxidations effectively by occupying the Pt reacting surface which results in a decrease in the cell performance and life time. To keep a long time and stable operation, how to reduce the CO concentration effectively from the reformer and enhance the tolerance for CO of the fuel cell will become a significant topic. In this work, a comprehensive theoretical model of the poisoning effect of PEM fuel cells by CO is investigated to promote the tolerance for CO and thus elucidate the
transport phenomena inside the cell.
In the first part of this study, a one-dimensional transient mathematical model is applied to simulate the carbon monoxide poisoning effect on the performance of the PEM fuel cell. The transient behavior of CO poisoning process across the anode catalyst layer is investigated. The results show that the hydrogen coverage, θH,
decreases with the time due to the CO adsorption on the catalyst site. A higher CO concentration results in a less available catalyst site for hydrogen electro-oxidation and a more significant decrease in the response time to reach steady state tss.
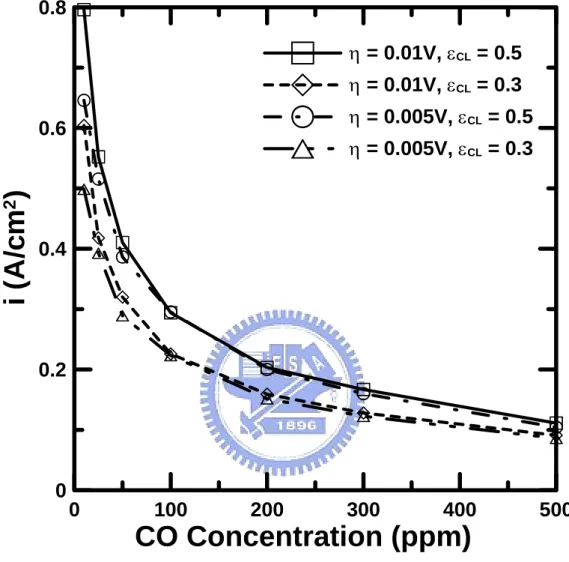
Increasing anode overpotential and gas porosity would result in an increase in the current density, especially at low level of CO concentration.
Second, a one-dimensional, two-phase mathematical model was developed to analyze the CO poisoning effect on the performance of a PEM fuel cell. Both vapor and liquid water transport are examined inside the cell. The theoretical results indicate that a higher CO concentration results in large CO coverage across the anode catalyst layer. The slowing of the chemical reactions at both the anode and the cathode reduce the liquid water saturation level in the catalytic layers. At high CO concentration and dilute hydrogen feed, the effect of the electro-osmotic drag is small and less liquid water is generated at the cathode catalyst layer, causing the liquid water distribution to have a small slop across the membrane. The distribution of liquid water depends more strongly on the CO concentration than on dilution of hydrogen in the MEA of the fuel cell. A large dropping rate of the current density is observed in the range between 10-50 ppm CO. Increasing the amount of pure hydrogen drastically increases the current density for a wide range of CO contents, promoting the tolerance for CO of the fuel cell.
Third, a one-dimensional, two-phase, transient mathematical model was extended to analyze how carbon monoxide poisoning affects the performance of a PEM fuel
cell. The theoretical results indicate that a higher CO concentration results in less hydrogen coverage and a large drop in the time to reach steady state tss. Increasing the
amount of pure hydrogen drastically increases tss for a wide range of CO contents.At
10 ppm CO, a long tss can be achieve using pure hydrogen, especially at high cell
voltage, promoting the tolerance for CO and providing the desired performance of the fuel cell.
Finally, high temperature proton exchange membrane fuel cells have drawn great attentions due to high CO tolerance and overcoming water managements. In this wrok, theoretical and experimental studies were made to analyze the transient CO poisoning process. Experimental results were measured at different temperature and suffered from various CO contents. Higher performance was obtained at elevated temperature due to faster chemical kinetics. Only 26% of performance loss is obtained under 3% CO and 40%H2. The effects of temperature, CO contents and H2 dilutions on the fuel
cell performance and the time to reach steady tss are all investigated. The predictions
of the degradation of fuel cell performance show good agreements with experimental results under various fuel compositions. Thus, the present results can provide comprehensive information for designing fuel cell system and methanol reformer.
誌 謝
首先感謝恩師 曲新生博士,恩師除了在學術上的悉心指導之外,
在待人處世方面更是我學習的典範。其次感謝口試委員翁政義、陳朝
光、林清發、陳發林、顏維謀諸位教授對於論文的建議及指教,使得
本論文更加嚴謹而充實。
此外感謝世國、木勝、時明等學長在學業及生活上的關心與照顧,
幫助我在研究過程中解決許多困難。
最後特別感謝我的家人,在這漫長的求學過程中,不斷地給予我支
持及鼓勵,陪伴我經歷過許多挫折及挑戰,僅以此論文獻給所有關心
及照顧我的人。
TABLE OF CONTENTS
ABSTRACT (IN CHINESE)... i
ABSTRACT (IN ENGLISH)... iii
TABLE OF CONTENTS... vii
LIST OF TABLES ... ix
LIST OF FIGURES ... x
NOMENCLATURE... xiv
1. INTRODUCTION ... 1
1.1 Motivation... 1
1.2 Fuel Cell Types ... 3
1.3 Literature Survey ... 7
1.4 Objectives... 19
2. Transient Behaviors of CO Poisoning in the Anode Catalyst
Layer... 29
2.1 Theoretical Model... 29
2.2 Numerical Method ... 32
2.3 Results and Discussion ... 32
3. Two-Phase Modeling of a PEMFC with CO Poisoning Effect
Using Dilute Hydrogen Feed ... 48
3.2 Numerical Method ... 51
3.3 Results and Discussion ... 51
4. Transient Analysis of Multicomponent Transport with
Carbon Monoxide Poisoning Effect of a PEM Fuel Cell... 67
4.1 Theoretical Model... 67
4.2 Numerical Method ... 70
4.3 Results and Discussion ... 71
5. Transient Evolution of Carbon Monoxide Poisoning Effect
of PBI Membrane Fuel Cells ... 95
5.1 Experiments ... 95
5.2 Theoretical model ... 96
5.3 Results and Discussion ... 99
6. Conclusions and Recommendation...118
LIST OF TABLES
Table 2.1 Values of parameters used in the present study... 36
Table 3.1 Governing equations ... 55
Table 3.2 Boundary Conditions ... 56
Table 3.3 The parameters used in the present model... 57
Table 4.1 Governing equations ... 76
Table 4.2 Boundary Conditions ... 77
Table 4.3 The parameters used in the present model ... 78
Table 5.1 Error analysis of the test station from ITRI... 102
Table 5.2 Governing equations ... 103
Table 5.3 Boundary Conditions ... 104
LIST OF FIGURES
Fig 1.1 Energy demand of the world between1970 to 2030 (IEA)... 21
Fig 1.2 CO2 emissions grow 55% between now to 2030 (IEA) ... 21
Fig 1.3 The hydrogen, fuel cells & infrastructure technologies program... 22
Fig 1.4 A domestic hydrogen energy system ... 22
Fig 1.5 Hydrogen economy timeline ... 23
Fig 1.6 Applications of the PEM fuel cell (ERL/IRTI) ... 24
Fig 1.7 Schematic diagram of a PEM fuel cell ... 25
Fig 1.8 Component diagram of a PEM fuel cell ... 26
Fig 1.9 Structure of the membrane as a function of water content ... 27
Fig 1.10 Schematic diagram of the agglomerate catalyst... 27
Fig 1.11 Methanol fuel processor ... 28
Fig 1.12 A PBI cell stack with an integrated methanol reformer ... 28
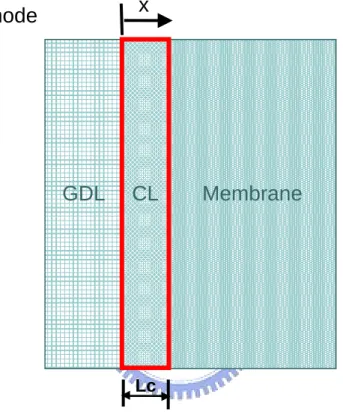
Fig 2.1 Schematic diagram of a PEM fuel cell anode... 37
Fig 2.2 Hydrogen and CO distributions at various time steps across anode catalyst layer for 100 ppm CO, εCL =0.4, η=0.01, and Lc=10μm. ... 38
Fig 2.3 Distributions of θH at various time steps across anode catalyst layer for 100 ppm CO, εCL=0.4, η=0.01, and Lc=10μm... 39
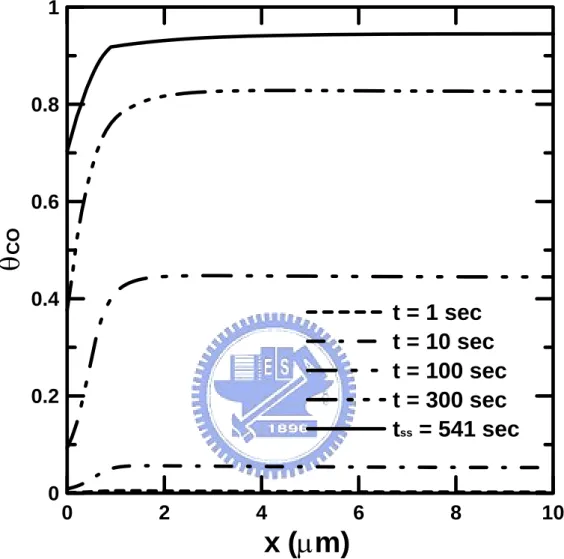
Fig 2.4 Distributions of θCO at various time steps across anode catalyst layer for 100 ppm CO, εCL =0.4, η=0.01, and Lc=10μm... 40
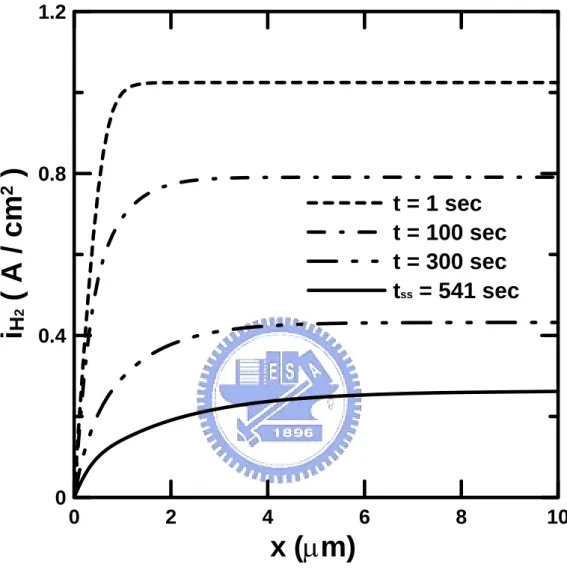
Fig 2.5 Distributions of hydrogen oxidation current at various time steps across anode catalyst layer for 100 ppm CO, εCL =0.4, η=0.01, and Lc=10μm ... 41
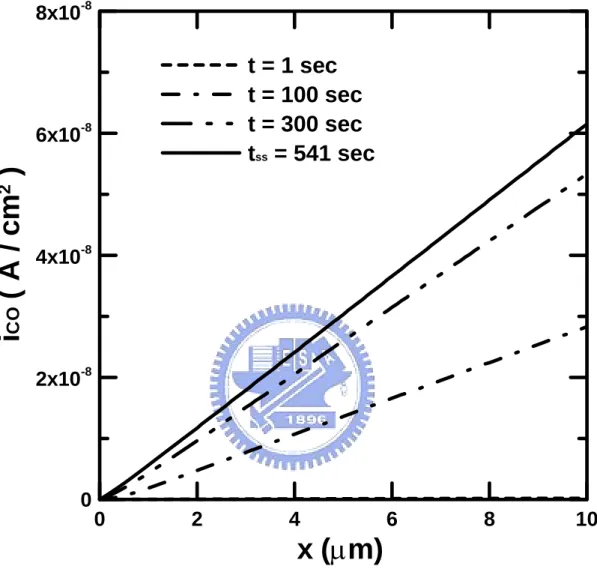
Fig 2.6 Distributions of CO oxidation current at various time steps across anode catalyst layer for 100 ppm CO, εCL =0.4, η=0.01, and Lc=10μm... 42
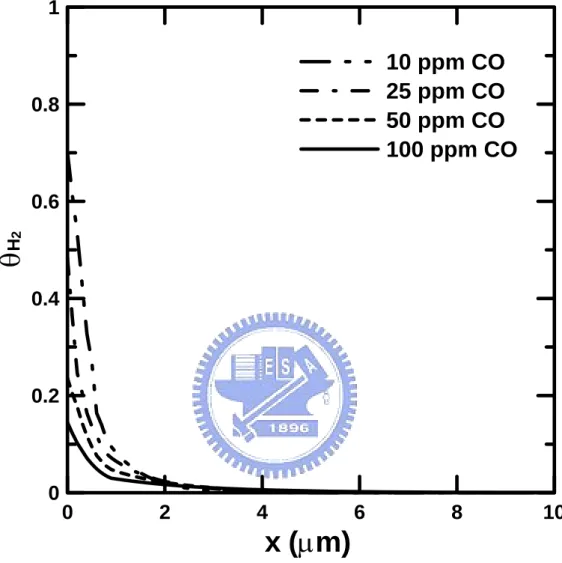
Fig 2.7 Distributions of θH at steady state across anode catalyst layer for different CO concentration with εCL =0.4, η=0.01, and Lc=10μm ... 43
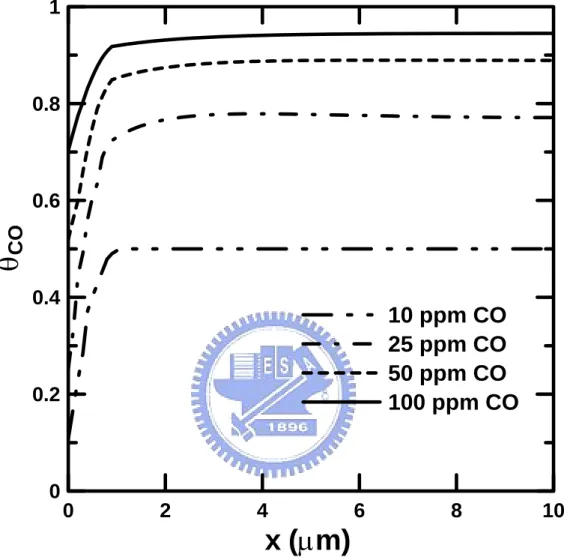
Fig 2.8 Distributions of θCO at steady state across anode catalyst layer for different
CO concentration with εCL =0.4, η=0.01, and Lc=10μm... 44
Fig 2.9 Distributions of current density at steady state across anode catalyst layer for different CO concentration with εCL =0.4, η=0.01, and Lc=10μm ... 45
Fig 2.10 Effects of the ppm CO concentration on the response time interval for
different anode overpotential η and gas porosity εCL with Lc=10μm... 46
Fig 2.11 Fig. 2.11 Effects of the ppm CO concentration on the current density for different anode overpotential η and gas porosity εCL with Lc=10μm... 47
Fig 3.1 A schematic model of MEA of the PEM fuel cell ... 58 Fig 3.2 The effect of various CO concentrations and hydrogen dilutions on the
distribution of hydrogen coverage across the anode catalyst layer at 0.6 V. 59 Fig 3.3 The effect of various CO concentrations and hydrogen dilutions on the
distribution of CO coverage across the anode catalyst layer at 0.6 V ... 60 Fig 3.4 The effect of various CO concentrations and hydrogen dilutions on the
distribution of liquid water saturation across the anode catalyst layer
at 0.6 V... 61 Fig 3.5 The effect of various CO concentrations and hydrogen dilutions on the
distribution of water content across the membrane at 0.6 V... 62 Fig 3.6 The effect of various CO concentrations and hydrogen dilutions on the
distribution of liquid water saturation across the cathode catalyst layer at 0.6 V... 63 Fig 3.7 The effect of various CO concentrations and hydrogen dilutions on the
distribution of ionic potential across the MEA at 0.6 V... 64 Fig 3.8 The present simulation results compare with experimental data at 0.6 V ... 65 Fig. 3.9 The effect of various hydrogen dilutions and CO contents on the
performance of the fuel cell ... 66 Fig 4.1 A schematic model of the MEA of the PEM fuel cell ... 79 Fig 4.2 The transient evolution of the hydrogen coverage profile across the anode
Fig 4.3 The transient evolution of the CO coverage profile across the anode catalyst layer, with 100 % H2, 10 ppm CO, 0.6 V... 81 Fig 4.4 The transient evolution of the liquid water saturation profile across the
anode catalyst layer, with 100 % H2, 10 ppm CO, 0.6 V... 82 Fig 4.5 The transient evolution of the water content profile across the membrane,
with 100 % H2, 10 ppm CO, 0.6 V ... 83 Fig 4.6 The transient evolution of the liquid water saturation profile across the
cathode catalyst layer, with 100 % H2, 10 ppm CO, 0.6 V ... 84 Fig 4.7 The transient evolution of the ionic potential profile across the MEA, with
100 % H2, 10 ppm CO, 0.6 V ... 85 Fig 4.8 The steady state hydrogen coverage profile across the anode catalyst layer at
various CO concentrations and hydrogen dilutions at 0.6 V... 86 Fig 4.9 The steady state CO coverage profile across the anode catalyst layer at
various CO concentrations and hydrogen dilutions at 0.6 V... 87 Fig 4.10 The steady state liquid water saturation profile across the anode catalyst layer
at various CO concentrations and hydrogen dilutions at 0.6 V ... 88 Fig 4.11 The steady state water content profile across the membrane at various CO
concentrations and hydrogen dilutions at 0.6 V... 89 Fig 4.12 The steady state liquid water saturation profile across the cathode catalyst
layer at various CO concentrations and hydrogen dilutions at 0.6 V ... 90 Fig 4.13 The steady state ionic potential profile across the MEA at various CO
concentrations and hydrogen dilutions at 0.6 V... 91 Fig 4.14 The present simulation results compare with experimental data at 0.6 V ... 92 Fig 4.15 The influence of CO concentration on the time to reach steady state for two
hydrogen dilutions and cell voltages... 93 Fig 4.16 The effect of cell voltage on the time to reach steady state for two hydrogen
dilutions and CO concentrations... 94 Fig 5.1 Component diagram of a single cell ... 106 Fig 5.2 Schematic of the experimental setup ... 107
Fig 5.3 Transient evolution of hydrogen coverage profiles across anode catalyst layer with 1% CO, 55% H2...108
Fig 5.4 Transient evolution of CO coverage profiles across anode catalyst layer with 1% CO, 55% H2...109
Fig 5.5 The distributions of ionic potential loss with time across MEA with 1% CO, 55% H2...110
Fig 5.6 Hydrogen coverage profiles across anode catalyst layer under various
hydrogen contents with 1% CO ...111 Fig 5.7 CO coverage profiles across anode catalyst layer under various hydrogen
contents with 1% CO ...112 Fig 5.8 Effects of CO contents on the time to reach steady state under various
hydrogen dilutions ...113 Fig 5.9 Effects of CO contents on the current density under various hydrogen
concentrations ...114 Fig 5.10 Percentage of power density loss under various CO and hydrogen contents 115 Fig 5.11 Experimental measurements of polarization curves of the PBI membrane fuel
cell at temperature 120, 140, 160 and 180oC ... 116 Fig 5.12 The comparisons of simulation results with experimental data at 0.6 V... 117
NOMENCLATURE
a contact area of Pt catalyst (cm2 cm-3)
bfH ratio of forward to backward of hydrogen adsorption (atm)
bfCO ratio of forward to backward of CO adsorption (atm)
C concentration of reactant gas (mole cm-3)
D diffusion coefficient (cm2 s-1)
i current density (A cm-2)
k conductivity of the Nafion phase
K permeability, cm2
keH hydrogen electro-oxidation rate constant (A cm-2)
keCO CO electro-oxidation rate constant (A cm-2)
kfH hydrogen adsorption rate constant (A cm-2 atm-1)
kfCO CO adsorption rate constant (A cm-2 atm-1)
M molecular weight, g mol-1
n number of electrons
P total pressure (atm)
R universal gas constant (J mol-1 K-1)
s liquid water saturation
T temperature (K)
t time (s)
X molar fraction
Greek
ε porosity
θ coverage ratio on Pt catalyst site
ξ molar area density of Pt catalyst sites (C cm-2)
φ ionic potential (V)
μ viscosity, (g cm-1 s-1)
ρ density, (gcm-3)
η overpotential
γ stoichiometric coefficient σ rate constant of Henry’s law
ΔEH activation energy change for hydrogen dissociative adsorption near CO
occupied sites (J mol-1)
ΔGf variation of free energy of CO adsorption between zero and full coverage
(J mol-1)
Superscripts
in inlet at catalyst layer sat saturation
Subscripts
CL catalyst layer CO carbon monoxide 2 H hydrogen MEM membrane 2 O oxygenss steady state
wg water vapor
1. INTRODUCTION
1.1 Motivation
From the world energy outlook of IEA 2006, the global energy demand grows nearly 60% since 2002 to 2030. From Fig 1.1, fossil fuels are the most important resources which account for almost 90% of the energy growth. Due to the increased of global energy demand will propel a more rapid depletion of world’s fossil fuel reserves. In the divinable future, this will not only increase the oil price but also release a great deal of greenhouse gases into the atmosphere. From Fig 1.2, the prediction of global CO2 emission by fuel grows nearly 55% between 2004 and 2030.
Base on the information the developments of renewable and clean energy technologies become one of the most important issue in this century.
The hydrogen, fuel cells and infrastructure technologies program is shown in Figure 1.3 [EERE/DOE, 2006]. There are four strategic goals of EERE for integrating R&D activities such as hydrogen production, delivery, storage and applications. Figure 1.4 shows a diverse set of resources to produce hydrogen. Biomass, geothermal, hydro, wind, and fossil fuel are able to produce hydrogen. Through use of fuel cells in distributed generation and transportation perform high efficiency and low emissions. The hydrogen economy timeline as shown in Figure 1.5 is predicted by DOE. There are four transition phases to a hydrogen economy. The transition will require strong public and private partnerships, and this transition will take several decades.
Fuel cells are highly efficient energy conversion devices that can replace combustion engine technology. Combining hydrogen and oxygen, fuel cells generate electrical power and produce pure water through electrochemical reactions. Fuel cells
are quiet, efficient and convert energy electrochemically rather than mechanically. In recent years, the proton exchange membrane fuel cell is highly attractive for both portable and stationary application due to its high operating efficiency and environmental friendliness. This gives the PEM fuel cells great flexibility of a wide range of applications, Fig 1.6.
The most efficient fuel for use in a PEM fuel cell is pure hydrogen. However, this is difficult to store and has a high cost of production. Reforming from hydrocarbons, including gasoline and alcohol is the most extensively used technique for generating hydrogen fuel for use in proton exchange membrane fuel cells, which contain 45% hydrogen, 10ppm CO, 15% CO2 and 1% CH4 [1]. CO at a concentration even as low
as 5-10 ppm effectively blocks Pt reaction sites for the electro-oxidation of hydrogen [2-3]. The affinity between CO and Pt is such that even at this low concentration of CO, the consequent loss of performance is severe [4, 5]. For the reforming process to be effective in the fuel cell system, this problem must be solved.
Recently, high temperature phosphoric acid doped membrane fuel cells have been developed to overcome water management and CO tolerance. PBI is a basic polymer and exhibits high conductivity through doping with various acids or bases. Sulphuric acid and phosphoric acid are used to perform high membrane conductivity. The operating temperature is around 120~180oC of acid-doped PBI membrane fuel cell which is much higher than PFSA polymer membrane fuel cells. Water inside fuel cell becomes vapor phase and exhibit high tolerance of CO. Chemical kinetics also become faster at elevated temperature. Protons conduct in solid matrix for PBI membrane, so the membrane conductivity is less influence by liquid water content. In addition, a higher mechanical strength and a lower permeability of PBI membrane provides an alternative choice to replace Nafion. Fuel not only can be fed directly into
the fuel cell but also can be made into a compact design with methanol reformer.
Here we investigate the effects of CO poisoning and hydrogen dilution on the performance of fuel cells. The theoretical model that combines transport equations of reactants, water and CO poisoning is developed. Transient behavior is also one of the most important issues that we investigated in this work. Our purpose is to gain a fundamental understanding of the CO poisoning process, including coverage profiles, reactants, vapor and liquid water transport. High temperature PBI membrane fuel cell is also investigated in our theoretical and experimental studies. These results can further realize CO poisoning process inside fuel cell. Fuel cell performance under various fuel compositions can be accurately predicted from our simulation and realize the transient degradations of the fuel cell performance. Thus, this can provide sufficient information for the designing reformer and the fuel cell system.
1.2 Fuel Cell Types
Proton Exchange Membrane Fuel Cell (PEMFC)
In 1960s, the first proton exchange membrane fuel cell was developed by General Electric in the United States [6]. The first space vehicle was used by NASA. Figure 1.7 shows the schematic diagram of the PEM fuel cell. The electrolyte is an ion conduction polymer to move H+ ion through the supporting ionomer structure. The PEM fuel cells work at low temperature which can start quickly. The thinness of the MEA makes the compact design and without corrosive fluid in the cell. This makes that the PEMFC is suitable for portable and stationary applications. Fig 1.8 shows the component diagram of a PEM fuel cell. At the anode side, the hydrogen oxidation
reaction releasing H+ ions and electrons − + + → H e H 4 4 2 2 (1-1)
At the cathode, the oxygen reduction reaction reacts with H+ ions and electrons to produce water O H H e O2 +4 −+4 + →2 2 (1-2)
Only water is produced by the above electro-chemical reactions. This results in an environmental friendliness to replace the internal combustion engine.
Alkaline Electrolyte Fuel Cells
The first application of the alkaline fuel cell was adopted by F.T. Bacon at Cambridge that took human to the moon in Apollo mission [6]. The electrolyte of the AFC is an alkaline solution. Potassium hydroxide or sodium hydroxide solution is the prime use as the electrolyte. The basic chemistry at the anode is
2H2 +4OH− →4H2O+4e− (1-3)
The electrons pass around the external circuit. At the cathode, new OH- ions is formed
−
−+ →
+ e H O OH
O2 4 2 2 4 (1-4)
The main advantages of the AFC are the low activation overvoltage loss at the cathode and the low system cost. In the low temperature fuel cells, activation loss is the most important voltage loss, but the reason is not well understood. The very low cost of the electrolyte (potassium hydroxide) and not usually have bipolar plate reducing the cost the alkaline fuel cells. The main disadvantage of the AFC is the CO2
react with the KOH. The reduction of the OH- concentration will greatly drop the cell performance.
In the DMFC, methanol is used as a fuel instead of hydrogen which is effectively produced from hydrocarbon fuels. Methanol fuel works in both the alkaline and PEM electrolytes. The reactions at the anode and cathode depend on the electrolyte used. The use of alkaline electrolyte has a major problem which results in carbonate formation. Current research and development of DMFC is focused on PEM electrolyte.
There are two major problems associated with DMFC. First, the fuel anode reactions proceed much slowly than with hydrogen. Because of methanol reaction is a more complex reaction. This results a far lower power for a given size. Second, the fuel crossover significantly affects the performance of the fuel cells which is particularly acute with PEM electrolyte. Because of methanol mixes well with water and then reaches the air cathode.
Phosphoric Acid Fuel Cell
The PAFC use a phosphoric acid (H3PO4) as an electrolyte to conduct proton which
like Nafion membrane in the PEM fuel cells. Phosphoric acid is the inorganic acid that has high thermal, chemical, and electrochemical stability. It’s also contained high volatility (above 150oC) to be adopted as an electrolyte for fuel cells. Due to its low freezing point (42 oC) of the pure phosphoric acid, PAFC is usually maintained above such temperature. Unlike PEMFC, the operating temperature of the PAFC is normally around 180 to 200 oC that has greater tolerance of CO (up to 1%). After long time operation, it is necessary to replenish electrolyte. This is because that the vapor pressure is low and some acid is lost during operation.
.
electrolyte of the MCFC is usually a binary molten mixture of lithium and potassium, or lithium and sodium carbonates. A ceramic matrix of LiAlO2 is considered to retain
such electrolyte. Because of the high operating temperature, the alkali carbonates form a highly ionic conductivity with carbonate CO32- ions. The anode and cathode
reactions are − − → + + + CO H O CO e H 2 2 2 4 2 2 2 2 3 2 (1-5) − − → + + 2 3 2 2 2CO 4e 2CO O (1-6)
Unlike all the other cells, CO2 must be supplied to the cathode, and thus converted to
carbonate ions. Another important feature is that CO can be fed to the MCFC as hydrogen fuel.
Solid Oxide Fuel Cell
The SOFC is the only one type of fuel cell that contain complete solid-state device. An oxide ion-conducting ceramic material is used as the electrolyte. Because only gas and liquid phase are considered, it is simpler than all the other fuel cell system. Since no liquid electrolyte is needed, the electrolyte management problems that appear with the PAFC and MCFC do not occur. The SOFC works at high operating temperatures (800-1100oC) which means that precious electrocatalysts are not needed. Like MCFC, carbon monoxide also can be fed as fuel to produce electrons. The anode and cathode reactions for the SOFC are
2H +2O= →2H O+4e− 2
2 (1-7)
O +4e− →2O=
2 (1-8)
There are two types of design of SOFC. The great advantage of the tubular SOFC is that high temperature gas-tight seals are eliminated. This is also the disadvantages of the planar design of the SOFC.
1.3 Literature Survey
Zero-Dimensional Models
The simplest method use only a single equation to describe the cell polarization is the zero-dimensional models. The models can not realize the fundamental understanding of the transport phenomena but are worth for determining the kinetic parameters and are relatively simple for use. A typical expression of the 0-D model is used by Kim et al. [7] which incorporated the gas-phase mass transport limitations
( )
i b( )
i Ri m( )
ni bU
V = + log 0 − log − − exp (1-9)
in which V is the cell potential, U is the reversible potential, io is the exchange current
density, b is the Tafel slope, R represents the total resistance, and m and n are fitting parameters, respectively. Sena et al. [8] used similar approach describing the water transport in the membrane. For Nafion 115 and 117 membranes, liquid water flooded is the limiting effect at high current density. For Nafion 112 membrane, oxygen diffusion effects dominate the cell behavior. Pisani et al. [9] and Passalacqua et al. [10] change the concentration overpotential to be a more complicate function with more fitting parameters. Pisani et al. [9] derived a semi-empirical equation to describe the performance of the fuel cell. The Ohmic overpotential is used to be the only one empirical term in the performance equation. The modeling results showed a quantitative depiction of the voltage drop at high current density. Passalacqua et al. [10] proposed a equation that described the relation between the current density and potential. The results indicated that cell performance is affected by the Nafion content. An optimal content of Nafion was found about 33 wt% of ionomer.
Fuel Cell Modeling
includes flow field, diffusion media, catalyst layer and membrane. Fuels are fed through the flow field at the anode and cathode side. The fuels flow through the diffusion media and react at the catalyst layers. At the anode catalyst layer, electrons and ions are generated by hydrogen oxidation-reactions. At the cathode catalyst layer, the oxygen reduction reactions produce either liquid or vapor water. Energy and mass transport along with electrochemical kinetics occur through various sandwich layers. Various parts of the fuel cell modeling equations are presented as follows
Membrane Modeling
For polymer electrolyte fuel cells, electrolyte is a proton-conducting membrane. Figure 1.9 shows the structure of the membrane as a function of water content [11]. The first type of membrane modeling treating the membrane system as a single phase is the diffusive model which corresponds to the vapor equilibrated membrane (panel c of figure 1.9). The model assumes that the proton and water dissolve and move by diffusion. The simplest method for use to treat the proton movement is the Ohm’s law
φ
∇ − = k
i (1-10)
where k is the membrane conductivity. The above equation is the simplified result of using dilute theory. Only the interaction between each dissolved species and the solvent is considered. If water transportation is considered in the membrane, the electro osmotic flow can be added to the overall flux of water.
C D F
i
Nw =ξ − w∇ (1-11)
in which ξ is the electro-osmotic coefficient. The effect of electro-osmotic drag is proportional to the current density. Kulikovsky [12] and Siegel et al. [13] used this method successfully to treat the membrane as a single phase. Kulikovsky study the nonlinear distribution of water content through the membrane. Water diffusion
coefficient drops rapidly blow certain λ value which causes a region with large gradient of water. The model also shows the increase of membrane resistance with current density. Siegel et al. used agglomerate catalyst geometry to analyze the fuel cell behavior. As a result, the optimal void fraction of 0.4 was found for the electro-chemical reactions. Cell performance decreased with the size of the catalyst agglomerate.
One another approach is the hydraulic model that assumes the membrane system as two phases (water and membrane). The membrane is treated as having pores that are filled with liquid water. The water content of the membrane is assumed to be constant shown in panel d of Fig. 1.9. The gas pores of the membrane are filled with liquid water. Bernardi and Verbrugge [14,15] first treated the membrane using above fashion. The Schlogl’s equation is used to define the liquid water velocity in the pores of the membrane phase which is related to the pressure gradient and potential gradient. Murgia et al. [16] used the same approach to model the liquid water transport in fuel cells. The study modified the model of Bernardi and Verbrugge (BV model). The MBV model integrated the Bulter-Volmer equation in the catalyst layer to get more stable numerical calculation. The results show indistinguishable between these two models and extend the range of the current density.
Rowe and Li [17] combined both diffusive and hydraulic model to treat the liquid water transport in the membrane. The model investigated temperature distribution and water management in the fuel cell. As a result, the temperature difference becomes larger and low operation temperature and partial humidified streams. At high operating pressure, membrane hydration decrease due to the decrease of water vapor concentration within in the anode electrode.
P k C C D F i Nw = − w∇ − ∇ μ ξ (1-12)
The problem with the above approach is the use of a gas pressure gradient. This means that the gas-phase is exist within the membrane, but does not agree with experiments.
Diffusion Media Modeling
The diffusion media are placed between the catalyst layer and gas channel which is generally made either a carbon paper or a carbon cloth material. The diffusion media provide a structure support and a pathway for reactants, water and electrons. The transportations of the species are discussed as follows
For the gas-phase transport, if the mean free path of the gas molecule is less than 0.01 times the pore radius, the Stefan-Maxwell equation is used to illustrate the gas transport in the fuel cell.
∑
≠ − = ∇ i j T ieffj i j j i i D C N x N x x , (1-13)where xis the molar fraction, eff j i
D, is the effective binary diffusion coefficient. As the
pore size is comparable to the gas mean free path, Knudsen diffusion becomes more significant. Kulikovsky et al. [18] combined both Stefan-Maxwell and Knudsen diffusion to treat both diffusion medium and catalyst layer of a PEM fuel cell cathode. Two different values of the carbon conductivity is considered to investigated oxygen concentration distribution, potential of carbon phase, electron flow and current density distribution. The simulation results indicate that a dead zone in front of the gas channel within in the catalyst layer is formed with low carbon conductivity. Reduction of the catalyst loading leads only an insignificant effect on the cell performance. Kulikovsky [12] also assumed that vapor water transport by Knudsen diffusion in the catalyst layer. In this work, the Knudsen diffusion coefficient is a function of pore
size. The diffusion coefficient of water drops significantly below certain value of water content which cause the high nonlinear distribution of liquid water across the membrane. Membrane resistance and gradient of liquid water distribution increase with current density due to nonlinear drying at the anode side of the membrane.
Bulk diffusion dominates when the pore size is 100 times to the molecule mean free path, and Knudsen diffusion dominates when the pore size 0.1 times to the molecule mean free path. Weber and Newman [11] indicated that Knudsen diffusion become a significant effect when the pore radius is less then about 0.5 μm. Typically, pore size is often 0.5~20 μm in the diffusion media, and 0.05~2 μm. in the Microporous layer. Thus, only microporous layer should be accounted using Knudsen diffusion.
The simplest method to treat the liquid water inside the cells is to neglect it. The liquid water transport is not considered and the effect is to decrease the effective diffusion coefficient of gas species. Gurau et al. [19] developed an analytical solution of a half-cell mode. The parallel composite structure of the diffusion medium with different porosity was applied to mimic the flooding effect. Chu et al. [20] further developed a one-dimensional model to consider the non-uniform porosity of the diffusion medium. In this work, various functions of the porosity are considered to simulate liquid water across the gas diffusion medium.
Gas and liquid are actually coexistence in a porous medium of the fuel cells. The interaction between gas and liquid is expressed as
r P
P
Pc = l − g =−2γ cosθ (1-14)
in which γ is the surface tension of water, θ is the contact angle, r is the pore radius. The most significant aspect of the two-phase model is the prediction of the liquid saturation s which is defined as liquid fraction of pore volume. The liquid water saturation greatly influences the gas diffusion coefficient and represents the flooding
effect. He et al. [21] used two-phase model to investigate the interdigitated flow fields of the PEM fuel cells. The simulation results indicate that high pressure gradient between the inlet and outlet channel produce higher performance of the fuel cell. An optimal thickness of the electrode (0.08 cm) is obtained. The higher the channel/shoulder ratio also yields better cell performance. Natarajan and Nguyen [22] developed a three-dimensional model the study the liquid water flooding in the fuel cell cathode. As a result, higher stoichiometric rate and temperature result in higher current density. The cell performance increase with decreasing inlet stream humidity You and Liu [23] developed a multiple-phase mixture model to examine the two-phase distribution in the fuel cell cathode. The liquid water saturation increases with current density. In addition, high humidification temperature at both anode and cathode inlet increase the liquid water saturation but decrease the limiting current density. Pasaogullari and Wang [24] applied the commercial CFD software, Fluent, to study the effect of humidification level and flow rate of reactants on the cell performance and liquid saturation profile. Liquid saturation increased with humidification level along the flow channel. In the fully humidified situation, the membrane are well hydrated which results high current density.
Catalyst Layer Modeling
The simplest type of catalyst layer modeling is the zero-dimensional or interface models. The catalyst layers are treated as an interface between the diffusion media and the membrane. The thickness and the structure of the catalyst layer are assumed to be ignored. Kulikovsky [12] and Natarajan [20] used Faraday’s law as a generation/consumption term at the boundary between the membrane and the diffusion medium. More rigorous modeling (porous-electrode model) treat the catalyst layer with finite thickness [16,17]. The characteristic length is the thickness of the
catalyst layer. This model is concerned about the chemical-reaction distribution across the catalyst layer. Siegel [13] described a mathematical PEMFC model base on agglomerate catalyst geometry. The model describes that gas flow through pores and then diffuses into agglomerate catalyst, as shown in Fig 1.10. In this approach, the characteristic length is the agglomerate size and the agglomerates are assumed to be uniform. Pisani et al [25] considered cylindrical gas pores of fixed radius through the catalyst layer. Both longitudinal and transverse oxygen diffusion are solved in gas phase and liquid phase, respectively. Pisani [26] further compared five different porous structure of the catalyst layer. Lin et al [27] used thin-film agglomerate model to simulate the catalyst layer structure. For the agglomerate model analysis, an effectiveness factor is used to describe the ORR as follows
E ai i= h ⋅
∇ (1-15)
where E is the effectiveness factor. In spherical agglomerate, an analytic expression is shown as [28,29]
(
3 coth( )
3 1)
3 1 2 − = φ φ φ E (1-16)where φ is the Thiele modulus for the system. eff O agg D , 2 Κ ζ φ = (1-17)
where ζ is the characteristic length of the agglomerate, Ragg/3 for spheres, Ragg/2 for
cylinders, and δagg for slabs, and Κ is a rate constant given by
(
)
⎟ ⎠ ⎞ ⎜ ⎝ ⎛− = c ORR ref O ORR RT F FC ai α η Κ exp 4 2 (1-18)The governing equation for the agglomerate model without external mass-transfer limitation is expressed as
⎟ ⎟ ⎟ ⎟ ⎟ ⎠ ⎞ ⎜ ⎜ ⎜ ⎜ ⎜ ⎝ ⎛ + = ⋅ ∇ E D A FC i FILM O agg film bulk O Κ δ 1 1 4 , 2 2 (1-19)
Poisoning Effects by Impurity Ions and CO
Many researchers have focused their interest to investigate the effects of the impurities ions from both hydrogen fuel and air on the cell performance. Okada et al. [30-37] experimentally examined the water transport in the membrane of the fuel cell with the effects of various impurity ions. Water content, membrane conductivity, ionic transference coefficient, and diffusion coefficient of water decrease with an increase in the impurity ions. Okada [38,39] and Chen et al.[40] theoretically discussed the effect by impurity cations in membranes of PEM fuel cells. Okada [38,39] investigated the poisoning effect of impurity ions at the anode and cathode side, respectively. Operating current density and membrane thickness significantly affect the membrane performance. The most severe effects on the cell performance by the contaminant ions occur at the membrane-cathode interface. Chen [40] combined the theoretical model by Okada [38,39] to study the transient behavior of water transport in the membrane. The results show that contaminant ions enhance the electro-osmotic effect but decrease the diffusion of water from cathode. The steady state time tss
decrease with the initial current density increase.
The most efficient fuel for use in a PEM fuel cell is pure hydrogen. However, this is difficult to store and has a high cost of production. Reforming from hydrocarbons, including gasoline and alcohol is the most extensively used technique for generating hydrogen fuel, which contain 45% hydrogen, 10ppm CO, 15% CO2 and 1% CH4 [1].
the electro-oxidation of hydrogen [2-3]. The affinity between CO and Pt is such that even at this low concentration of CO, the consequent loss of performance is severe [4-5]. Lee et al. [4] investigated the tolerance of PtSn/C, Pt/C and PtRu/C alloy electrocatalysts for CO. Depending on the nature of the electrode material, the CO oxidation occurs at different potentials. The improvement of CO tolerance is contributed by the changes in the thermodynamics and the CO adsorption process. Murthy et al. [5] presented the steady-state and transient performance of a fuel cell with relatively high concentrations of CO, for two types of gas diffusion media.
Recently, many efforts have been made to increase the tolerance of the PEM fuel cell to CO [41-46]. Schmidt et al. [41] and Divisek et al. [42] presented two methods for improving the cell performance using H2/CO as a fuel. First, the use of Pt-Ru
electrocatalysts at the anode can considerably enhance the tolerance to CO. Second, the addition of liquid hydrogen peroxide to the humidification water in the cell leads to the formation of active oxygen by the decomposition of H2O2. Complete recovery
can be achieved for H2/100 ppm CO. Si et al. studied the CO tolerance of the Pt-Ru/C
catalyst at elevated temperature and atmospheric pressure in a PEM fuel cell [43]. They demonstrated that the anodic polarization fell dramatically as the temperature increased, because the CO coverage was lower. Improving the activity of the catalyst with a high CO tolerance increases the rates of reaction of CO and hydrogen. Zhang et al. [44] found that CO poisoning process can be accelerated at high anode flow rate. The performance decreases substantially as the anode flow rate increases, because CO is adsorbed on the catalyst site. However, increasing the anode overpotential promotes the oxidation of CO, maintaining desired cell performance. Yu et al. [45] and Santiago et al. [46] adopted the Pt-Ru/C electrocatalyst for different electrode structures to improve the tolerance of PEMFC to CO. Water sufficiently activates the Ru surface to
Pt–Ru–P/C catalyst. The results show that Pt–Ru–P/C catalyst shows high activity for the methanol electro-oxidation. The greater oxidation of carbon monoxide also obtains compared with Pt–Ru/C catalyst. A PtRuIr/C catalyst was prepared by Liang et al [48] to exhibit excellent CO tolerance for PEM fuel cells. Ir in the PtRu electrocatalyst produces excellent activity of CO electro-oxidations. The superior performance is attributed by the interaction between RuO2 and IrO2.
To avoid the use of precious metal, some researchers adopted some methods to restore the cell performance during the operation process, including the oxidant-bleeding [49,50], self-oxidation [2,51], and current-pulsing [51,52]. Qi et al. [49] used cyclic voltammetry method to detect the CO adsorption on the cathode catalyst layer. The results show poisoning and recovering process is quickly within in 15 minutes. CO can pass through the membrane and poison the cathode catalyst. The potential drop at the cathode side is sometimes larger than anode. Well hydrated membrane can prevent CO crossover the membrane and increase the tolerance of CO. Adock et al. [50] used reconfigured anode (RCA) to enhance the air-bleed effectiveness for increase the CO tolerance of the fuel cell. A nonprecious-metal is place on the anode side adjacent to the flow field in order to perform preferential oxidations. Thomason et al. [51] compared both self-oxidation and current pulsing method for increasing the tolerance of CO. From the experimental results, current pulsing is more effective than self-oxidation in creasing the tolerance of CO. Carrette et al. [52] also used pulsing technique for determining the optimized operating conditions. Under various CO concentration, pulsing frequency need to be adjusted without significant performance loss.
Other researches have been developed to investigate the effect of hydrogen dilution in the anode feed [53, 54]. The effect of hydrogen dilution without CO containing fuel has been studied [53]. The predicted polarization curves showed a strong effect on cell
performance. Gu [54] studied the dilution effect of N2 and CO2 individually. As a
result of RWGS, CO2/H2 mixture has significantly larger polarization than N2/H2
mixture at the same concentration. Wee and Lee [55] established an overview of the development of CO tolerant electrocatalysts.
In theoretical studies, Springer et al. [56] derived a mathematical model to describe CO poisoning on the catalytic sites. Chan et al. [57] combined the theoretical models developed by Springer et al. [56] and Bernardi et al. [14,15] to examine the CO kinetics. Bhatia and Wang [58] treated the characteristics of the anode catalyst layer as a boundary condition in analyzing the transient CO poisoning behaviors for various levels of CO. Baschuk and Li [59] developed a mathematical model to simulate both CO poisoning and oxygen bleeding.
Recently, high temperature polybenzimidazole (PBI) membrane fuel cells have received great attentions. Wainright et al. [60] applied acid-doped PBI membrane for fuel cells. PBI is a basic polymer and exhibits high conductivity through doping with various acids or bases. Sulphuric acid and phosphoric acid are the most widely used doping matter to perform high conductivity. Wang et al. [61] demonstrated that the PBI membrane fuel cells performed well at 150oC under atmosphere. After 200 hour operating, no membrane dehydration occurred. Li et al. [62] investigated phosphoric acid doped PBI membrane fuel cell in a various doping range. Acid doping level, water uptake, water drag coefficient and mechanical strength were all investigated. Proton conductivity of PBI and PBI composite membranes was measured by He et al. [63]. The conductivity could be influence by temperature, acid doping level and humidity. Li et al. [64] studied the influence of doping level and water uptake of PBI membrane fuel cells. Methanol permeation and proton conductivity of poly(N-methylbenzimidazole) (PNMBI), poly(N-ethylbenzimidazole) (PNEBI) and
membrane conductivity under various humidity, temperature and acid doping level. Liu et al. [67,68] investigated the O2 reduction at a Pt-polymer electrolyte interface.
The operating temperature of acid-doped PBI membrane fuel cells is much higher than PFSA polymer membrane fuel cells. Several advantages make it superior to low temperature PEMFC. Firstly, operating temperature up to 200oC can tolerate up to 3% CO in anode hydrogen fuel [69]. Dhar et al. [70,71] indicated that CO adsorption at platinum catalysts was easily occurred at low temperature. This makes it possible that the reformed gas can be fed directly into the fuel cell thus simplify the fuel cell system. Secondly, water managements such as liquid water flooding can be neglect at elevated temperature higher than boiling point of liquid water. He et al. [63] indicated that relative humidity is quite less influence on membrane conductivity of PBI membrane than Nafion membrane. Fuel cells work at high temperature can be made into a compact design with methanol reformer [72-76]. This is because nearly 100% conversion can be made around 200oC through methanol steam reforming [75,76]. Reformed gas not only can be fed into the fuel cell directly but also provide a sufficient amount of heat for fuel cells. Park et al [74] developed a microchannel methanol steam reformer for fuel cells. As shown in Figure 1.11, microchannel reactors are integrated with the combustor, vaporizer, heat exchanger and steam reformer. Pan et al. [75] integrated a high temperature PBI membrane fuel cell with a methanol steam reformer as shown in Figure 1.12. The integration successfully improves the system construction and efficiency.
Several experiments have been made to analyze high temperature PBI membrane fuel cells. But there are only few of theoretical studies. Cheddie and Munroe [77] applied a one-dimensional model to predict the performance of PBI membrane fuel cells. Korsgaard et al [78] used a semi empirical model to approach the experimental data of polarization curves of PBI membrane fuel cells. However, there are still absent
of theoretical investigations to realize the fundamental transportation inside the PBI membrane fuel cells.
1.4 Objectives
In the present study, our purpose is to analyze how carbon monoxide poisoning affects the performance and durability of a PEM fuel cell. First, we develop a one-dimensional transient mathematical model to simulate the carbon monoxide poisoning effect of the PEM fuel cell. Because of the transient evolution of the CO poisoning is not well understood. This study focuses on the transient behavior of CO poisoning process across the anode catalyst layer and the response time to reach steady state tss. Hydrogen and CO adsorption on the catalyst site explain how CO
results in a less available catalyst site for hydrogen electro-oxidation.
Second, we develop a one-dimensional, two-phase theoretical model to analyze the CO poisoning effect of a fuel cell. We discuss the transport of water, fuel and oxidant in the MEA of PEM fuel cells based on two-phase modeling. Both vapor and liquid water transport are discussed inside the cell. The slowing of the chemical reactions at both the anode and the cathode can influence the liquid water distribution in the catalyst layers and membrane. The effects of dilute hydrogen feed are also discussed.
Third, a transient mathematical model is extended from our previous two-phase model to analyze how CO poisoning affects the PEM fuel cell. This is because that there is no existing study which shows the transient evolution of liquid water transport under CO poisoning process. This work tries to make some contribution in the scientific understanding on the effect of CO poisoning in PEM fuel cells. The time to reach steady state tss is discussed under various operating cell voltage and the amount
Finally, an experimental apparatus has been built to investigate high temperature PBI membrane fuel cells. The operating temperature of acid-doped PBI membrane fuel cells is much higher than PFSA polymer membrane fuel cells. Our objectives are to investigate the performance of PBI membrane fuel cells under various fuel compositions from both simulation and experiments. Effects of temperature, CO content and hydrogen concentration on the cell performance and tss are all investigated.
The transportations of hydrogen coverage, CO coverage on the platinum catalysts and the ionic potential loss across the MEA were shown in our simulation results.
Fig 1.1 Energy demand of the world between 1970 to 2030 (IEA, 2006)
Fig 1.2 CO2 emissions by fuel grow 55% between 1990 to 2030 (IEA, 2006)
1970 1980 1990 2000 2010 2020 2030 18000 16000 14000 12000 10000 8000 6000 4000 2000 0 Other renewables Nuclear Biomass Gas Coal Oil
Mtoe
1990 2004 2010 2015 2030 Billion to nes 50 40 30 20 10 0 Increase of 14.3 Gt (55%)Fig 1.3 The hydrogen, fuel cells & infrastructure technologies program [EERE / DOE, 2006]
Fig 1.4 A domestic hydrogen energy system [EERE / DOE, 2005] Production
Storage Delivery
Fuel Cells Technology Validation System Integration/Analyses
Safety
Codes & Standards Education
H
2
Economy
Fig 1.5 Hydrogen economy timeline [EERE / DOE, 2005] Phase I Phase II Phase III Phase IV 2000 2010 2020 2030 2040
Realization of Hydrogen Economy Expansion of Markets & Infrastructure
Transition to the Marketplace
Strong Government R&D Role Strong Industry Commericalization Role Commericalization Decision 1 2 3 4 RD & D
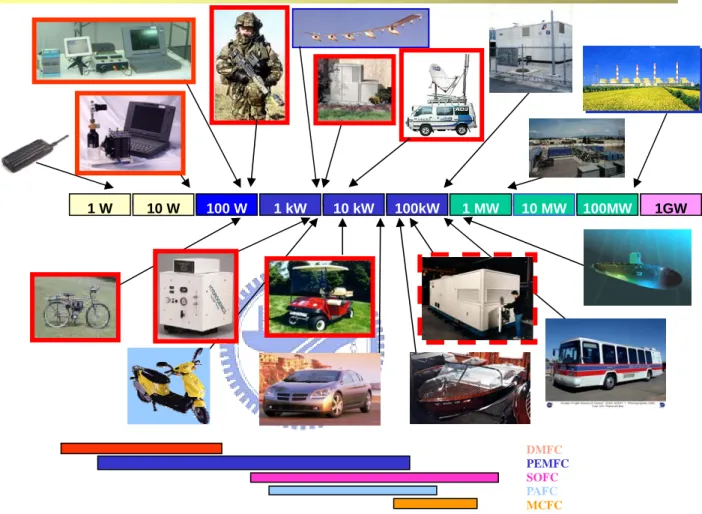
Fig 1.6 Applications of the fuel cell (ERL/ITRI) DMFC PEMFC SOFC PAFC MCFC 1 W 10 W 100 W 1 kW 10 kW 100kW 1 MW 10 MW 100MW 1GW
Fig 1.7 Schematic diagram of a PEM fuel cell H+ e -H+ H+ e -H2 H2 H2 O2 O2 O2
Fig 1.8 Component diagram of a PEM fuel cell
End plate Current
collector
Bipolar
plate
Diffusion media
Catalyst
layer
Membrane
Catalyst
layer
Diffusion media
Bipolar
plate
Current
collector
End plate
Fig 1.9 Structure of the membrane as a function of water content [11]
Fig. 1.11. Methanol fuel processor [74].
Fig 1.12 A PBI cell stack with an integrated methanol reformer [75]
2. Transient Behaviors of CO Poisoning in the Anode
Catalyst Layer
A one-dimensional transient mathematical model is applied to simulate the carbon monoxide poisoning effect on the performance of the PEM fuel cell. Based on the CO kinetic model developed by Springer et al. [56], the transient behaviors of CO poisoning process across the anode catalyst layer is investigated. Several physical parameters are considered to promote the tolerance for CO and analyze the influence on the response time to reach steady state tss. The transient behavior of hydrogen and
CO transport are also investigated. In this chapter, an anode catalyst layer of thickness Lc is considered, as schematically shown in Fig. 2.1. Some basic assumptions were
made as following:
1. Unsteady state.
2. One dimension, isothermal. 3. Ideal gas.
4. Catalyst layer is isotropic.
5. Only diffusion mechanism is considered.
6. Hydrogen and carbon monoxide were considered in the catalyst layer. 7. Anode overpotential is constant.
8. Liquid water is neglected.
2.1 Theoretical Model
Consider an anode catalyst layer of thickness Lc, as schematically shown in Fig. 2.1.
was adopted in this work. For hydrogen, CO, and Pt interfacial kinetics, four expressions are described as follows
(
H Pt)
Pt H fH fH fH k k b↔ − +2 2 2(2-1)
CO Pt fc
(
CO Pt)
fc fc k k b↔ − +(2-2)
(
CO−Pt)
+H O→kec Pt+CO +2H+ +2e− 2 2(2-3)
H −Pt→keH Pt+H+ +e−
(2-4)
Hydrogen dissociative chemisorption and the CO adsorption on the Pt catalyst sites are described by the Eq. (2-1) and Eq. (2-2), respectively. In the above equations, The Eq. (2-3) and Eq. (2-4) represent the CO and hydrogen electro-oxidation, respectively. Under the time-dependent conditions, Eq. (2-5) and Eq. (2-6) describe the first order transient process of adsorption, desorption and charge fluxes.
(
)
⎟⎟ ⎠ ⎞ ⎜⎜ ⎝ ⎛ − − − − = RT F n k k b P X k dt d H H eH H fH fH CO H H fH H 2 sinh 2 1 2 2 2 2 2 θ θ θ θ η θ ξ(2-5)
(
)
⎟ ⎠ ⎞ ⎜ ⎝ ⎛ − − − − = RT F n k k b P X k dt d CO CO eCO CO fCO fCO CO H CO fCO CO 2 sinh 2 1 θ θ θ θ η θ ξ(2-6)
where θH2 and θCO denote the fraction of catalyst site cover by hydrogen and CO, respectively. The forward rate constant of hydrogen and CO adsorption-to-desorption
rate ratios are expressed as k andfH b , which are functions of CO coverage ratio fc
and expressed as follows:
(
)
⎥ ⎥ ⎦ ⎤ ⎢ ⎢ ⎣ ⎡ ⎟⎟ ⎠ ⎞ ⎜⎜ ⎝ ⎛ ⎟⎟ ⎠ ⎞ ⎜⎜ ⎝ ⎛ − − Δ − ⋅ = 1 exp 1 exp 0 CO CO H fH fH RT E k k θ λθ δ(2-7)
(
)
⎥⎦ ⎤ ⎢⎣ ⎡ ⋅ = CO CO fCO fCO RT G b b 0 exp δ Δ θ(2-8)
Unsteady transport equations for H2 and CO across the anode catalyst layer can be written as:
⎟ ⎟ ⎠ ⎞ ⎜ ⎜ ⎝ ⎛ − ∂ ∂ = ∂ ∂ F n dx di x C D t C H H H H H CL H CL 2 2 2 2 2 2 2 2 γ ε ε
(2-9) ⎟⎟ ⎠ ⎞ ⎜⎜ ⎝ ⎛ − ∂ ∂ = ∂ ∂ F n dx di x C D t C CO CO CO CO CO CL CO CL γ ε ε 2 2
(2-10)
Where εCL stands for the gas porosity, D and H2 DCO denote the diffusion
coefficient of hydrogen and CO, respectively. s is the stoichiometric coefficient, n
is the number of electrons, F is Faraday constant, and
dx di
is the electro-chemical
reactions which are described by Eq. (2-11). Subscripts H2 and CO represent the hydrogen and carbon monoxide, respectively. The operating current density is then:
⎟ ⎠ ⎞ ⎜ ⎝ ⎛ + ⎟⎟ ⎠ ⎞ ⎜⎜ ⎝ ⎛ = + = RT F n ak RT F n ak dx di dx di dx di CO CO eCO H H eH CO H 2 sinh 4 2 sin 2 2 2 2 θ η θ η (2-11)
To investigate the transient behaviors of the reactant gases distributions and coverage ratio distributions across the anode catalyst layer, the initial conditions are all set from zero which expressed as follows:
( )
0 2 2 ,0 H H x C C = (2-12)( )
,0 0 CO CO x C C = (2-13)( )
0 2 2 ,0 H H x θ θ = (2-14)( )
,0 0 CO CO x θ θ = (2-15)At the boundary x=0, the hydrogen and CO are given a fixed amount of concentration. The interface between the anode catalyst layer and the membrane (x=Lc), the flux of
reactant gases equal to zero. The corresponding boundary conditions are illustrated as follows:
C Cin
( )
tH
( )
t C C in CO CO = 0,(2-17)
(
L t)
x C DH H2 0 c, 2 ∂ = ∂(2-18)
(
L t)
x C D CO c CO ∂ =0 , ∂ (2-19)Because of no electro-oxidation occurs at the interface between the anode gas diffusion layer and the anode catalyst layer, the current density is set to be zero.
0 =
i (2-20)
2.2 Numerical Method
The equations (2-9) and (2-10) for H2 and CO are the parabolic partial differential equations. In this study, governing equations were solved by using implicit method. The above equations can be rewritten as
⎟ ⎟ ⎠ ⎞ ⎜ ⎜ ⎝ ⎛ − + − = − + + + + + + F n dx di x C C C D t C C H H i H n i H n i H n i H H CL n i H n i H CL 2 2 2 2 2 2 2 2 2 , 2 1 1 , 1 , 1 1 , , 1 , 2 γ Δ ε Δ ε
(2-21)
⎟⎟ ⎠ ⎞ ⎜⎜ ⎝ ⎛ − + − = − + + + + + + F n dx di x C C C D t C C CO CO i CO n i CO n i CO n i CO CO CL n i CO n i CO CL γ Δ ε Δ ε , 2 1 1 , 1 , 1 1 , , 1 , 2(2-22)
The 4th order Runge Kutta algorithm were applied to solved the coverage of H2
and CO. The governing equations must be solved simultaneous for the dependent variables. The steady-state condition is defined as the relative error reaches:
8 1 10− + ≤ − n i n i n i C C C (2-21) in which n i
C represents any variables at nth time step.
2.3 Results and Discussion
To examine the transient behaviors of the poisoning process, various CO concentrations are employed to simulate a wide range of hydrogen fuel from the
![Fig 1.5 Hydrogen economy timeline [EERE / DOE, 2005] Phase I Phase II Phase III Phase IV 2000 2010 2020 2030 2040](https://thumb-ap.123doks.com/thumbv2/9libinfo/8027911.161258/42.892.166.754.255.752/hydrogen-economy-timeline-eere-phase-phase-phase-phase.webp)
![Fig 1.9 Structure of the membrane as a function of water content [11]](https://thumb-ap.123doks.com/thumbv2/9libinfo/8027911.161258/46.892.156.707.149.776/fig-structure-membrane-function-water-content.webp)