國立交通大學
環境工程研究所
碩士論文
不同作業場所的工程奈米與可呼吸性微粒暴露
Exposure of engineered nano-sized and respirable
particles at different workplaces
研究生
:黃政毓
指導教授
:蔡春進 博士
不同作業場所的工程奈米與可呼吸性微粒暴露
Exposure of engineered nano-sized and respirable
particles at different workplaces
研究生
: 黃政毓 Student : Cheng-Yu Huang
指導教授
: 蔡春進 Advisor : Chuen-Jinn Tsai
國立交通大學
環境工程研究所
碩士論文
A Thesis
Submitted to Institute of Environmental Engineering
College of Engineering
National Chiao Tung University
in Partial Fulfillment of Requirements
for the Degree of
Master of Science
in
Environmental Engineering
2010
Hsinchu, Taiwan, Republic of China
CHINESE ABSTRACT
本研究在三個不同工程奈米微粒相關的作業場所進行工程奈米微粒及可呼吸性微 粒暴露量測,包括奈米二氧化矽氧化樹酯封裝材料製造廠的粉體混料區及奈米碳黑和奈 米碳酸鈣粉體製造廠的粉體包裝區。結果顯示奈米微粒質量濃度在碳黑粉體製造廠為最 高,主要原因柴油堆高機的廢氣中含有大量的奈米微粒。在奈米二氧化矽氧化樹酯封裝 材料製造廠所測到的可呼吸性微粒質量濃度達 1963±1051 g/m3,比奈米碳黑及奈米碳 酸鈣的 159±52 及 154±74g/m3高很多,主要原因在於此工作場所逸散出的奈米微粒較 多,且作業空間未使用有效的通風系統。此外在這三個作業場所中所量測到的質量中間 氣動粒徑為 4.6~6.1 m,屬於超微米範圍而不是奈米尺度,此結果可由化學分析和旋轉 腔體分散方法得到驗證。對於奈米微粒數目濃度而言,本研究發現只有在奈米粉體處理 過程中或是柴油堆高機的廢氣才會導致作業場所中的奈米微粒數目濃度升高,在其餘時 間其濃度皆維持在背景值附近。由穿透式電子顯微鏡的分析可知奈米微粒確實存在,然 而現場量測及粉體分散之結果均顯示,奈米微粒的數目濃度雖高於微米級微粒,但由於 奈米微粒聚集成微米級微粒之故,致使其質量濃度很低。因此本研究建議對於奈米粉體 的作業場所的暴露評估,應同時兼顧奈米及可呼吸性微粒的數目及質量濃度。 關鍵字:暴露評估、氣膠採樣、奈米微粒、可呼吸性微粒、旋轉腔體試驗ENGLISH ABSTRACT
In this study, engineered nanoparticle (ENP) and respirable particles exposure measurements were conducted at three different ENP-related workplaces, including the
mixing area of nano-SiO2 epoxy molding compound plant, two bagging areas of the
nano-CaCO3 and nano-carbon black (nano-CB) manufacturing plants. Results show that NP
mass concentration at the nano-CB manufacturing plant was the highest due to diesel forklift exhaust. The highest respirable particle mass (RPM) concentration was observed to be
1591±1051 g/m3
at the nano-SiO2 epoxy molding compound plant, which was much higher
than 159±52 and 154±74g/m3
at the bagging areas of the nano-CB and nano-CaCO3,
respectively, due to higher NP emission rate and ineffective ventilation system at this location. The mass median aerodynamic diameters (MMADs) at these workplaces were supermicron rather than nano-sized, which was also confirmed by chemical analysis of the collected particles and the results of the rotating drum testing. The NP number concentration maintained at background level unless there were material handling activities or if the diesel forklifts were used in the workplaces. The TEM analysis showed that nano-sized particles indeed existed. However both the field exposure data and results of rotation drum test showed that although nanoparticle concentration was much higher than that of supermicron particles, its mass concentration was much lower due to agglomeration of nanoparticle into micron-sized particles. Therefore, it is suggested that both number and mass concentrations of nano-sized and respirable particles be considered when assessing the exposure of nanopowder-related workplaces.
Keywords: exposure assessment, aerosol sampling, nanoparticle, respirable particle, rotating drum test
CONTENT
CHINESE ABSTRACT...i
ENGLISH ABSTRACT ...ii
CONTENT ...iii
TABLE CONTENT ...iv
FIGURE CONTENT ... v
CHAPTER 1 INTRODUCTION... 1
1.1 Toxicity of nanoparticles ... 1
1.2 Workplace measurement methods ... 2
1.3 Dustiness test ... 3
1.4 Objectives of this study ... 3
CHAPTER 2 MATERIALS AND METHODS... 5
2.1 Sampling site description ... 5
2.2 Sampling and analytical method ... 6
2.3 Dustiness test ... 8
CHAPTER 3 RESULTS AND DISCUSSION ... 10
3.1 Respirable particle mass concentrations and mass distributions ... 10
3.2 NP concentrations... 10 3.3 Chemical compositions ... 11 3.4 Dustiness Test ... 12 CHAPTER 4 CONCLUSIONS ... 16 REFERENCES ... 17 APPENDIX ... 35
TABLE CONTENT
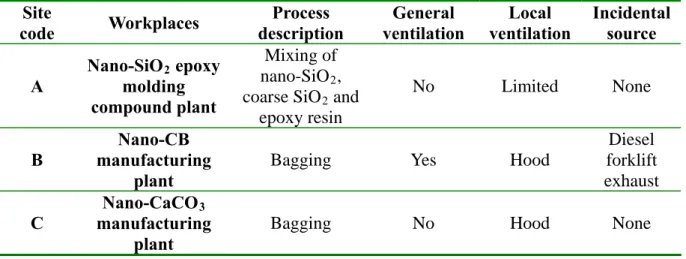
Table 1 Characteristic of the workplaces... 21
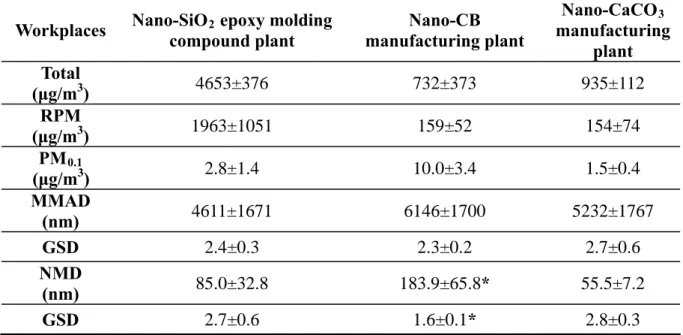
Table 2 Particle concentrations at the workplaces... 22
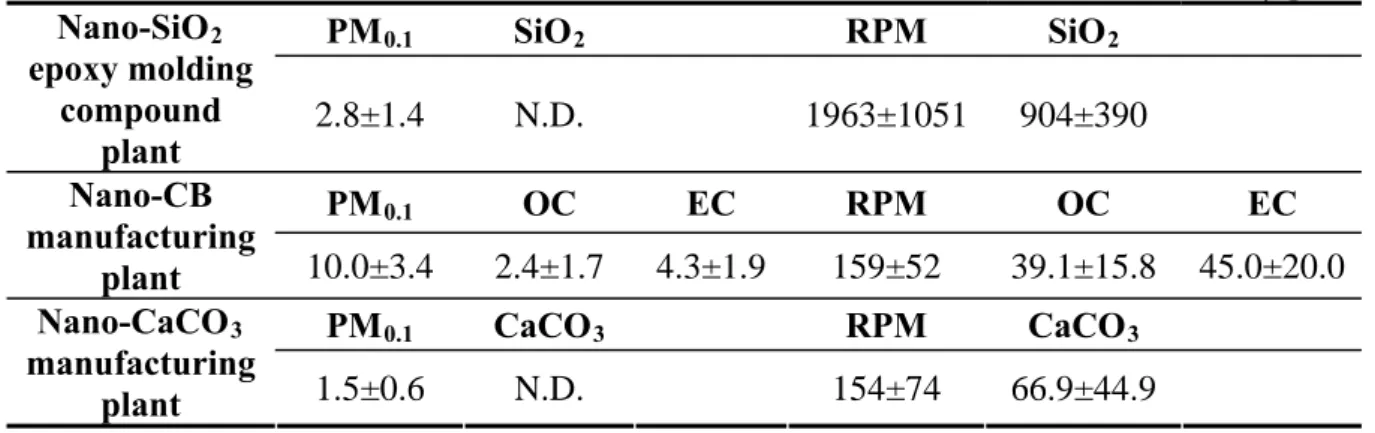
Table 3 Chemical composition analysis at different workplaces... 23
FIGURE CONTENT
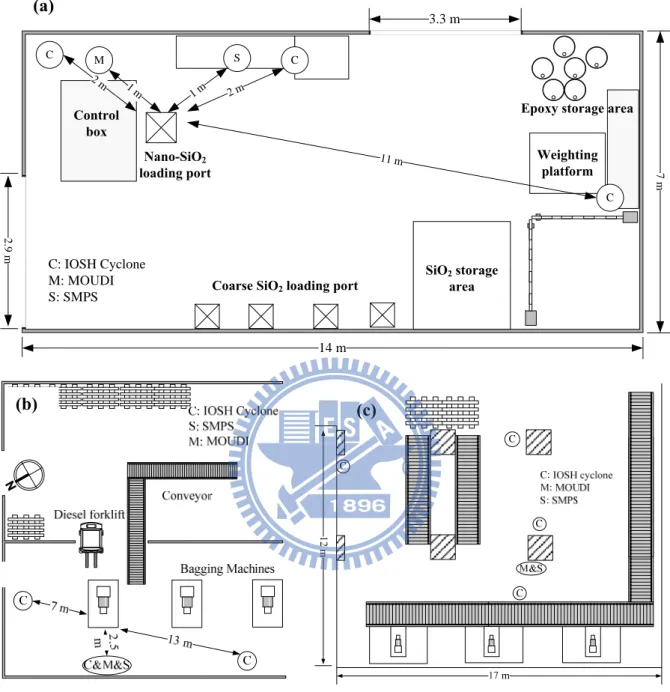
Figure 1 Schematic diagram of the three workplaces (a) Mixing area of the nano-SiO epoxy molding compound plant; (b) Bagging area of the nano-CB manufacturing plant; (c) Bagging area of the nano-CaCO manufacturing plant
2
3 ... 25
Figure 2 Experimental setup of dustiness test (a) standard rotating drum tester with a modified sampling train (b) SSPD ... 26
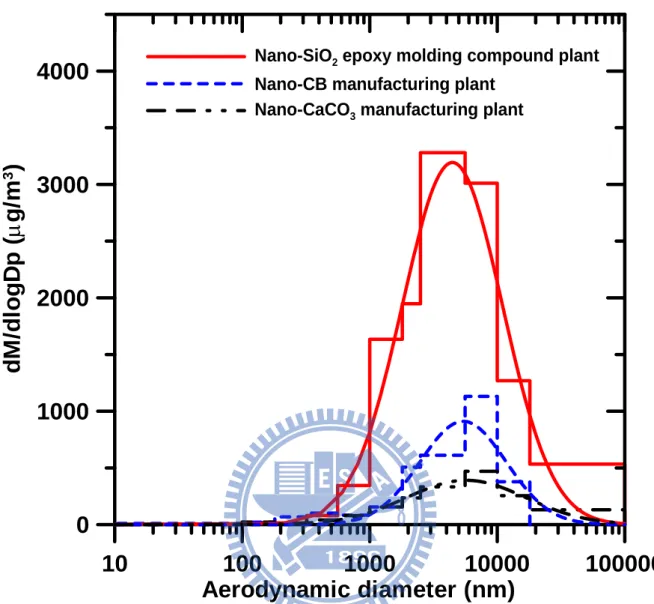
Figure 3 Particle mass distributions measured by MOUDI at different workplaces... 27
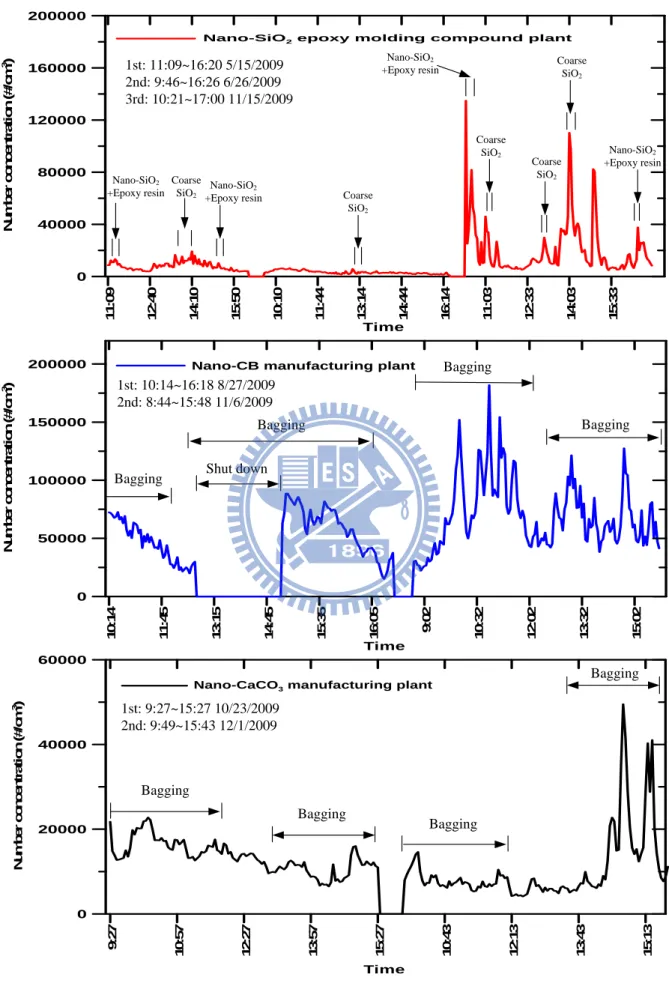
Figure 4 Number concentrations with sampling time measured by SMPS ... 28
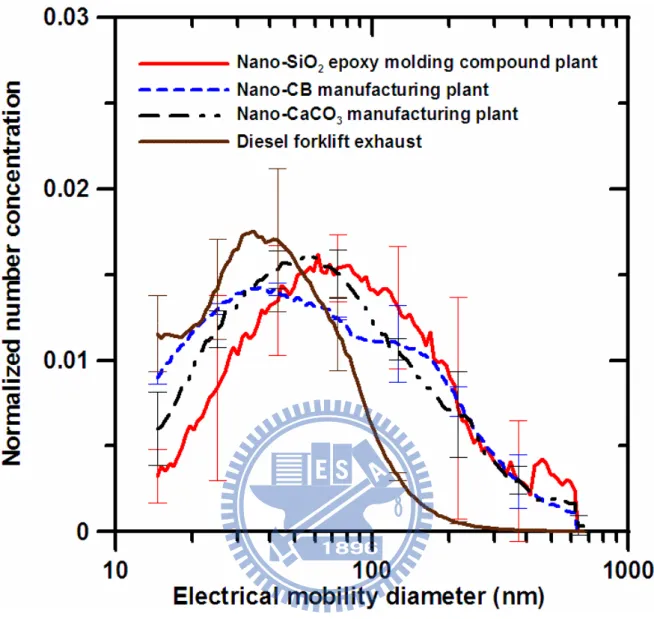
Figure 5 Particle number distributions measured by SMPS at different workplaces ... 29
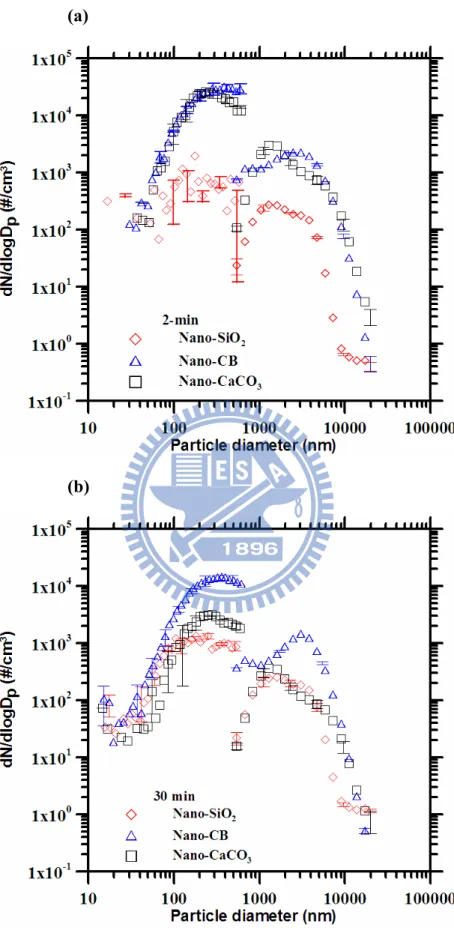
Figure 6 Particle number distributions measured by SMPS and APS for rotating drum test (a) 2-min average (b) 30-min average... 30
Figure 7 Particle mass distributions measured by MOUDI for rotating drum test... 31
Figure 8 Dispersed size distributions of different powders based on unit mass (a) SSPD (b) rotating drum ... 32
Figure 9 Dispersed mass distributions of different powders based on unit powder mass (a) SSPD (b) rotating drum ... 33
Figure 10 TEM pictures (a) Nano-SiO (b) Nano-CB (c) Nano-CaCO ... 34 2 3 Figure A 1 Spatial RPM concentration distributions at different workplaces (a) mixing area of the nano-SiO epoxy molding compound plant (b) bagging area of the nano-CB manufacturing plant (c) bagging area of the nano-CaCO manufacturing plant 2 3 ... 36
Figure A 2 Total particle number concentrations versus time (a) SSPD (b) rotating drum... 37
Figure A 3 Total particle number concentrations versus sampling time (a) SSPD (b) rotating drum, based on per unit mass of dispersed powders ... 38
CHAPTER 1 INTRODUCTION
The development and commercialization of nanotechnologies are proceeding at an incredible pace. Many consumer products are being produced and more sophisticated products, processes and applications are under development (Tsai and Pui, 2009; PEN, 2009) As of August 2009, the nanotechnology consumer products inventory contains 1015 products in health and fitness, home and garden, food and beverage, electronics and computers categories, etc (PEN, 2009). These products are very beneficial to our life and increasing at an amazing production rate yet the potential negative side effects of nanotechnology-related products are being increasingly questioned during production, use, handling, storage and cleaning. In particular workers in the workplace may have the greatest potential to expose to nanoparticles (NPs) and lead to health risks (Schulte et al., 2008; Tsai and Pui, 2009a).
1.1 Toxicity of nanoparticles
Many toxicological studies have shown that NPs are more harmful to health than large-sized particles because of their order of magnitude higher particle number concentrations and surface area than large particles of the same mass. Airborne NPs can be inhaled and subsequently deposited in the respiratory tract and lung that could cause inflammation and tissue injury (Donaldson et al., 1998; Maynard and Kuempel, 2005; Oberdöster et al., 2005). They can penetrate through the bloodstream to the other organs such as liver and spleen and result in adverse effects (Ballou et al., 2004; Oberdöster et al., 2005). Distribution to heart, kidney and immune-modulating organs (e.g. spleen and bone marrow) has also been reported (Cagle et al., 1999; Ballou et al., 2004). Thus it is very important to measure NP exposure for assessing its possible health effects. So far, experience on occupational monitoring during NP production is still in its infancy (The Royal Society, 2004). Better exposure measurement methods are yet to be developed and there is a critical need to collect more exposure data at different workplaces,
1.2 Workplace measurement methods
Traditional exposure monitoring uses gravimetric technique when assessing airborne particle exposure, thus occupational thresholds for exposure are almost mass based (e.g.
mg/m3) (NIOSH, 2005). Scientific reviews found that bulk mass concentration is insufficient
and suggest particle number and possibly surface area are better indicators (Aitken et al., 2004; Brouwer et al., 2004; Oberdöster et al., 2005). However, the actual exposure data are not enough to assess the risks of NP exposure in the workplace. Hence it is urgent to establish an appropriate sampling method and conduct exposure measurements at NP associated workplaces.
The National Institute for Occupational Safety and Health (NIOSH) proposed a novel nanoparticle emission assessment technique (NEAT) by using an optical particle counter (OPC, HHPC-6), a condensed particle counter (CPC, TSI 3007) and a filter-based sampler (Methner et al., 2010a). These hand-held CPC and OPC are very convenient for field exposure measurement. However the particle concentrations in the workplaces are usually higher than the detected limits of these two devices. Brouwer (2010) reviewed many field exposure studies which showed bimodal size distributions in terms of particle number with size modes often around 200-400 nm and 1-20 m, respectively. It was found that particle number, surface area and mass concentrations were not consistent except some associations of large particle number concentrations with mass concentrations. The available data for different number, surface area and mass concentrations were not sound enough to test mutual correlations (Brouwer, 2010). Therefore, actual correlations between these parameters need to be confirmed by more exposure measurements. In addition, there are several incidental sources which could result in high background concentration and prevent precise determination of NPs emitted from the processes. The incidental NPs sources in the workplace include diesel powered forklifts, natural gas heating units, vacuum pumps and NPs
infiltrated from other areas (Kuhlbusch et al., 2004; Peters et al., 2006; Brouwer, 2010; Methner et al., 2010b).
1.3 Dustiness test
Dustiness is one of the key factors to determine NP emission which influence NP exposure in the workplaces. Different dustiness testing methods have been developed to simulate powder handling processes (Hamelmann and Schmidt, 2003) but the results from different methods may not be consistent (Tielemans et al., 2008). The European standard EN 15051 (CEN 2006) specifies two reference test methods: the rotating drum and the continuous drop methods, in which the dustiness index is based on the respirable, thoracic, and inhalable mass per mass of tested material. The rotating drum method is a frequently employed method because of its ability to simulate a wide range of material handling processes for the estimation of dustiness (Mark, 2005; Petavratzi et al., 2007). Tsai et al. (2008) tested
nano-TiO2 and fine ZnO using the EN15051 rotating drum with a modified sampling train
where the respirable dust was characterized by a scanning mobility particle sizer (SMPS, Model 3936, TSI Inc., MN, USA), an aerodynamic particle sizer (APS, Model 3321, TSI Inc., MN, USA), and a micro orifice uniform deposit impactor (MOUDI, Model 110, MSP Corp., St. Paul, USA). It was found that very few particles in mass below 100 nm were generated. The mass median aerodynamic diameters (MMADs) obtained by the MOUDI were 4.45 and
4.01 m for TiO2 and ZnO, respectively. So far, few attempts have been made in establishing
a practical relationship between measured dustiness and actual dust exposure at the work site (Heitbrink et al., 1990; Brouwer et al., 2006) It would be very valuable to conduct the dustiness tests using the actual nanopowders handled in the workplaces, and relate the dustiness test results to the field data for the particle number and mass distributions.
1.4 Objectives of this study
distributions, and chemical compositions at different nanopowder manufacturing or handling processes. (2) to relate the field exposure data to the results of dustiness test of nanopowders in the laboratory.
CHAPTER 2 MATERIALS AND METHODS
In this study, three different workplaces were selected, including a mixing area of the
epoxy molding compound plant for nano-SiO2 and two bagging areas of the nano-CB and
nano-CaCO3 manufacturing plants. NP number distributions were measured in real time,
while each workplace was tested for 3 times, particle mass distribution and respirable mass concentrations were measured for 6-8 hours. After sampling, samples were analyzed for chemical compositions concentration of NPs to determine the actual engineered nanoparticle (ENP) exposure concentration in these workplaces. Dustiness tests were conducted using the rotating drum and a SSPD (Model 3433, TSI Inc., MN, USA) system in the laboratory to
compare the dustiness of different powders; nano-SiO2, nano-carbon black (nano-CB) and
nano-CaCO3. Finally, the field exposure data were compared with the results of the dustiness
tests for particle number and mass concentration.
The three workplaces are shown schematically in Fig. 1 and their characteristic is shown in Table 1. To maintain confidentiality, each of the workplaces has been coded.
2.1 Sampling site description
Mixing area of the nano-SiO2 epoxy molding compound plant
The mixing area of the epoxy molding compound plant is coded as Site A, which was an enclosed space (dimensions: 14 m length × 7.4 m width × 4.2 m height) with limited general ventilation by using only an air conditioner as shown in Fig. 1(a). The main process was
feeding raw materials such as coarse SiO2 and fumed silica (nano-SiO2) and epoxy resin into
a ball grinder for mixing then into the epoxy molding compound. The feeding weight of
coarse-SiO2, nano-SiO2 (HDK, N20) and resin per batch were 600, 40 and 120 kg,
respectively. In one day, they were 2~5 batches of feeding and mixing and each batch took almost 40-min. There were two kinds of inlets for feeding the materials into the ball mill.
while an inlet of nano-SiO2 was located next to the box. A plastic tube with a diameter of 13 cm, which was positioned near the inlet, was connected to a small baghouse for reducing
nano-SiO2 and epoxy resin emissions. There was no local ventilation control for coarse SiO2
inlet. All raw materials used in the process were delivered by an electrical forklift. Bagging area of the nano-carbon black manufacturing plant
The bagging area of the nano-CB manufacturing plant is coded as Site B as shown in Fig. 1(b). The bagging machines were equipped with local ventilation hoods and the bagging continued through 8:00~17:00 except lunch break. The weight per container bag was 600 kg, and there were about 100 bags packed on each 8-h working day. The bags were transported by diesel forklifts to the storage area. The floor was cleaned using a vacuum cleaner at the end of each working day.
Bagging area of the nano-calcium carbonate manufacturing plant
The bagging area of the calcium carbonate manufacturing plant is illustrated in Fig. 1(c).
The generated CaCO3 was bagged by the machines and the bags were transported by a
conveyor to the storage area. Bagging process continued except during lunch. The capacity of bag was 25 kg and there were about 900 bags on each 8-h working day. The local ventilation hood was used to reduce particle emission near the outlet of the bagging machine. In addition, the windows and doors at this area were closed during the process, where generation ventilation was limited.
2.2 Sampling and analytical method
Each sampling was conducted for 6-8 hours to measure particle number and mass concentrations simultaneously. Each workplace was tested for three times. The sampling devices used included four pairs of IOSH cyclone (the Institute of Occupational Safety and Health, Taiwan), two MOUDIs and a SMPS. The MOUDIs and SMPS were positioned as close to the particle emission source as possible to present the worseicase-case scenario NP
exposure, while the cyclones were placed at different locations of the workplaces for area sampling.
The MOUDIs have the cutoff aerodynamic diameter of 18, 10, 5.6, 2.5, 1.8, 1.0, 0.56, 0.32, 0.18, 0.10 m, and <0.01 m (after filter) and operated at 30 L/min. Silicone grease (KF-96-SP, Topco Technologies Corp., Taiwan) coated aluminum foils were used as the
impaction substrates from the inlet to the 9th stages to reduce solid particle bounce, and the
10th stage was removed such that only NPs were collected on the after filter. In one of the
MOUDIs, Teflon filters (Zefluor P5PJ047, Pall Corp., New York, USA) were used on the after filter for gravimetric analysis, quartz filters (Tissuqartz 2500QAT-UP, Pall Corp., New York, USA), mixed cellulose ester (MCE) filters (A500A047A, ADVANTEC MFC, Inc., Japan) or Teflon filters were used on the after stage for the chemical analysis of metal (Site C), carbon (Site B) or Si content (Site A), respectively.
Three to four pairs of IOSH cyclones operated at 1.7 L/min were positioned at each workplace for area sampling of respirable particle mass (RPM) (Tsai et al., 1999a; Tsai et al., 1999b). Similar to MOUDIs, one of the pair of IOSH cyclones was equipped with Teflon filter for determining RPM concentration at each location, while the other was equipped with different filters for different chemical species.
The SMPS system obtained particle number concentration at every 2 minutes. The diameter of the SMPS ranged from 14~673 nm when the aerosol and sheath flow rates were set at 0.3 and 3 L/min, respectively.
Before and after sampling, the aluminum substrates and Teflon filters were conditioned at 22±1 ℃ and relative humidity of 40±5 % for 24 hours. A microbalance (Model CP2P-F, Sartorius, Germany) was used to determine particle mass. The samples collected by the MCE and Teflon filters were digested by a micro oven before chemical analysis. Afterwards, MCE filters were analyzed using an inductively coupled plasma-optical emission spectrometer
(ICP-OES, OPTIMA 2100 DV, PerkinElmer, Shelton, CT, USA) based on the NIOSH 7300 protocol for elements (NIOSH, 1994). Teflon filters were analyzed by a UV-Vis spectrophotometer (Model U-3010, Hitachi, Japan) based on NIOSH 7601 protocol for silicon content. The recovery of Ca and silicon ranged from 94.2~103.1 % and 91.2~101.5 %, respectively. The method detection limit determined in this study for Ca and Si was 0.0008
and 1.04 g/m3
. In addition, quartz filter samples were analyzed by the thermal-optical reflectance (TOR) method for organic carbon (OC) and elemental carbon (EC) concentrations without gravimetric analysis based on the NIOSH 5040 protocol (NIOSH Manual of
Analytical Method 5040, available at http://www.cdc.gov/niosh/docs/2003-154/pdfs/5040f3.pdf). The quartz samples were stored in
a -18 ℃ freezer immediately after sampling. The detection limits for OC and EC in this study
were 0.018 and 0.03 g/m3
, respectively (Chen et al., 2010; Zhu et al., 2010). 2.3 Dustiness test
Nano-SiO2, nano-CB, and nano-CaCO3 powders were tested for dustiness. The test
powders were dried in an oven controlled at 105 ℃ for 2 hours prior to the tests. Dustiness test was conducted by both the rotating drum and SSPD to relate the test results to the exposure data.
Rotating drum
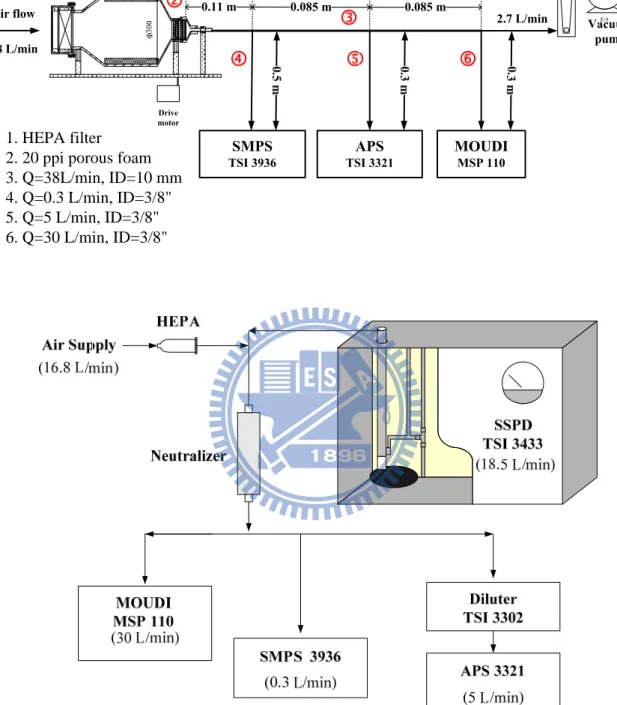
The experimental setup is similar to that described in Tsai et al. (2009) as shown in Fig. 2(a), except only 20 ppi (pores per inch) porous foam was kept in the filter holder. To avoid particle overloading in the instrument, only particles smaller than the thoracic fraction were tested by the sampling train consisted of a MOUDI, an APS and a SMPS. The dispersed particles sampled by the MOUDI for 2-min to determine mass concentration and monitored by the APS and SMPS for 30-min for the number distributions. The SMPS and APS monitored the particle concentration before the test was started until after the concentrations
reduced below 10 #/cm3 and 1 #/cm3, respectively. SSPD
The experimental setup of the SSPD system is illustrated in Fig. 2(b). The SSPD disperses powder by lifting particles from a turntable using a venturi aspirator. Shear forces created in the SSPD are sufficient to deagglomerate most dry particles in the range of 0.5~50 µm. Dispersed particles were measured by the MOUDI for 2-min for mass concentration distribution and the APS and the SMPS for 30-min for number concentration distribution. A dilutor (Aerosol Diluter, TSI Model 3302, MN, USA) was used before the APS with the dilution ratio of 100 to reduce particle concentration entering the APS.
To observe the morphology of dispersed NPs, an electrostatic particle sampler was used to collect monodispersed particles with the electrical mobility diameter of 100 nm classified by the SMPS. TEM pictures were taken by a JEOL-2100F (JEOL Ltd., Tokyo, Japan) transmission electron microscope (TEM) under an accelerating voltage of 30 kV. Particles
were collected on copper grids (PELCO○R
, 1801-F Lacey Formvar/Carbon, 200 mesh, Copper) placed in the ESP.
CHAPTER 3 RESULTS AND DISCUSSION
3.1 Respirable particle mass concentrations and mass distributionsSpatial average RPM concentrations determined by 3-4 IOSH cyclones at different
workplaces are shown in Table 2 The highest concentration of 1963±1051 g/m3
was observed at Site A, followed by Site B and Site C, whose concentration was 159±52 and
154±74 g/m3, respectively. Site A was an enclosed space with limited general ventilation,
which was much higher than the background RPM concentration of 169±116 g/m3
determined by an IOSH cyclone. Emitted particles were controlled by an ineffective local ventilation device of powders. Local ventilation utilized near the bagging machines for reducing particle emission at Site B-C seemed to be more effective than Site A, which led to much lower RPM concentrations.
The total particle mass concentrations at Site A-C are shown in Table 2, which are
4653±376, 732±373 and 935±112 g/m3
, respectively, also show much higher concentration at Site A. The mass distributions measured by the MOUDI at three workplaces are shown in Fig. 3. The MMADs of Site A-C were 4.6, 6.1 and 5.2 m with the geometric standard deviations (GSDs) of 2.4, 2.3 and 2.7, respectively. These values are closed to those in Huang et al. (2010), who found that the MMAD of particles measured near the bagging machine of
the fine TiO2 manufacturing plant was 5.89±1.04 m with the GSD of 2.43±0.48, respectively.
Thus, airborne particles at the nanopowder workplaces are supermicron rather than nano-sized, in terms of mass concentration. Previous study also found that loading and bagging of a metal-based nanomaterial were related to the RPM and total mass concentrations (Peters et al., 2009).
3.2 NP concentrations
NP concentrations at different workplaces measured by the MOUDI are shown in Table 2,
whose average was 2.8±1.4 and 1.5±0.4 g/m3
, respectively. Diesel forklifts were used at Site B which led to higher NP concentration than Site A where electrical forklifts were used and Site C where no diesel forklifts were used.
Number concentrations of each location varied with sampling time as shown in Fig. 4, where it shows number concentrations of NPs maintained near background level unless there were material handling activities or if the diesel forklifts were used in the workplaces (Site B). Fig. 5 presents normalized time-averaged particle number distributions at the workplaces, and diesel forklift exhaust obtained in this study. At Site B, a bimodal distribution was observed
which peaked at 35 and 184 nm, while Site A and C had a unimodal distribution. The 1st peak
at Site B could be resulted from the diesel forklift exhaust, since it was nearly equivalent to
the number median diameter (NMD) of the diesel forklift exhaust. The 2nd peak was from the
particle emission during bagging, as will be confirmed later by the rotating drum test results. Similar results were also found in the measurement of bag filling activities of three CB plants, NPs detected in the bag filling area were mostly attributed to non-CB source such as forklift and gas heater emissions, and the forklift engine emitted ultrafine particles in the size range of 20~50 nm (Kuhlbusch et al., 2004). NMDs measured at Site A and C are shown in Table 2, which are 85.0 and 55.5 nm with the GSDs of 2.7 and 2.8, respectively. Time-averaged
particles number concentrations (dp: 14~673 nm) were 1.1×10⁴ and 1.2×10⁴ #/cm3 for Site A
and Site C, which were near the background particle number concentration. These NMDs were similar to that of the background. Much higher time-averaged particle number
concentration of 5.2×10⁴ #/cm3 measured at Site B due to diesel forklift exhaust. Many factors
would influence the field exposure concentration such as ventilation condition, powder handling period and amount, diesel forklift exhaust, etc.
3.3 Chemical compositions
coated aluminum foils. Results are shown in Table 3. At Site A, the average SiO2
concentrations in the RPM and NPs were 904±390 g/m3 and N.D. (< 2.23 g/m3),
respectively. Feeding nano-SiO2 was controlled by the local ventilation leading to rare
nano-SiO2 collected. The mass ratio of SiO2 in the RPM was 57 %, which was due to the
agglomeration of nano-SiO2 during bagging activity. At Site B, EC and OC in nano-size range
were 4.3±1.9 and 2.4±1.7 g/m3
, respectively, the total of which accounted for 67 % of NPs.
In comparison, OC and EC in the respirable range were 39.1±15.8and 45.0±20.0 g/m3, each
of them contained approximately 25 % in the RPM. At Site C the average CaCO3
concentration in the respirable range was 66.9±44.9 g/m3
, accounting for 43 % of RPM. The
CaCO3 content in the NPs analyzed was lower than the detection limit of the ICP-OES. This
indicates that NPs collected could from infiltration of other area, probably from outside airborne NPs instead of the bagging activity.
The above chemical analyses results may support that NPs collected at these workplaces were rare except diesel forklift exhaust. Most particle emission was resulted from the agglomeration of NPs.
3.4 Dustiness Test
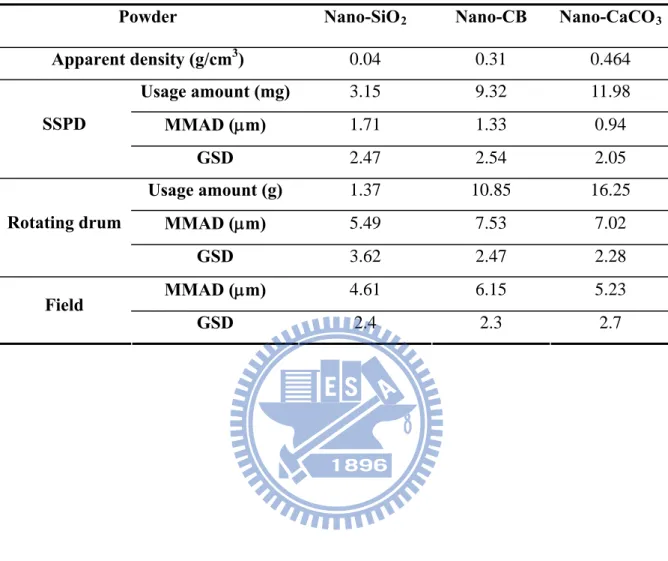
The characteristic of test powders are given in Table 4, including usage amount, apparent
density, etc. The apparent density is 0.004 g/cm3 for nano-SiO2, 0.310 g/cm3 for nano-CB, and
0.464 g/cm3 for nano-CaCO3, respectively, as determined according CEN 15051.
During the 30-min test, 10 sets of 2-min SMPS and APS data, were obtained for each powder and only the data at 2 and 30-min are illustrated in Fig. 6. It can be seen that the
number distribution of nano-SiO2, nano-CB and nano-CaCO3 decrease from the peak values
of 1954, 33820 and 26820 #/cm3 at 2-min to 1339, 14511 and 3169 #/cm3 at 30-min for the
SMPS data. For the APS data, the peak values of nano-SiO2, nano-CB and nano-CaCO3
the nano-SiO2 powder, the shape of the distribution function does not change very much with the NMD of 208 to 222 nm and the GSD of 2.09 to 2.35 for the SMPS data, and the NMAD (number median aerodynamic diameter) changes slightly from 1668 to 1757 nm and the GSD of 1.84 to 1.86 for the APS data. For the other two powders, the distribution functions also do
not alter very much, the NMDs of nano-CB and nano-CaCO3 change from 336 nm and 272
nm at 2-min to 319 nm and 276 nm at 30-min, and the GSDs were from 1.91 and 1.79 at 2-min to 1.89 and 1.78 at 30-min for the SMPS data. Similar trend of size distributions were
also found in the APS data for nano-CB and nano-CaCO3. In general, there were bimodal
particle size distributions for all test powder. Several studies have reported an overall bimodal particle size-distribution during aerosolization of various powders (Maynard et al., 2004; Schneider and Jensen, 2008; Tsai et al., 2008).
The 2-min average MOUDI mass distributions are shown in Fig. 7. It shows nano-CB
had the highest dispersed concentration with the peak value of 8.7×10⁴ g/m3, followed by
nano-SiO2 and nano-CaCO3 with 3.5×10⁴ and 3.3×10⁴ g/m3, respectively. The MMADs of
the powders dispersed by the rotating drum tester are shown in Table 4, which are 5.49, 7.53
and 7.02 m for the nano-SiO2, nano-CB and nano-CaCO3, respectively, based on the 2-min
standard test. In comparison with the field data, showed MMADs at Site A-C were 4.61, 6.15, and 5.23 m, respectively, which were slightly lower than the results of rotating drum. The reason is beacuse the distance between the field sampling location and the emission source was much longer than in dustiness test. Therefore, large MMADs in the field data is expected. Tsai et al. (2008) found that the MMADs obtained by MOUDI were 4.45 and 4.01 m for
nano-TiO2 and fine ZnO using the rotating drum with the 20 and 80 ppi porous foams.
Smaller MMADs were due to the fact that the results of the 80 ppi foam removed particles larger than 4 m leading to MMADs of almost 4 m. In addition, the NP mass concentrations of all test powders were nearly zero. This coincides with field exposure data except the source
of diesel forklift exhaust.
Particle number concentrations of more energetic SSPD system are shown in Fig. 8(a), where it shows unimodal distributions are for all tested dust. The number concentrations of all test powders were very stable during 30-min measurement. Test powders are ranked by their
dispersed concentrations per unit mass as: nano-SiO2 >nano-CB>nano-CaCO3. Number
distributions of the rotating drum test based on unit mass of nanopowder illustrated in Fig. 8(b)
are bimodal. For nano-CaCO3, it can be seen in Figs. A2 and A3 the decaying rate was more
obvious than other nanopowders during the 30-min period. The concentration of particles
dispersed by the rotating drum tester is ranked as: nano-CaCO3>nano-SiO2>nano-CB.
Because the nano-CaCO3 had the largest primary diameter and apparent density, and
gravitational settling speed of the agglomeration was the highest. For nano-SiO2 and nano-CB,
similar dispersed concentrations and number distributions per unit mass were observed.
Mass distributions of NPs per unit mass of nanopowders dispersed by the SSPD are
shown in Fig. 9(a). Test powders are ranked as: nano-CaCO3>nano-SiO2>nano-CB, similar
to the ranking in the SMPS and APS data. The MMADs of different powders fall in the range of 0.94~1.71 m as shown in Table 4, which are much smaller than the field, 4.6~6.1 m. This is due to much higher dispersion energy created in the SSPD which deagglomerate nanoparticles more effectively. Fig. 9(b) shows the mass distributions based on unit mass of nanopowders dispersed by the rotating drum. Mass concentrations of test powders were
ranked as: nano-SiO2>nano-CB>nano-CaCO3, this is which are similar to ranking in the
APS and SMPS data. The MMADs range from 7.02~8.46 m as shown in Table 4, which are only slightly larger than the field exposure data. Therefore, it can be concluded that the rotating drum method generates dispersed particle number and mass distributions similar to that observed at the field study. The more energetic SSPD system may not suitable for simulating normal powder handling scenario.
The above observations are supported by the TEM pictures as shown in Fig. 10 for
nano-SiO2, nano-CB, and nano-CaCO3 powders on the copper grids of the electrostatic
particle sampler. It can be seen that nano-SiO2 powders have an amorphous structure, while
nano-CB and nano-CaCO3 are more compact. Among these three powders, nano-CB has the
smallest primary diameter of about 20 nm, followed by nano-SiO2 and nano-CaCO3, whose
diameter was 64 and 94 nm, respectively. This is to saying that nano-sized particles indeed existed in large number during material handling processes.
CHAPTER 4 CONCLUSIONS
Based on use of IOSH cyclone, MOUDI sampling devices and SMPS, this study attempted to evaluate respirable dust and NP concentrations at three different ENP-related workplaces. Particle size distributions and chemical compositions were also measured. At the bagging areas of the nano-CB manufacturing plant, a diesel forklift was used for bag transportation leading to higher NP mass concentration than the other two workplaces where
no diesel forklifts were used. The highest RPM concentration was observed at the nano-SiO2
epoxy molding compound plant due to higher NP emission rate and ineffective ventilation system at this location. The MMADs at these workplaces were supermicron rather than nano-sized, which was also confirmed by chemical analysis of the collected particles and the results of the rotating drum testing. Number concentrations of NPs maintained near background level unless there were material handling activities or if the diesel forklifts were used in the workplaces. The TEM analysis showed that nano-sized particles indeed existed in large number. However both the field exposure data and results of rotation drum test showed that although NP number concentration was much higher than that of supermicron particles, its mass concentration was much lower due to agglomeration of NP into micron-sized particles. Therefore, it is suggested that both number and mass concentrations of nano-sized and respirable particles be considered when assessing the exposure of nanopowder-related workplaces. Number concentration measured by real-time instrument can reflect temporary variation and relate to the working scenario. In most exposure limits for chemicals are based on mass, thus it may support a reference for NP and respirable particle field exposure.
REFERENCES
Aitken, R. J., Creely, K. S., Tran, C. L., 2004, Nanoparticles: an occupational hygiene review, Edinburgh: Institute of Occupational Medicine (IOM).
Ballou, B., Lagerholm, B. C., Ernst, L. A., Bruchez, m . P., Waggoner, A. S., 2004, Noninvasive imaging of quantum dots in mice, Bioconjugate Chem., 15: 79-86.
Brouwer, D. H., Gijsbers, J. H. J., Lurvink, M. W. M., 2004, Personal exposure to ultrafine particles in the workplaces: exploring sampling techniques and strategies, Ann. Occup. Hyg., 48: 439-453.
Brouwer, D. D., Links, I. H., de Vreede, S. A., Christopher, Y., 2006, Size selective dustiness and exposure; simulated woprkplace comparisons, Ann. Occup. Hyg., 50: 455-452.
Brouwer, D., 2010, Exposure to manufactured nanoparticle in different workplaces, Toxicology, 269: 120-127.
Cagle, D. W., Kennel, S. J., Mirzaden, S., Alford, J. M., Wilson, L. J., 1999, In vivo studies of fullerence-based materials using endohedral metallfullerence radiotracers, Proc. Natl. Acad. Sci. USA, 96: 5182-5187.
CEN, 2006, EN 15051 Workplace atmospheres-measurement of the dustiness of bulk materials-requirements and test methods. Comité Européen de Normalisation, Brussels, Belgium.
Chen, S. J., Tsai, C. J., Huang, C. Y., Chen, H. D., Chen, S. J., Lin, C. C., Tsai, J. H., Chou, C. K., Lung, S. C., Huang, W. R., Roam, G. D., Wu, W. Y., Dzumbova, L., 2010, Chemical mass closure and chemical characteristics of ambient ultrafine particles and other PM fractions, Aerosol Sci. Technol., 44: 713-723.
Donalson, K., Li, X. Y., MacNee, W., 1998, Ultrafine (nanometer) particle mediated lung injury, J. Aerosol. Sci., 29(5/6): 553-560.
Heitbrink, W. A., Todd, W. F., Cooper, T. C., O’Brin, D. M., 1990, The application of dustiness tests to the prediction of worker dust exposure, Am. Ind. Hyg. Assoc. J., 51(4): 217-223.
Huang, C. H., Tai, C. Y., Huang C. Y., Tsai, C. J., Chen, C. W., Chang, C. P., Shim, T. S., 2010, Measurements of respirable dust and nanoparticle concentrations in a titanium dioxide pigment production factory, J. Environ. Sci. Health A, 45(10): 1227-1233.
Kuhlbusch, T. A. J., Neumann, S., Fissan, H., 2004, Number size distribution, mass
concentration, and particle composition of PM1, PM2.5, and PM10 in bag filling areas of
carbon black production, J. Occup. Environ. Hyg., 1: 660–671.
Mark, D., 2005, The use of reliable measurements of dustiness of chemicals in selecting the most appreciate dust control technology, IOHA, 2005 Pilanesberg; S2-3.
Maynard, A. D., Baron, P. A., Foley, M., Shvedova, A. A., Kisin, E. R., Castranova, C., 2004, Exposure to carbon nanotube material: aerosol release during handling of unrefined single-walled carbon nanotube material, J. Toxicol. Eviron. Health A, 67: 97-107.
Maynard, A. D., Kuempel, E. D., 2005, Airbrone nanostructed particles and occupational health, J. Nanopart. Res., 7: 587-614.
Methner, M., Hodson, L., Geraci, C., 2010a, Nanoparticle emission assessment technique (NEAT) for the identification and measurement of potential inhalation exposure to engineered nanomaterials-Part A, J. Occup. Eviron. Hyg., 7: 127-132.
Methner, M., Hodson, L., Danes, A., Geraci, C., 2010b, Nanoparticle emission assessment technique (NEAT) for the identification and measurement of potential inhalation exposure to engineered nanomaterials-Part B: results from 12 field studies, J. Occup. Eviron. Hyg., 7: 163-176.
Nemmar, A., Hoylaerts, M. F., Hoet, P. H. M., Nemery, B., 2004, Possible mechanisms of the cardiovascular effect of inhaled particles: system translocation and prothrombotic effects,
Toxicol. Lett., 149: 243-253.
NIOSH, NIOSH Manual of Analytical Methods 5040. Available at:
http://www.cdc.gov/niosh/nmam/pdfs/5040f3.pdf
NIOSH, 1994, Elements by ICP: Method 7300, Issue 2, NIOSH Manual of analytical methods (NMAM), Forth edition. U.S.
Oberdöster, G., Oberdöster, E., Oberdöster, J., 2005, Nanotoxicology: an emerging discipline evolving from studies of ultrafine particles, Eviron. Health Perspect., 113: 823-839.
PEN, The Project on Emerging Nanotechnologies, Available from http://www.nanotechproject.org/inventories/
Peters, T., Heitbrink, W. A., Evans, D. E., Slavin, T. J., Maynard, A. D., 2006, The mapping of fine and ultrafine particle concentrations in an engine machining and assembly plant, Ann. Occup. Eviron. Hyg., 50(3): 249-257.
Peters, T. M., Elzey, S., Johnson, R., Park, H., Grassian, V., Maher, T., O’Shaughnessy, P., 2009, Airborne monitoring to distinguish engineered nanomaterials from incidental particles for environmental health and safety, J. Occup. Environ. Hyg., 6: 73-81.
Petavatzi E., Kingman S. W., Lowndes, I. S., 2007, Assessment of the dustiness and the dust liberation mechanisms of limestone quarry operations, Chem. Eng. Process, 46: 1412-1423.
Schneider, T., Jensen, K. A., 2008, Combined single-drop and rotating drum dustiness test of fine to nanosize powders using a small drum, Ann. Occup. Hyg., 52(1): 23-34.
Schulte, P., Geraci, C., Zumwalde, R., Hoover, M., Kuempel, E., 2008, Occupational risk management of engineered nanoparticles, J. Occup. Eviron. Hyg., 5: 239-249.
The Royal Society, 2004, Nanoscience and nanotechnology opportunities and uncertainties RS policy document 19/04. London: the Royal Society and Royal Academy of Engineering.
Tielemans, E., Schneider, T., Goede, H., Tischer, M., Warren, N., Kromhout, H., Van Tongeren, M., Van Hemmen, J., Cherrie, J. W., 2008, Conceptual model for assessment of inhalation exposure: defining modifying factors, Ann. Occup. Hyg., 52: 577-586.
Tsai, C. J., Shiau, H, G., Lin, K. C., Shih, T. S., 1999a, Effect of deposited particles and particle charge on the penetration of small sampling cyclones, J. Aerosol. Sci., 30(3); 313-323.
Tsai, C. J., Shiau, H. G., Shih, T. S., 199b, Field study of the accuracy of two respirable sampling cyclones, Aerosol Sci. Technol., 31: 463-472.
Tsai, C. J., Pui, D. Y. H., 2009a, Recent advances and new challenges of occupational and environmental health of nanotechnology, J. Nanopart. Res., 11(1): 1-4.
Tsai, C. J., Wu, C. H., Leu, M. L., Chen, S. C., Huang, C. Y., Tsai, P. J., Ko, F. H., 2009b, Dustiness test of nanopowders using a standard rotating drum with a modified sampling train, J. Nanopart. Res., 11(1): 121-131.
Zhu, C. S., Chen, C. C., Cao, J. J., Tsai, C. J., Chou, C. K., Liu, S. C., Roam, G. D., 2010, Characterization of carbon fractions for atmospheric fine particles and nanoparticles in a highway tunnel, Atmos. Environ., 44: 2668-2673.
Table 1 Characteristic of the workplaces Site code Workplaces Process description General ventilation Local ventilation Incidental source A Nano-SiOmolding 2 epoxy
compound plant
Mixing of
nano-SiO2,
coarse SiO2 and
epoxy resin No Limited None B Nano-CB manufacturing plant
Bagging Yes Hood Diesel forklift exhaust C manufacturing Nano-CaCO3
plant
Table 2 Particle concentrations at the workplaces
Workplaces Nano-SiOcompound plant 2 epoxy molding manufacturing plant Nano-CB
Nano-CaCO3 manufacturing plant Total (μg/m3) 4653±376 732±373 935±112 RPM (μg/m3) 1963±1051 159±52 154±74 PM0.1 (μg/m3) 2.8±1.4 10.0±3.4 1.5±0.4 MMAD (nm) 4611±1671 6146±1700 5232±1767 GSD 2.4±0.3 2.3±0.2 2.7±0.6 NMD (nm) 85.0±32.8 183.9±65.8* 55.5±7.2 GSD 2.7±0.6 1.6±0.1* 2.8±0.3
GSD: geometric standard deviation; *Another NMD mode at 35.4±4.6 nm (GSD=2.6±0.6)
PM0.1: particle mass concentration for diameter less than 100 nm
Table 3 Chemical composition analysis at different workplaces Unit: g/m3 PM0.1 SiO2 RPM SiO2 Nano-SiO2 epoxy molding compound plant 2.8±1.4 N.D. 1963±1051 904±390 PM0.1 OC EC RPM OC EC Nano-CB manufacturing plant 10.0±3.4 2.4±1.7 4.3±1.9 159±52 39.1±15.8 45.0±20.0 PM0.1 CaCO3 RPM CaCO3 Nano-CaCO3 manufacturing plant 1.5±0.6 N.D. 154±74 66.9±44.9 N.D.: not detectable
MDL=2.23 g/m3 for SiO2, 0.18 g/m3 for OC, 0.03 g/m3 for EC, and 0.002 g/m3 for
Table 4 Comparison of different dispersion methods and field exposure data
Powder Nano-SiO2 Nano-CB Nano-CaCO3
Apparent density (g/cm3) 0.04 0.31 0.464 Usage amount (mg) 3.15 9.32 11.98 MMAD (m) 1.71 1.33 0.94 SSPD GSD 2.47 2.54 2.05 Usage amount (g) 1.37 10.85 16.25 MMAD (m) 5.49 7.53 7.02 Rotating drum GSD 3.62 2.47 2.28 MMAD (m) 4.61 6.15 5.23 Field GSD 2.4 2.3 2.7
Weighting platform SiO2storage area Control box
Coarse SiO2loading port
Epoxy storage area 2 m 2 m 11 m 1 m 7 m Nano-SiO2 loading port C M C C C: IOSH Cyclone M: MOUDI S: SMPS S 1 m 14 m 2.9 m 3.3 m (a) (b) (c)
Figure 1 Schematic diagram of the three workplaces (a) Mixing area of the nano-SiO2 epoxy molding compound plant; (b) Bagging area of the nano-CB manufacturing plant; (c) Bagging area of the nano-CaCO3 manufacturing plant
(a) Drive motor SMPS TSI 3936 APS TSI 3321 Rotating drum Air flow 38 L/min MOUDI MSP 110 0.11 m 0.085 m 0.085 m 1. HEPA filter 2. 20 ppi porous foam 3. Q=38L/min, ID=10 mm 4. Q=0.3 L/min, ID=3/8" 5. Q=5 L/min, ID=3/8" 6. Q=30 L/min, ID=3/8" E-9 Vacuum pump 2.7 L/min (b)
Figure 2 Experimental setup of dustiness test (a) standard rotating drum tester with a modified sampling train (b) SSPD
10
100
1000
10000
100000
Aerodynamic diameter (nm)
0
1000
2000
3000
4000
dM
/d
lo
gD
p (
g/
m
3)
Nano-SiO2 epoxy molding compound plant Nano-CB manufacturing plant
Nano-CaCO3 manufacturing plant
11 :09 12 :40 14 :10 15 :50 10 :10 11 :44 13 :14 14 :44 16 :14 11 :03 12 :33 14 :03 15 :33 Time 0 40000 80000 120000 160000 200000 Nu m b er c o n c en tr at io n ( # /c m 3 )
Nano-SiO2 epoxy molding compound plant
10: 14 11: 45 13: 15 14: 45 15: 35 16: 05 9: 02 10: 32 12: 02 13: 32 15: 02 Time 0 50000 100000 150000 200000 N um be r c o nc e nt ra ti o n ( # /c m 3 )
Nano-CB manufacturing plant
9: 2 7 10 :57 12 :27 13 :57 15 :27 10 :43 12 :13 13 :43 15 :13 Time 0 20000 40000 60000 N um be r c o nc e nt ra ti o n ( # /c m 3 )
Nano-CaCO3 manufacturing plant
Nano-SiO2 +Epoxy resin Coarse SiO2 Nano-SiO2 +Epoxy resin Nano-SiO2 +Epoxy resin Coarse SiO2 Coarse SiO2 Coarse SiO2 Nano-SiO2 +Epoxy resin Bagging Bagging Bagging Bagging Bagging Bagging Bagging Bagging Shut down 1st: 11:09~16:20 5/15/2009 2nd: 9:46~16:26 6/26/2009 3rd: 10:21~17:00 11/15/2009 1st: 10:14~16:18 8/27/2009 2nd: 8:44~15:48 11/6/2009 1st: 9:27~15:27 10/23/2009 2nd: 9:49~15:43 12/1/2009 Coarse SiO2
(a)
(b)
Figure 6 Particle number distributions measured by SMPS and APS for rotating drum test (a) 2-min average (b) 30-min average
(a)
(b)
Figure 8 Dispersed size distributions of different powders based on unit mass (a) SSPD (b) rotating drum
Figure 9 Dispersed mass distributions of different powders based on unit powder mass (a) SSPD (b) rotating drum
(a) Nano-SiO2 (b) Nano-CB
(c) Nano-CaCO3
APPENDIX
Spatial RPM concentration distributionsThe RPM concentration spatial distributions at different workplaces are shown in Fig. A1.
At Site A, the RPM concentration was in the range of 1534~2422 g/m3
. More closer to the
nano-SiO2 loading port, higher RPM concentration was measured. In this study, there was no
IOSH cyclone located near the coarse SiO2 loading port. The highest RPM concentration
occurred at this location was because more coarse SiO2 was fed into the ball mill. At site B
and C, the RPM concentrations ranged from 191~204 g/m3 and 87~310 g/m3
, respectively, were much lower than Site A due to more effective ventilation control. Only the left-most bagging machine of Site B and the right-most bagging machine of Site C were used during the sampling period. That’s why the RPM concentrations were the highest near these bagging machines.
Temporal number concentration variation with sampling time
The total number concentrations dispersed by the SSPD and rotating drum tester are presented in Fig. A2 (a) and (b), which show the concentration dispersed by the SSPD was more stable than the rotating drum during the 30-min period due to different mechanisms. In
the result of rotating drum, the decaying rate of nano-CaCO3 was much faster than nano-CB
and nano-SiO2 due to its higher apparent densities and larger diameter. Especially, the
apparent density of nano-SiO2 was much less than others, this could account for the
concentration was more stable, even it has a slight increasing trend.
The total number concentrations based on unit mass of powders by the SSPD and rotating drum are shown in Fig. A3(a) and (b), which show the ranking of dispersed number concentration based on unit mass of powders was similar to those without considering powder usage amount.
1500 1650 1800 1950 2100 2250 2400 C C&M&S C Diesel forklift Conveyor C: IOSH Cyclone S: SMPS M: MOUDI Bagging Machines Unit: g/m3 (b) 190 192 194 196 198 200 202 204 206 208 210 40 70 100 130 160 190 220 250 280 310
Figure A 1 Spatial RPM concentration distributions at different workplaces (a) mixing area of the nano-SiO2 epoxy molding compound plant (b) bagging area of the nano-CB manufacturing plant (c) bagging area of the nano-CaCO3 manufacturing plant
(a)
(b)
(a)
(b)
Figure A 3 Total particle number concentrations versus sampling time (a) SSPD (b) rotating drum, based on per unit mass of dispersed powders