dered titanium suboxide (Ti3O) could be formed from a solid solution of␣-Ti(O) during cooling. A fine crystalline ZrO2−x phase (O/Zr≈2) was also found along with␣-Zr near the interface on the zirconia side. The ␣-Zr was twinned with one of the twin planes being indexed as {1012}. The yttria stabilizer was excluded from zirconia as the reaction was progressing, existing as oxygen-deficient yttria. Extensive dissolution of zirconia in titanium gave rise to the formation of␣-Ti(Zr,O) solid solution. On cool-ing, lamellae of Ti2ZrO precipitated from␣-Ti(Zr,O) with an orientation relationship of {110}Ti2ZrO//{100}␣-Ti and 〈111〉Ti2ZrO//〈011〉␣-Ti.
I. Introduction
T
ITANIUMalloys have excellent properties such as highspe-cific strength and good corrosion resistance. However, they are extremely reactive to ceramics at high temperatures, result-ing in chemical reactions.1Interstitial elements (e.g., C, N, O,
H) from ceramics have a great tendency to enter into titanium alloys during casting and cause the deterioration of mechanical properties, such as ductility, hardness, and toughness.2–6
Titanium is often melted in a water-cooled copper crucible by consumable electrode vacuum arc melting instead of vacuum induction melting (VIM) because ceramic crucibles, used in the VIM process, can react with the titanium melt. However, there are many disadvantages with the arc melting process, for example, the high cost of the equipment, difficulty in temperature control, scrape recycle, alloy modification, and long cycle time. Vacuum induction skull melting of titanium castings requires chemical milling of the surfaces in order to remove the reaction products. The VIM process could be prof-itable in industry if a suprof-itable crucible material were available. Therefore, how to control the interfacial reactions between ti-tanium and ceramics is of great concern.
Extensive investigations have been done on the reactions between Ti and ZrO2, mostly by using scanning electron
mi-croscopy (SEM) and XRD analyses. The formation of oxygen-deficient zirconia gives rise to the blackening of zirconia after
Ruh2reported that up to 10 mol% of each of Zr and O could be
retained in a solid solution of Ti at temperatures ranging from 1200° to 2000°C, while the solubility of Ti in ZrO2was up to
4 at.%. Some studies10,11stated that the dissolution of oxygen
due to the interfacial reactions could increase the hardness of titanium, while the microhardness profile was primarily an in-dicator of variation in oxygen concentration. Furthermore, oxy-gen was preferably transferred from oxides to titanium, leaving behind metallic components as lower oxides in the mold. Lyon12observed that Y
2O3was reduced to Y2O2.94by molten
titanium, and a few flowerlike Y2O3 particles precipitated in
the Ti matrix.
In a previous study on the phase transformation of nonstoi-chiometric zirconia, Ruh and Garrett13 stated that a striated
intergranular ␣-Zr was precipitated during cubic–tetragonal transformation. Upon subsequent annealing below the transfor-mation temperature, this precipitate assumed a low-energy spherical shape. Ruh2also reported that metallic ZrTi(O) could
form during the interfacial reactions between titanium and zirconia.
Some previous studies discussed the effect of titanium ad-ditive on the stabilization and mechanical properties of zirco-nia.14,15 Weber et al.14 stated that the addition of titanium
(11.9–22.3 at.%) could improve the strength and thermal shock resistance of zirconia. The improved properties were attributed by Ruh et al.7to better sintering and densification. Lin et al.15
reported that the enhancement in mechanical properties was due to the partial stabilization of ZrO2in the system of (5–50
mol%) Ti/ZrO2 as well as the refinement of grain size. The
dissolution of TiO, formed by internal oxidation, could stabi-lize zirconia, while a second phase in the grain boundaries could cause a decrease in the grain size of ZrO2. At
tempera-tures above 1200°C only about 4 at.% Ti was soluble in ZrO2,
even though titanium could dissolve more than 20 wt% ZrO2
with the formation of a solid solution of␣-Ti(Zr,O). Since the titanium additive in these studies exceeded the solubility limit of titanium in zirconia, the precipitation of (Ti,Zr)3O from the
solid solution of␣-Ti(Zr,O) during cooling could be predicted by a pseudobinary diagram of Ti–ZrO2.16However, Weber et al.14and Lin et al.15reported neither (Ti,Zr)
3O nor␣-Ti(Zr,O).
The difficulties in preparing cross-sectional specimens have discouraged many investigators from analyzing the microstruc-tures of the interface between zirconia and titanium using trans-mission electron microscopy. However, the microstructure must be characterized before the reaction mechanisms are ex-plored. In the present study, we will investigate the microstruc-ture of the interface between Ti and ZrO2 using analytical
transmission electron microscopy (TEM) as well as scanning electron microscopy (SEM).
R. A. Cutler—contributing editor
Manuscript No. 190229. Received April 27, 1998; approved May 20, 1999. Supported by the National Science Council, Taiwan, under Grant No. NSC87-2216-E009-014.
*Member, American Ceramic Society.
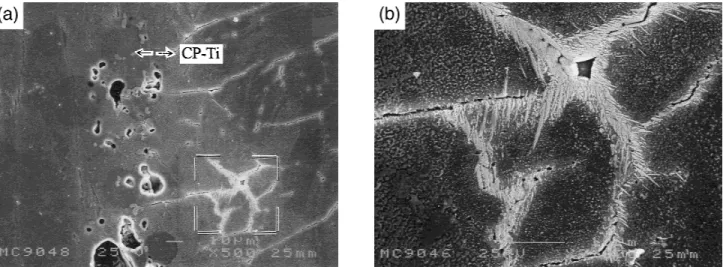
Fig. 1. (a) SEM micrograph of the cross section between titanium and 3-mol%-yttria-stabilized zirconia after reaction at 1750°C for 7 min. (b) A larger magnification of the marked region in (a) showing the featherlike phase at the grain boundaries of titanium.
Fig. 2. (a) TEM micrograph showing parallel lamellae Ti2ZrO in the matrix of␣-Ti. (b) SADP in the zone axis of [111]Ti2ZrOor [011]␣-Ti. (c) SADP in the zone axis of [221]Ti2ZrOor [012]␣-Ti. (d) EDS of Ti2ZrO. The Miller indices with a subscript␣ are for ␣-titanium, while those without any subscript are for Ti2ZrO.
1750°C, and then it was held at 1750°C for 7 min. The zirconia plate became immersed in the titanium melt above the melting temperature of titanium (1670°C), causing an extensive inter-facial reaction between the ZrO2plate and the titanium melt.
During cooling, the temperature was lowered to 1600°C at a cooling rate of 30°C/min in the furnace, to 1000°C at 50°C/ min. The specimen was then continuously cooled down to room temperature at 10°C/min. The interface of zirconia and titanium was observed by using an analytical transmission elec-tron microscope (Model JEM 2010, JEOL Ltd., Tokyo, Japan) as well as a scanning electron microscope (Model JXA 6400P, JEOL Ltd., Tokyo, Japan). Cross-sectional TEM specimens perpendicular to the interface of zirconia and titanium were prepared by standard procedures of cutting, grinding, polish-ing, and ion milling. Quantitative composition analyses were carried out based on the principle of Cliffs-Lorimer with an energy-dispersive spectrometer (EDS; Model ISIS 300, Oxford Instrument Inc., London, U.K.) attached to the transmission electron microscope.
The oxygen partial pressure of the argon protective atmo-sphere in the tungsten mesh furnace was quite low (∼10−5torr).
In addition, the zirconia plate was tightly packed in titanium powders that could scavenge the residual oxygen to further reduce the oxygen partial pressure. In the regions far away from the interface, the oxygen content of titanium was negli-gible and the zirconia was slightly reduced to ZrO1.9 after
firing. Thus, the effect of the residual oxygen content in the furnace on the interfacial reaction was very limited. In other words, the compositional and microstructural variations ob-served in the present study were mainly caused by the interfa-cial reactions between titanium and zirconia.
III. Results and Discussion
Figure 1(a) is an SEM micrograph of the cross section nor-mal to the interface of Ti /3Y-ZrO2 after reaction at 1750°C
for 7 min. Zirconia, at the left of the micrograph, was believed to be oxygen deficient and dissolved some titanium. At the right portion of this micrograph, a featherlike phase existed in the grain boundaries of titanium, being identified as one of the Ti–Zr–O compounds. Figure 1(b) displays a larger magnification of the featherlike phase. There were many pores at both sides of the Ti/ZrO2. The larger pores in ZrO2
were attributed to the Kirkendall effect, since Zr diffused to the right more rapidly than Ti diffused toward the left. The smaller pores at the grain boundaries of Ti were oxygen bubbles formed by the reduction of ZrO2. While liquid titanium could
dissolve a significant amount of oxygen, excess oxygen was likely to accumulate as bubbles along the grain boundaries of␣-Ti.
Figure 2(a) displays the lamellar structure of the featherlike phase. From the selected area diffraction patterns (SADPs)
(Figs. 2(b) and (c)) and the energy dispersive spectrum (EDS) (Fig. 2(d)), the lamellar phase was identified to be orthorhom-bic Ti2ZrO that precipitated in ␣-Ti with an orientation
rela-tionship of {110}Ti2ZrO//{100}␣-Ti and 〈111〉Ti2ZrO//〈011〉␣-Ti.
Figure 3 presents a high-resolution TEM micrograph of alternative layers of Ti2ZrO and␣-Ti. One likely scenario is
that the lamellae of Ti2ZrO precipitated and grew preferably
along the (100) plane of ␣-Ti. ZrO2 is very soluble in Ti,
allowing a solid solution of␣-Ti(Zr,O) to form.16It is likely
that Ti2ZrO precipitated as ␣-Ti(Zr,O) was cooled down to
room temperature. On the transformation of ␣-Ti(Zr,O) → Ti2ZrO, the crystal structure changed from hexagonal to
or-thorhombic. The morphology and location of the lamellar Ti2ZrO are similar to those reported previously.16
Figures 4(a) and (b) show micrographs of ␣-titanium and oxygen-deficient zirconia, respectively, which were formed by the reduction of zirconia by titanium at high temperatures. They were identified to be hexagonal and cubic, respectively, in structure by the inset SADPs. The EDS in Fig. 4(c) indicates that titanium dissolved a small amount of Zr and O, being designated as␣-Ti(Zr,O). Meanwhile, oxygen-deficient zirco-nia (ZrO1.53) dissolved 1.8 at.% Ti and retained some yttrium
(5.83 at.%) as indicated by Fig. 4(d). These results indicate that zirconia was reduced to oxygen-deficient zirconia by titanium, which was also featured by its dark gray color.2,17,18As
men-tioned in the previous section, the O/Zr ratio was compar-atively large (∼1.9) in the regions far away from the interface. This implies that the reaction between titanium and zirconia significantly lowered the O/Zr ratio (∼1.53) of zirconia in the region near the interface.
␣-Zr was found together with c-ZrO2−xnear the interface in
the zirconia side. It had a twinned structure with kinks as shown in Fig. 5(a). The corresponding SADP in Fig. 5(b) con-firms that the twin plane of␣-Zr was (1012). This is consistent with the results found in the Zr–20% Ti alloy by Banerjee and Krishnan.19The phase diagram of Zr–O displays a two-phase
region of ␣-Zr(O) and c-ZrO2−xin a wide region (32.5 at.%
O–63.5 at.% O) at 1750°C, and the solubility of␣-Zr in cubic ZrO2−x decreased with decreasing temperature.20 Therefore,
the␣-Zr(O) has a tendency to precipitate from the supersatu-rated solid solution of ZrO2−xduring cooling, and zirconia with
a higher O/Zr ratio could be obtained by the exclusion of Zr.
Fig. 4. (a) Bright-field image of␣-Ti. (b) Bright-field image of c-ZrO2−x. (c) EDS of␣-Ti. (d) EDS of c-ZrO2−x.
Fig. 7. (a) Bright-field image of YO0.55adjacent to␣-Ti. The SADPs of YO0.55viewed in (b) Z⳱ [011] and (c) Z ⳱ [001]. (d) EDS.
Figure 6(a) shows a bright-field image of nanocrystalline ZrO2
near the interface. Its SADP is shown in Fig. 6(b), the ring pattern being identified to be that of cubic zirconia. The EDS in Fig. 6(c) shows that the composition of these ZrO2−x
crys-tallites (6.95 at.% Ti, 60.83 at.% O, and 32.22 at.% Zr) corre-sponds to that of oxygen-deficient zirconia (ZrO1.9). It is
worth noting that this fine crystalline ZrO2−xphase contains no
yttrium.
The lower phase boundary of the solidus of ZrO2−xphase lies
within the composition range 1.64 < O/Zr < 1.70 from 1815° to 2065°C, and 1.925 to 2.0 at 1300°C.21,22In the present study,
the O/Zr ratio of the cubic ZrO2−xwas found to be as low as
1.53. This is not surprising because the equilibrium state was not reached after rapid cooling. While the lowest temperature for cubic oxygen-deficient zirconia is reported to be 1525°C,20
this retained cubic phase was attributed to the presence of Y. On the other hand, the fine c-ZrO2(Fig. 6(a)) is likely the result
of nonequilibrium cooling as well as the size effect.
Figure 7(a) shows that oxygen-deficient yttria (Y2O3−x)
ex-isted in the metal side. The SADPs in Figs. 7(b) and (c) confirm that it is a cubic phase. The EDS in Fig. 7(d) corresponds to oxygen-deficient yttria (YO0.55) containing 10.4 at.% Ti and
5.9 at.% Zr. As mentioned above, a significant amount of yt-tria-stabilized zirconia can be dissolved in␣-Ti. Since the solu-bility of Y2O3in␣-Ti was negligible, yttria precipitated during
cooling. Like ZrO2−x, Y2O3−xwas preferable because of
reduc-tion by titanium.
Figures 8(a) and (b) display the bright-field image of Ti3O
and the corresponding SADP, respectively. The superlattice reflections (00⭈1), (00⭈2), (11⭈1), and (11⭈2) in Fig. 8(b) indi-cate that this phase is an ordered structure of Ti3O. These
reflections showed a significant discrepancy with the model proposed by Yamaguchi,23because the superlattice reflections
of (00⭈2) (11⭈1) (11⭈2) were the fundamental spots in the model. However, these superlattice reflection spots were con-sistent with the following conditions proposed by Jostsons and Malin:24 (00⭈l)
Ti3O extinction for l ⫽ 3n, and (hh⭈l)Ti3O
extinction for l⫽ 3n. The EDS in Fig. 8(c) reveals that the ordered phase contained 75.41 at.% Ti and 24.59 at.% O, ap-proximating the composition of Ti3O. Thus, the ordered
struc-ture of Ti3O observed in this study coincided with the model
proposed by Jostsons and Malin rather than the one by Yamaguchi. These results revealed that the structure of Ti3O
was a superstructure of the Ti2O unit cell with lattice
param-eters a⬘ ⳱√3a and c⬘ ⳱ 3c instead of the parameters a⬘ ⳱√3a and c⬘ ⳱ 2c. The Ti–O phase diagram25shows that oxygen has
a large solubility in ␣-Ti at high temperatures, while the or-dered hexagonal phases Ti2O, Ti3O, and possibly Ti6O are
formed within an extended range at low temperatures. In this study, the titanium reacted with zirconia and became␣-Ti(O) as a result of interfacial reactions. However, only Ti3O was
transformed from␣-Ti(O) during cooling.
IV. Conclusions
The interfacial reactions between zirconia and titanium were investigated using analytical TEM and SEM. At high temperatures, zirconia could be extensively dissolved into the titanium melt. During cooling, the lamellae of Ti2ZrO
precipitated in ␣-Ti with an orientation relationship of {110}Ti2ZrO//{100}␣-Ti and 〈111〉Ti2ZrO//〈011〉␣-Ti. In the
ce-ramic side, zirconia was reduced by titanium, resulting in oxy-gen-deficient oxygen zirconia with O/Zr as low as 1.53. A twinned␣-Zr as well as a fine crystalline ZrO2−xphase (O/Zr ≈ 2) was also found near the interface in the ceramic side. Evolution of oxygen entailed the reduction of zirconia. Part of the evolved oxygen was formed as bubbles and the remainder was dissolved in the melt to form␣-Ti(O) solid solution. An ordered titanium sub-oxide (Ti3O) resulted from the ␣-Ti(O)
solid solution. The stabilizer yttria was extracted from yttria-partially-stabilized zirconia and reduced to oxygen-deficient yttria by titanium.
References
1R. L. Saha and K. T. Jacob, “Casting of Titanium and Its Alloys,” Def. Sci. J., 36 [2] 121–41 (1986).
2R. Ruh, “Reaction of Zirconia and Titanium at Elevated Temperatures,” J. Am. Ceram. Sco., 46 [7] 301–306 (1963).
3M. J. Donachie, Titanium: A Technical Guide; Ch. 11, p. 162. ASM
Inter-national, Metals Park, OH, 1988.
4G. Welsch and W. Bunk, “Deformation Modes of the Alpha-Phase of
Ti-6A1-4V as a Function of Oxygen Concentration and Aging Temperature,”
Metall. Trans. A, 13A [5] 889–99 (1982).
5K. I. Suzuki, S. Watakabe, and K. Nishikawa, “Stability of Refractory
Ox-ides for Mold Material of Ti-6A1-4V Alloy Precision Casting,” J. Jpn. Inst.
Met., 60 [8] 734–43 (1996).
6A. I. Kahveci and G. E. Welsch, “Effect of Oxygen on the Hardness and
Alpha/Beta Phase Ratio of Ti-6A1-4V Alloy,” Scr. Metall., 20 [9] 1287–90 (1986).
7R. Ruh, N. M. Tallan, and H. A. Lipsitt, “Effect of Metal Additions on the
Microstructure of Zirconia,” J. Am. Ceram. Soc., 47 [12] 632–35 (1964).
8G. Economos and W. D. Kingery, “Metal–Ceramic Interactions: II,
Metal-Oxide Interfacial Reactions at Elevated Temperatures,” J. Am. Ceram. Soc., 36 [12] 403–409 (1953).
9B. C. Weber, W. M. Thompson, H. O. Bielstein, and M. A. Schwartz,
“Ce-ramic Crucible for Melting Titanium,” J. Am. Ceram. Soc., 40 [11] 363–73 (1957).
10R. L. Saha, T. K. Nandy, R. D. K. Misra, and K. T. Jacob, “On the
Evalu-ation of Stability of Rare Earth Oxides Face Coats for Investment Casting of Titanium,” Metall. Trans., 21B [6] 559–66 (1990).
11R. L. Saha, T. K. Nandy, R. D. K. Misra, and K. T. Jacob, “On the
Evalu-ation of the Reactivity of Titanium with Mould Materials during Casting,” Bull.
Mater. Sci., 12 [5] 481–93 (1989).
12S. R. Lyon, S. Inouye, C. A. Alexander, and D. E. Niesz, “The Interaction
of Titanium with Refractory Oxides”; pp. 271–84 in Titanium Science and
Technology, Vol. 1. Edited by R. I. Burte and H. M. Burte. Plenum Press. New
York, 1978.
13R. Ruh and H. J. Garrett, “Nonstoichiometry of ZrO
2and Its Relation to
Tetragonal–Cubic Inversion in ZrO2,” J. Am. Ceram. Soc., 50 [5] 257–61
(1967).
14B. C. Weber, H. J. Garrett, F. A. Mauer, and M. A. Schwartz,
“Observa-tions on the Stabilization of Zirconia,” J. Am. Ceram. Soc., 39 [6] 197–207 (1956).
![Fig. 5. (a) Bright-field image of microtwinned ␣-Zr(O). (b) SADP, Z ⳱ [2201]. The Miller indices with a subscript T are for the twins.](https://thumb-ap.123doks.com/thumbv2/9libinfo/7970211.158504/4.918.151.765.748.1114/bright-field-image-microtwinned-sadp-miller-indices-subscript.webp)
![Fig. 7. (a) Bright-field image of YO 0.55 adjacent to ␣-Ti. The SADPs of YO 0.55 viewed in (b) Z ⳱ [011] and (c) Z ⳱ [001]](https://thumb-ap.123doks.com/thumbv2/9libinfo/7970211.158504/5.918.90.830.68.356/fig-bright-field-image-yo-adjacent-sadps-viewed.webp)
![Fig. 8. (a) Bright-field image of Ti 3 O. (b) SADP, Z ⳱ [1100]. (c) EDS.](https://thumb-ap.123doks.com/thumbv2/9libinfo/7970211.158504/6.918.90.825.66.323/fig-bright-field-image-ti-o-sadp-eds.webp)
