行動服務價值之研究--"價值限制"架構之驗證 - 政大學術集成
60
0
0
全文
(2) Realizing the Value of Mobile Services — The Verification of “Limit-to-Value” Framework ABSTRACT The development of mobile services in the exhibition industry has become a popular issue in a mature internet environment. To successfully implement mobile services in the exhibition industry, exhibitors must be adequately involved in the unprecedented innovation activities. However, for exhibitors to buy into the service, it is essential for them to perceive the value of the service and actually achieve that level of value. With this in mind, this research aims to explore the value of mobile service investment and related value barriers from the perspective of exhibitors. We use the limit-to-value framework to examine the valuation process for mobile services in the context of the exhibition industry and focus on exhibitors in particular. This study can help us to understand the critical value-discounting factors and the valuation process for exhibitors as they consider adopting and using innovative mobile services in the exhibition industry.. 立. 政 治 大. ‧. ‧ 國. 學. n. al. er. io. sit. y. Nat. Keywords: Mobile Service, Potential Value, Realized Value, Valuation Barriers, Conversion Barriers. Ch. engchi. i n U. v.
(3) CONTENT CONTENT ..................................................................................................................... i TABLES & FIGURES ............................................................................................... iii CHAPTER 1: INTRODUCTION............................................................................... 1 CHAPTER 2: LITERATURE REVIEW ................................................................ 4 2.1 Valuation Process............................................................................................. 4 2.2 Conversion Process .......................................................................................... 5 2.2.1 Resource barriers .................................................................................. 6 2.2.2 Knowledge barriers ............................................................................... 8 2.2.3 Usage barriers ..................................................................................... 10. 政 治 大. CHAPTER 3: RESEARCH MODEL AND HYPOTHESES ................................. 16 3.1 Value of Mobile Services............................................................................... 17 3.2 Valuation Barriers with Mobile Services....................................................... 18 3.2.1 Industry barriers .................................................................................. 18 3.2.2 Organizational barriers........................................................................ 20 3.3 Conversion Barriers with Mobile Service...................................................... 21 3.3.1 Resource barriers ................................................................................ 22 3.3.2 Knowledge barriers ............................................................................. 23 3.3.3 Usage barriers ..................................................................................... 24. 立. ‧. ‧ 國. 學. sit. y. Nat. n. al. er. io. CHAPTER 4: RESEARCH METHODOLOGY .................................................... 25 4.1 Research Method ........................................................................................... 25 4.2 Industry and Case Background: Orbi Service................................................ 26 4.2.1 The MICE Industry ............................................................................. 26 4.2.2 Orbi service ......................................................................................... 26 4.3 Measurement .................................................................................................. 27 4.4 Data Collection .............................................................................................. 29 4.5 Measurement Model Analysis and Results .................................................... 31. Ch. engchi. i n U. v. CHAPTER 5: RESULTS AND DISCUSSION ........................................................ 35 5.1 Structure Model Analysis ............................................................................... 35 5.2 Findings.......................................................................................................... 38 CHAPTER 6: CONCLUSION.................................................................................. 43 6.1 Summary ........................................................................................................ 43 6.2 Contribution ................................................................................................... 43 6.3 Limitations and Implications of Future Research .......................................... 44 REFERENCE ............................................................................................................. 45 i.
(4) Appendix A: Complete Questionnaire for the mobile service “Orbi” before the exhibition (English Version) ...................................................................................... 54 Appendix B: Complete Questionnaire for the mobile service “Orbi” in the exhibition (English Version) ...................................................................................... 55. 立. 政 治 大. ‧. ‧ 國. 學. n. er. io. sit. y. Nat. al. Ch. engchi. ii. i n U. v.
(5) TABLES & FIGURES Figure 2-1 The Limits to Value for IT Investments Framework ............................... 4 Table 2-1 The Literatures of Valuation Barriers....................................................... 12 Table 2-2 The Literatures of Conversion Barriers ................................................... 14 Figure 3-1 Research Framework .............................................................................. 17 Figure 4-1 The research road map ........................................................................... 25 Table 4-1 The Orbi service ....................................................................................... 26. 政 治 大. Table 4-2 Measurement of constructs ...................................................................... 26. 立. Table 4-3 Characteristics of the Study Sample ......................................................... 30. ‧ 國. 學. Table 4-4 Item Reliability Analysis ......................................................................... 31 Table 4-5 Factor Structure Matrix of Loadings and Cross-Loadings……...………33. ‧. Table 4-6 Correlation Matrix…...………………………………………….………34. Nat. sit. y. Table 5-1 Valuation Barriers’ Item, loadings and t-value Analysis……………..…36. n. al. er. io. Table 5-2 Testing of Hypotheses…………………………...….………….………36. Ch. engchi. iii. i n U. v.
(6) CHAPTER 1: INTRODUCTION Advances in computing and wireless telecommunications networks have enabled anytime, anywhere access to mobile services on a grand scale through a multitude of mobile devices (e.g., cellular phones, hand-held or palm-sized computers, or vehicle-mounted interfaces) (Lyytinen and Yoo, 2002; Wang et al., 2006). The potential for mobile services to create business value has been widely recognized by researchers and practitioners. For example, Siau (2001) has pointed out that mobile services provide users with the ability to access the internet from any location at any time, pinpoint an individual mobile terminal user's location, access information at the point of need, and update data/information as needed. The Wireless World Research Forum (WWRF), in its “Book of Visions” on the future of wireless networks, has stated that a champion mobile service should be one that can create and maintain emotional impact and pleasant experiences for users (WWRF, 2000, p. 9) (Pedersen et al., 2002). Thus, mobile services such as banking, content downloads, emergency/roadside assistance, and wireless coupons are potential winners in the mobile marketplace that reinforce relationships with key customers through their delivery of value-added, interactive, and location-based services (Wang et al., 2006). However, mobile services and mobile devices are not equally popular, just as the popularity of wired e-commerce cannot be assessed according to the popularity of computers, as has previously been proven (Anckar and D’Incau, 2002). Gartner did a large-scale global survey of several thousand subscribers in 2007, asking what mobile services they used and the results show that fewer than 10 percent of people in Western Europe have used mobile services and that the number of people planning to try these services in the next year (2008) is only a few percent.. 立. 政 治 大. ‧. ‧ 國. 學. n. er. io. sit. y. Nat. al. Ch. engchi. i n U. v. The low adoption rate reflects that users may not fully understand the value of mobile services. Brand-new mobile services have features such as ubiquity, personalization, flexibility, and dissemination, challenging people’s old habits, which are difficult to break (Jessup and Robey, 2002). Thus, as use patterns change, new demands and expectations emerge that cause uncertainty about what people value and are willing to pay for (Tilson et al., 2004). In addition, value cannot be realized without mass adoption; even the best-designed mobile service business model will soon be defeated if it is not widely successful (Anckar and D’Incau, 2002; Pedersen et al., 2002; Pedersen and Ling, 2003). Some researchers have isolated important factors in the adoption of mobile services. For example, Kleijnen et al. (2004) indicate that complexity, ease of use, and compatibility are positively related to the adoption of mobile services. Bouwman and Carlsson (2007) suggest that physical, cognitive, and 1.
(7) economic barriers have a negative effect on the actual use of mobile services. These findings remind us that notwithstanding the many efforts aimed at developing better and more efficient mobile service systems, these systems either have been ignored by consumers or are seriously underused if firms do not take into consideration crucial barriers that can diminish or erode the value of mobile services (Wang et al., 2006). Therefore, understanding how the value of mobile service can be communicated and identifying the value-discounting factors that affect consumer intention to use mobile services are indeed pressing issues. Past researchers have attempted to resolve similar issues in the field of IT in general. Firms are always considering how to improve their efficiency and effectiveness and even gain competitive advantage via the mobile services that they introduce, but few firms actually have the time or the motivation to reflect on innovative technologies. If firms today can evaluate the value of mobile services more accurately, they can make better decisions. Given this information, how can firms determine the ‘right’ value on IT investment to focus? In 2000, Davern and Kauffman (2000) distinguished between two types of IT value, potential value and realized value, by analyzing decision support systems. Potential value represents the maximum value opportunity available to the investor if IT is implemented successfully, and realized value is the measurable value that can be identified after implementation. The model was extended by Chircu and Kauffman (2000) to show that each factor is subject to different influences that diminish the benefits of the investment. They have defined the “limit-to-value” framework as the valuation and conversion processes that are affected by a series of specific value-discounting factors called valuation barriers and conversion barriers. That is to say, there are a number of value flow barriers that affect the assessment of the potential value of IT and its conversion into realized value. This framework enables subsequent researchers to explain why not all value flows can be realized after the implementation of IT.. 立. 政 治 大. ‧. ‧ 國. 學. n. er. io. sit. y. Nat. al. Ch. engchi. i n U. v. While the past literature on the performance of mobile services has focused on either adoption or post-adoption issues, few studies address the value flow through both stages, and therefore, the research that has been done has been unsuccessful in capturing the real value of the service. Although the limit-to-value framework provides a useful methodology for assessing value, there have been no empirical studies done so far. Therefore, our research goal is to use a limit-to-value framework to evaluate the value of mobile services. The framework will be further validated using an empirical study of an innovative mobile service in the Taiwanese exhibition industry. To be more specific, our research questions are as follows: 2.
(8) 1.. What critical factors will alter the perceived value of mobile service for exhibitors? What type of factors will decrease the realized value?. 2.. What are the valuation barriers and conversion barriers that influence mobile service value before and after the introduction of such services?. 立. 政 治 大. ‧. ‧ 國. 學. n. er. io. sit. y. Nat. al. Ch. engchi. 3. i n U. v.
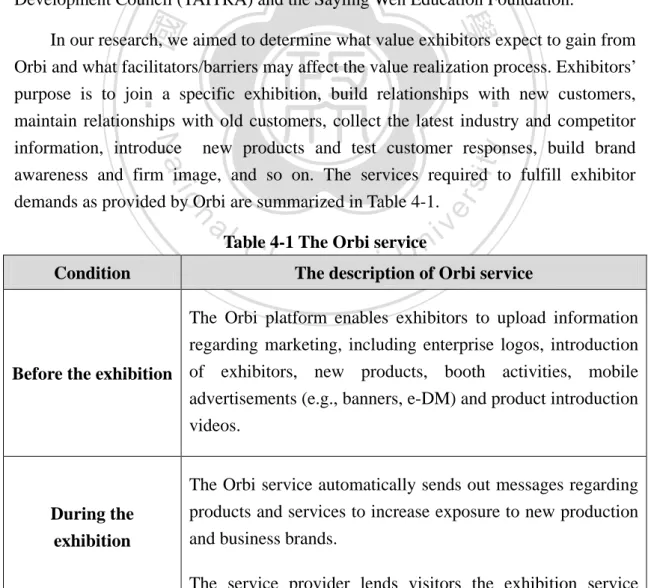
(9) CHAPTER 2: LITERATURE REVIEW To prevent incorrect estimates of IT investment value, Chircu and Kauffman (2000) have suggested that managers need to identify from the start the maximum value that they can obtain and what factors can diminish or erode that value. They propose the limit-to-value framework to explain how the general value flows to become realized value. According to the Limit to Value Framework (Figure 2-1), for any type of IT investment, there are a number of sources of value that are general and can be applied to any company in any industry.. 立. 政 治 大. ‧. ‧ 國. 學. The Limits to Value for IT Investments Framework (Source: Chircu and Kauffman, 2000). io. sit. y. Nat. Figure2-1. n. al. er. IT value flows include all general value. Firms must realize that not all value can be captured and identify what value barriers limit this realized value. Firms have to know the valuation barriers and conversion barriers to avoid losing expectation value. Valuation barriers emerge from the assessment of the potential benefits of the IT investment. After implementation, the firm must ascertain what factors make up conversion barriers that decrease the maximum value to the realized value. There is a two-step process required to sort out how best to think about this problem. The two components involved are the valuation process and the conversion process.. Ch. engchi. i n U. v. 2.1 Valuation Process This is the process that the general value flow be applied by a specific industry and a specific organization to generate potential value. Potential value represents the maximum value opportunity available to the investor if IT is implemented successfully. During the IT valuation process, managers need to consider how specific organizational and industry characteristics generate barriers to altering the full general value potential. If firms ignore these features, as the following researchers have 4.
(10) pointed out, the potential value might be narrow during the initial stage. Numerous researchers have discussed organizational and industrial factors that affect firms’ adoption of new technologies. Thong and Yap (1995) suggest that CEO and organizational characteristics are important factors affecting IT adoption in small businesses. Flanagin (2000) proposes that social pressures are significant in innovation adoption; organizational features and perceived benefits are reasonable predictors of adopters and non-adopters and effective predictors of the likelihood of adoption for non-adopters. Chwelos, Benbasat, and Dexter (2001) point out three factors as determinants of the adoption of electronic data interchange (EDI): readiness, perceived benefits, and external pressure. Pae and Hyun (2002) find that compatibility, upgradability, and preannouncement affect network externalities and switching costs and thus have a significant effect on consumer adoption of new technologies. Patterson, Grimm, and Corsi (2003) stress that organizational and environmental factors, including organization size, decentralized organizational structure, organizational performance, supply chain strategy integration, inter-organizational factors, and environmental uncertainty, have a significant impact on the adoption of new supply chain technology. Zhu, Kraemer, and Xu (2003) believe that the TOE (technological context, organizational context, and environmental context) framework is appropriate for studying e-business adoption and technological innovations. The critical factors in their framework include technology competence, firm scope, firm size, consumer readiness, competitive pressure, and lack of trading partner readiness. Moreover, Zhu, Kraemer, Gurbaxani, and Xu (2006) develop a conceptual model and point out that open-standard IOS adoption will be positively influenced by network effects, expected benefits, and adoption costs; they find that network effects are a determinant of network adoption. Their paper also points out that adoption costs are the significant barrier to open-standard IOS adoption. Furthermore, Menor and Roth (2007) suggest that the adoption of a new service is affected by process focus, market acuity, strategy, culture, and information technology experience. Based on this past work on IT or e-business adoption, our constructs for the valuation process include 1) industry barriers such as network externalities, industry characteristics of adopting new service innovation, and competitive pressures; and 2) organizational barriers such as organization features (organization size and organization age), organizational culture, and business alignment.. 立. 政 治 大. ‧. ‧ 國. 學. n. er. io. sit. y. Nat. al. Ch. engchi. i n U. v. 2.2 Conversion Process The conversion process parallels the implementation phase. This process changes potential value into realized value, which is defined as the measurable value that can be identified after implementation. The amount of value is often diminished during 5.
(11) this process. Frequently, managers only give consideration to the potential value estimate for a system and ignore the difficulties of IT implementation that create conversion barriers (Chircu et al., 2001). Based on Chircu and Kauffman (2000), it would seem that resource barriers, knowledge barriers, and usage barriers are the major conversion barriers as discussed below.. 2.2.1 Resource barriers Based on the resource-based theory (Porter, 1981; Grant, 1991; Barney, 1991; Teece et al., 1997, Bharadwaj, 2000; Chircu and Kauffman, 2000), it emerges that resource barriers are generated by a lack of co-specialized resources such as human capital and new organizational processes. Chircu et al. (2001) also state that IT investments are often stalled by insufficient resources in areas like user training, system usability engineering, and organizational awareness of how to obtain value. Tippins and Sohi (2003) summarize these IT co-specialized resources and separate them into three types: IT knowledge, IT operations, and IT objects. We discuss them below:. 立. 政 治 大. ‧ 國. 學. (1) IT knowledge. ‧. IT knowledge, like other specific domains of knowledge, is distinguishable as a subset of the more general concept of knowledge (Capon and Glazer, 1987). Tippins and Sohi (2003) conceptualize IT knowledge as the extent to which a firm possesses a body of technical knowledge about objects such as computer-based systems. Leonard-Barton (1995) also argues that IT knowledge not only represents a deep understanding of a particular knowledge domain but also reflects an ability to export that knowledge to other dissimilar operations. Taylor (1971) defines technical knowledge as a set of principles and techniques useful in bringing about changes toward a desired end.. n. er. io. sit. y. Nat. al. Ch. engchi. i n U. v. IT knowledge is comprised of technical and managerial IT skills (Mata et al., 1995; Bharadwaj, 2000). The former refer to the know-how needed to build IT applications using the available technology and operate them to make products or provide services, while the latter is defined as the management's ability to conceive of, develop, and exploit IT applications to support and enhance other business functions. Some researchers suggest that technical and business knowledge among senior leaders is essential to innovation success (McKenney et al., 1995). In addition to IT skills, another aspect of IT knowledge is IT business expertise. Clark et al. (1997) note that IT groups’ business expertise, in combination with their IT skills, directly determines a firm’s ability to rapidly develop and deploy critical systems to create long-term competitive advantage. Even physical assets and tangible resources can easily be replicated by competitors, and the IT business expertise of the people in an 6.
(12) organization can enhance long-term advantage on the market (Bhatt and Grover, 2005). Moreover, firms that have IT groups with superior knowledge about business strategy, competition, and opportunities can continue to leverage them based on their absorptive capability (Clemons and Row, 1991). Based on the above literature, our research defines IT knowledge as a firm’s ability or know-how in the realm of technical knowledge, which can be combined with IT skills to support and enhance other business functions and improve the success of IT investment and adoption. IT knowledge is also a source of core knowledge that can increase the value of IT. Without IT knowledge, a firm cannot process the external information comprehensively to create the useful knowledge that it needs and to help form a nucleus of IT value and competitive advantage. (2) IT operations. 治 政 IT operations can be considered the methods, skills, 大 and processes required to 立 and Sohi (2003) conceptualize IT operations as the complete a focal task. Tippins ‧. ‧ 國. 學. extent to which a firm utilizes IT to manage market and customer information and also think of it as a manifestation of technical knowledge because the implementation of technical knowledge results can bring out technical operations or skills. IT operations need to consider the issue of governance, which determines how organizations are structured to establish objectives, allocate resources, and make decisions (Spanos and Lioukas, 2001). Governance has become a priority within the adoption and implementation of e-commerce (Feeny and Ives, 1990) because governance affects how well an organization manages the transition to e-commerce, the integration of e-commerce with business, and the progress of e-commerce beyond entry-level adoption (Molla and Licker, 2005).. n. er. io. sit. y. Nat. al. Ch. engchi. i n U. v. We synthesize the above research to define IT operations as the manifestation of technical knowledge and as the processes that utilize IT to accomplish a particular assignment. If a firm does not have mature IT operations, IT knowledge will become useless, and the value of IT investments will be cut down. (3) IT objects IT objects represent computer-based hardware, software, and support personnel (Tippins and Sohi, 2003). Glazer (1991) sees IT objects as enablers that are largely responsible for the current increases in information production and dissemination. As tools, technical objects are artifacts that assist in the acquisition, processing, storage, dissemination, and use of information. In addition, IT objects is equal to IT infrastructures, which are the shared information delivery base for firms and sustain 7.
(13) IT-based innovation. Thus, they are a critical firm resource (Duncan, 1995; Allen and Boynton, 1991; Hanseth et al., 1996), enabling firms to sustain IT assimilation in business activities and exploit emerging opportunities better than their competitors (Weill and Broadbent, 1998). As firms develop IT infrastructures that span entire organizations, linking key suppliers and customers, they develop elaborate rules regarding the distribution and management of hardware, software, and other support services (Ross et al., 1996). Furthermore, using these components of IT infrastructure will reduce the time and cost of building the system (Weill and Broadbent, 1998). The rich IT infrastructure will enable firms to implement the right applications at the right time, rendering the cost and value of technological innovation different for different firms (Bharadwaj, 2000). A quality IT infrastructure can provide firms with the ability to share information across different functions, innovate, and exploit business opportunities and the flexibility to respond to changes in business strategy (Weill, 2002). IT infrastructure has been described as an important organizational capability that can be an effective source of value (Bharadwaj, 2000; Weill and Broadbent, 1998; Ross et al., 1996).. 立. 政 治 大. ‧ 國. 學. ‧. In summary, according to the above literature, IT objects, like IT infrastructure, form the shared information delivery base for firms and help them to develop and sustain business activities and IT innovations. A dearth of IT objects will decrease the adoption of IT innovations and the IT value that an organization anticipates.. y. Nat. sit. n. al. er. io. Some scholars focus on organizational resources as their foundation, proposing resources related to IT and competitive advantage. Ross et al. (1996) point out that if a firm has a reusable technology base and foster a great cooperative relationship between its IT department and other inner units, it can develop powerful capabilities that will help it to operate IT and achieve its goals. When these resources are valuable, rare, and durable and protect against imitation, transferability, or substitution, they become the capabilities that will create sustained competitive advantage and thereby provide long-term advantage that will not be easily duplicated or imitated by other firms. However, while some firms achieve successful outcomes with regard to their IT endeavors, others continue to fall victim to the technology productivity paradox (Lucas, 1999). Thus, managers have to recognize the need to adopt and integrate IT competency resources; they must understand the best way to strategically position resources to ensure the greatest benefit.. Ch. engchi. i n U. v. 2.2.2 Knowledge barriers Knowledge barriers can be affected by many factors, including absorptive capacity, organization learning mechanisms, awareness, knowledge assets, strategic IT vision, 8.
(14) and so on. Awareness is one of the knowledge barriers that may affect the decision to adopt or reject innovations in firms. Awareness refers to an organization’s perception, comprehension, and projection of the benefits and risks of e-commerce (Molla and Licker, 2005), and it affects both initial e-commerce adoption and subsequent level-of-utilization decisions (Rogers, 1995; Mirchandani and Motwani, 2001; Molla and Licker, 2005). In other words, a firm with high awareness is willing to pay more attention to IT-related issues, and the firm’s absorptive capacity and learning capabilities will be plentiful enough to evaluate IT innovative investments. Likewise, IT-enabled intangibles such as knowledge assets also relate to knowledge barriers. Knowledge assets are embedded in databases and decision support systems that determine its ability to respond to environmental changes (Sabherwal and King, 1991). The relationship between organizational knowledge assets and competitive advantage is moderated by the firm management’s ability to integrate, transfer, and apply knowledge (Matusik and Hill, 1998), and absorptive capacity and organizational learning can be used to effectively manage knowledge assets to make other organizational resources more easily accessible and shareable. That is to say, knowledge barriers, meaning ineffectual efforts to use organizational co-specialized resources, can be diminished via greater absorptive capacity and organizational learning ability in dynamic environments.. 立. 政 治 大. ‧. ‧ 國. 學. n. al. er. io. sit. y. Nat. Some scholars also propose that greater absorptive capacity and organization learning can reduce knowledge barriers (Cohen and Levinthal, 1990; Attewell, 1992; Levinson and Asahi, 1995; Zahra and George, 2002). A IT investment requires employees to learn and develop know-how regarding new skills and new organizational routines as part of organizational learning (Attewell, 1992). Knowledge barriers can be addressed by acquiring and retaining related knowledge and expertise in business environments that help a firm to gain competitive success (Cohen and Levinthal, 1990; Armstrong and Sambamurthy, 1999). Furthermore, Tippins and Sohi (2003) suggest that organization learning plays a significant role in enhancing a firm's capabilities and competitive advantage. Furthermore, Bhatt and Grover (2005) argue that the intensity of organizational learning is critical because it enhances the absorptive capacity of the firm and helps it to reassess and renew its current level of competence. Moreover, the absorptive capacity that the senior leadership teams own is also quite vital because they can recognize valuable IT information, developing and applying learning as they guide IT innovation activities at their firm (Cohen and Levinthal, 1990). Thus, organization learning and absorptive capacity are both significant for a learning organization hoping to gain more critical knowledge in a dynamic environment.. Ch. engchi. 9. i n U. v.
(15) In addition, different strategic IT visions can affect the absorption of IT and business knowledge and thus reduce knowledge barriers. Schein (1992) identifies four major categories of strategic IT visions: automate, informate up, informate down, and transform. What is more, firms that possess a transformative IT vision can enhance their IT assimilation ability (Feeny et al., 1992) and view IT as a key driver or an integral element of their value proposition (Armstrong and Sambamurthy, 1999). That is to say, those firms that espouse a transformative strategic IT vision always take IT absorptive capacity and organizational learning more seriously (Armstrong and Sambamurthy, 1999). In 2002, Zahra and George (2002) summarized the work of past researchers (Lane and Lubatkin, 1998; Nahapiet and Ghoshal, 1998; Schilling, 1998; Kedia and Bhagat, 1988) who use absorptive capacity in their analyses and offered a reconceptualization of this construct, defining constructs related to absorptive capacity that show a firm’s acquisition, assimilation, transformation, and exploitation capabilities, helping to explain firm potential and realized capacity and thus facilitating the creation of differential competitive advantage based on the latter. Similarly, Ulrich (2009) also suggests that absorptive capacity involves exploratory, transformative, and exploitative learning capabilities, explaining interfirm discrepancies in profiting from external knowledge.. 立. 政 治 大. ‧. ‧ 國. 學. n. al. er. io. sit. y. Nat. Overall, absorptive capacity, which involves different organizational learning capabilities, involves utilizing knowledge to resolve knowledge barriers and create an innovative organizational environment or learning mechanisms that enhances a firm's ability to gain and sustain competitive advantage (Tsai, 2001; Zahra and George, 2002).. 2.2.3 Usage barriers. Ch. engchi. i n U. v. Even if an organization can conquer resource barriers and knowledge barriers in IT implementation, the overall success of its investment is still highly dependent on how well IT is embraced by potential adaptors (Chircu and Kauffman, 2000). The past literature also concludes that certain factors can cause a user to feel different about IT. These factors include personal characteristics, user experience, user voluntariness, relative advantage, compatibility, complexity, trialability, observability and convenience, and so on (Roger 1985, Davis et al. 1989, Moore and Benbasat 1991, Parasuraman et al., 1985; Chircu et al., 2000). Chircu et al. (2001) suggest that usage barriers are due to the usefulness and the usability of the system and the responsibilities associated with its use, which may result in hesitation on the part of users regarding the adoption of IT. Usage barriers are related to adopter perceptions, and unfavorable perceptions will result in users’ not adopting a technology (Roger 1985, Davis et al., 1989, Moore and Benbasat, 1991, Chircu and Kauffman, 2000), 10.
(16) even though they are capable of acquiring the knowledge essential to use it. Based on the previous literature, we know that there are many factors that can alter the intention to use an innovative technology. Devaraj and Kohli (2003) argue that the driver of IT impact is not the investment in the technology but instead the actual usage of that technology. Zhu and Kraemer (2005) describe value creation through use rather than simple adoption and penetration. Moving away from the typical focus on adoption, Zhu and Kraemer (2005) focus on the post-adoption stages and consider actual usage as a critical stage in the value creation process. Massetti and Zmud (1996) argue that EDI usage measurement consists of four facets: the volume, diversity, breadth, and depth of a firm's EDI initiatives. Zhu and Kraemer (2005) define e-business use as the extent to which e-business is being used to conduct value chain activities measured by the breadth of its use for different value chain activities and the depth of use percentage for each activity that has been transferred to the internet platform. Lee and Lee (2009) define different types of IT usage using three items: support for administrative, managerial, and training purposes. Overall, we can see that actual usage has often been identified as a key construct influencing the business value generated from IT (Devaraj and Kohli, 2003; Bhattacherjee and Hikmet, 2008). Therefore, our core research on usage barriers is intended to explore the degree of use of innovative IT. Thus, we focus on the usage factor itself to be our constructs of usage barriers.. 立. 政 治 大. ‧. ‧ 國. 學. n. er. io. sit. y. Nat. al. Ch. engchi. 11. i n U. v.
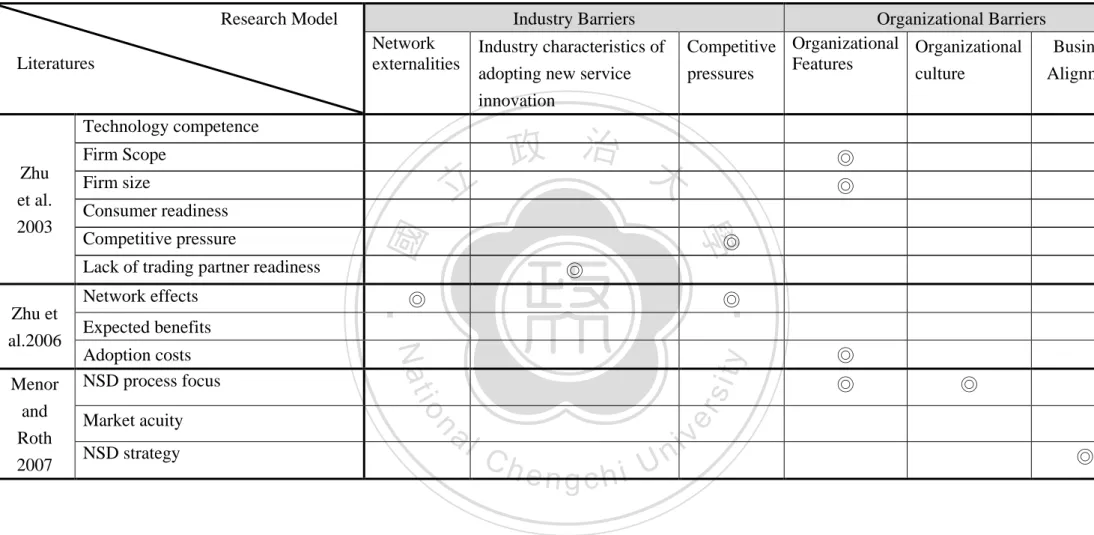
(17) Table 2-1 The Literatures of Valuation Barriers Research Model. CEO characteristics Organizational characteristics. 立 ◎. Compatibility Upgradability. ◎. Organizational Size Decentralized Organizational Structure Patterson Organizational Performance et al. Supply Chain Strategy Integration 2003 Inter-Organizational Factors. ◎. ◎. ◎. ◎. y. al. n. Preannounce. ◎ ◎. ◎. ◎. ◎. ‧. Perceived Benefits. 學. Readiness. ◎. ◎. io. Pae and Hyun 2002. Perceived benefits External Pressure. ◎. ◎. Nat. Chwelos et al. 2001. Organizational features. ‧ 國. Social pressures Flanagin 2000. 政 治 大. sit. Thong and Yap 1995. Network externalities. Organizational Barriers Industry characteristics Competitive Organizational Organizational Business Features of adopting new service pressures culture Alignment innovation. er. Literatures. Industry Barriers. Ch. engchi. i n U. v. ◎ ◎ ◎. ◎ ◎. ◎. Environmental Uncertainty. ◎ 12. ◎. ◎.
(18) Table 2-1 The Literatures of Valuation Barriers (Cont.) Research Model Network externalities. Technology competence Firm Scope Consumer readiness. ◎. al. n. NSD strategy. ◎. y. io. Market acuity. ◎. ◎. sit. Adoption costs NSD process focus. ◎ ◎. Nat. Menor and Roth 2007. Expected benefits. ◎. ‧. Network effects. 政 治 大. ‧ 國. Competitive pressure Lack of trading partner readiness. Zhu et al.2006. 立. Firm size. Industry characteristics of adopting new service innovation. 學. Zhu et al. 2003. Organizational Barriers Competitive Organizational Organizational Business Features pressures culture Alignment. ◎. ◎. er. Literatures. Industry Barriers. Ch. engchi. 13. i n U. v. ◎.
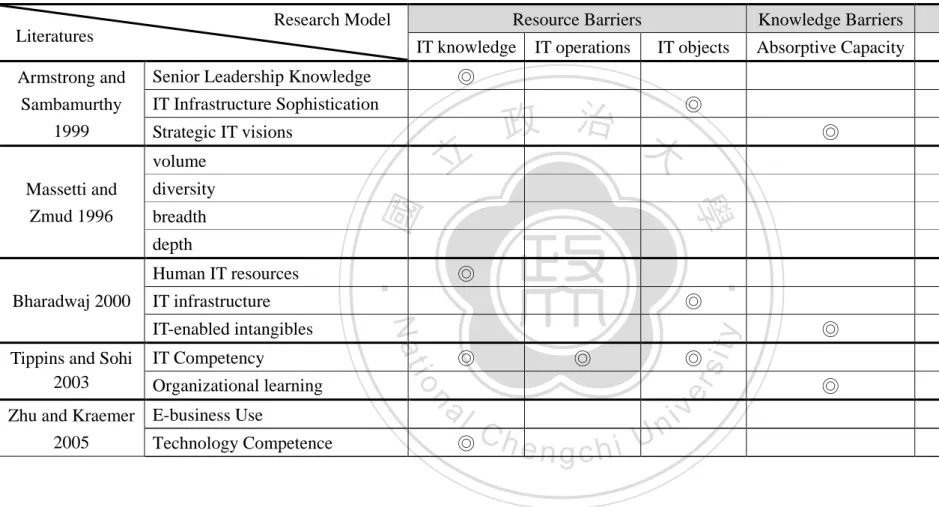
(19) Table 2-2 The Literatures of Conversion Barriers Research Model. Resource Barriers. Literatures. IT Infrastructure Sophistication Strategic IT visions. 立. diversity. IT Competency Organizational learning. ◎ ◎. al. ◎. n. Zhu and Kraemer E-business Use 2005 Technology Competence. ◎. ◎. io. Tippins and Sohi 2003. ◎ ◎ ◎. Nat. IT-enabled intangibles. ◎. y. IT infrastructure. ◎ 治 政 大. C ◎ h. engchi. 14. ◎. sit. Bharadwaj 2000. Actual Usage. ‧. Human IT resources. ‧ 國. depth. Absorptive Capacity. 學. breadth. IT objects. Usage Barriers. ◎. Senior Leadership Knowledge. volume Massetti and Zmud 1996. IT operations. ◎. er. Armstrong and Sambamurthy 1999. IT knowledge. Knowledge Barriers. i n U. v. ◎ ◎.
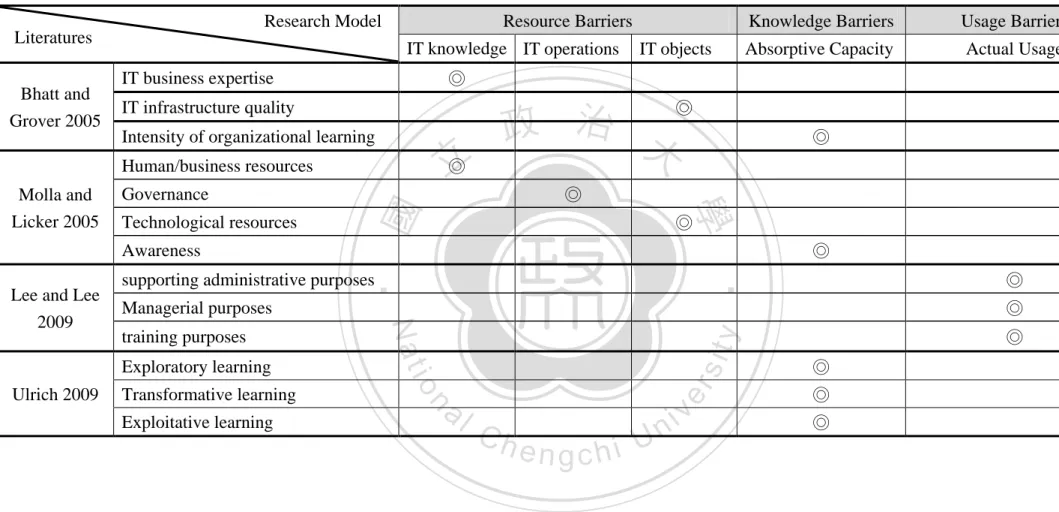
(20) Table 2-2 The Literatures of Conversion Barriers (Cont.) Research Model Literatures. IT knowledge IT operations IT infrastructure quality Intensity of organizational learning. ◎ 立. ◎. al. n. Exploitative learning. io. Transformative learning. ◎ ◎. sit. training purposes. ‧. Managerial purposes. ◎. ◎. supporting administrative purposes. Exploratory learning Ulrich 2009. ◎. Nat. Lee and Lee 2009. Actual Usage. y. Awareness. Absorptive Capacity. ◎ 治 政 大. ‧ 國. Technological resources. Usage Barriers. 學. Governance. Knowledge Barriers. ◎. IT business expertise. Human/business resources Molla and Licker 2005. IT objects. er. Bhatt and Grover 2005. Resource Barriers. Ch. engchi. 15. i n U. v. ◎ ◎ ◎ ◎.
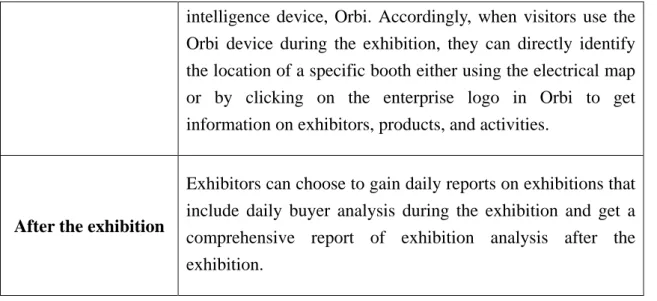
(21) CHAPTER 3: RESEARCH MODEL AND HYPOTHESES New and improved computing and telecom technology enables anytime, anywhere access to mobile services on a grand scale through a multitude of mobile devices (Mallat et al., 2008). However, there are many value uncertainty factors related to mobile service (Siau, 2003; Frolick and Chen, 2004; Tilson et al., 2004; Akesson, 2007), such as the relative novelty of mobile commerce, the complexity of mobile transactions, the perceived lack of security, a lack of user-friendly mobile portals, and the different perceptions of mobile service value held by different demand sides. Therefore, it is difficult to estimate how people act to a new mobile service (Carlsson et al., 2006; Constantinou et al., 2005; Akesson, 2007). Due to the variety of obstacles between new mobile service and people adopting behaviors, outcomes for mobile services often do not meet expectations. Thus, it is indeed important to understand value propositions and related value barriers in the context of mobile service. As a result, our research aims to explore the various aspects of value barriers for mobile service.. 立. 政 治 大. ‧ 國. 學. ‧. According to the previous research, our research framework is developed from the limit-to-value framework and works to dissect the valuation process for mobile services and the barriers that can diminish value realization, as Figure 3-1 shows. The details of this framework are described below.. n. er. io. sit. y. Nat. al. Ch. engchi. 16. i n U. v.
(22) Conversion barriers Resource Barriers .Mobile knowledge .Mobile operations .Mobile objects. Valuation barriers Industry Barriers .Network externalities .Industry characteristics of. Knowledge Barriers .Absorptive Capacity. adopting new service innovation .Competitive pressures. 政 治 Usage 大 Barriers. 立. .Actual Usage. io. al. y. H1. Realized Value of mobile service. er. Nat. H2 H3. Potential Value of mobile service. H4 H5 H6. sit. Organization Size Organization Age .Organizational culture .Business alignment. ‧. ‧ 國. 學. Organizational Barriers .Organizational Features. v. n. Figure3-1 Research Framework. Ch. 3.1 Value of Mobile Services. engchi. i n U. Chircu and Kauffman (2000) indicate that the IT value flows are general in the beginning and can be applied to any company in any industry. The general IT value flows during the valuation process can generate potential value but are always being cut down to suit a specific industry and a specific firm. That is to say, the general IT value flow is a vague and universal concept, while the potential value of IT is the expected value that the firm concerns. Based on their definition, we define the potential value of mobile services as the expected value opportunity available to the investor if the implementation process is one hundred percent successful. Numerous studies recognize the potential value of mobile service. For example, Siau et al. (2001) argue that mobile service can provide elements of value such as ubiquity, personalization, flexibility, and dissemination. Wang et al. (2006) also 17.
(23) consider the potential of mobile service to deliver value-added, interactive, and location-based services to customers and thus to provide a competitive edge in the mobile marketplace. However, not all of the mobile services can proceed smoothly without a hitch. Barriers may arise after implementation and thus reduce the degree of implementation success. Some scholars mention that without mass use, mobile services will quickly fail, even under the best-designed business model (cf. Anckar and D’Incau, 2002; Pedersen et al., 2002; Pedersen and Ling, 2003). Wang et al. (2006) argue that firms should take crucial barriers into consideration during the operation of mobile services, such as consumer acceptance. Bouwman and Carlsson (2007) also suggest three obstacles that have negative effects on the actual use of mobile services. Based on the above literature, the value of mobile services that can ultimately be realized by the firm may be different from the expected value because of the barriers that arise after mobile service has been implemented. The realized value of mobile services has significant implications for a firm to truly understand the mobile service they feel and perceive. Therefore, we define the realized value of mobile services as the real value that can be identified after mobile service implementation. According to Chircu and Kauffman (2000), this will be the result of a conversion process in which the transformation of potential value occurs.. 立. 政 治 大. ‧. ‧ 國. 學. n. al. er. io. sit. y. Nat. Based on both values and the mobile service literature, we argue that high potential value means high expected value in combination with a high level of intention to use mobile services. The firms have features that facilitate the adoption of new mobile technologies and believe that such services can provide them with benefits. With a high level of support and a strong belief in mobile services, it is expected that conversion barriers will be proactively eliminated, thus leading to high levels of realized value. We develop the hypothesis H1 on this basis:. Ch. engchi. i n U. v. H1: Potential value is positively related to the realized value of a mobile service.. 3.2 Valuation Barriers with Mobile Services 3.2.1 Industry barriers As we discussed earlier, the potential value of mobile services is the expected value that a firm creates when it has the demand to use the service to gain benefits. This value will diminish during the valuation process because of different barriers. The industry barrier is one kind of barrier. Based on the past literature, three industrial barriers are discussed in this study: network externalities, industry characteristics of adopting new service innovation and competitive pressures. 18.
(24) For some products or services, benefits to consumers depend on the number of other consumers who have purchased compatible devices (Katz and Shapiro, 1986). As Katz and Shapiro (1986) have argued, network externalities are based on the assumption that the perceived benefits often depend on the number of other consumers who purchase identical or compatible items. In the mobile market, Wang et al. (2008) consider network externalities as well-verified concepts that can significantly explain the acceptance of new technologies; they confirm the effectiveness of network externalities in bolstering the acceptance of multimedia messaging services (MMS), an innovation in the field of mobile telecommunications. Hence, we argue that network externalities affect potential users’ acceptance of new mobile service innovations before they actually use them. Once the number of other adopters who have used such mobile services on the market grows up, the potential adopters will expect a high level of value from the service. Therefore, we develop hypothesis H2a:. 立. 政 治 大. ‧ 國. 學. H2a: A lack of network externality has a negative effect on the potential value of mobile services.. ‧. At the same time, having such characteristics in adopting new service innovations is necessary to keep a firm growing. The world is moving ahead in terms of mobility, and mobile innovative investment is growing, too. Datamonitor (2009) provides an analysis of the global mobile industry, and this report shows that the global mobile phone market, which consists of all analog and digital handsets used associated with mobile telephones, generated total revenues of $101 billion in 2008, representing a compound annual growth rate (CAGR) of 12.2% for the period spanning 2004-2008. The global mobile phone market has been growing at a healthy rate over the past five years and will continue to do so during the forecast period (Datamonitor, 2009). Therefore, it seems that the widespread mobile market around the world will sustain mobile investment very well. Firms should take these innovative trends into account and work to create more powerful mobile services to facilitate market growth. Because the industry generally expects a bright future for new mobile services, such positive attitudes will help a specific firm to preserve a similar attitude and thus create high potential value for mobile services. Thus, we develop hypothesis H2b:. n. er. io. sit. y. Nat. al. Ch. engchi. i n U. v. H2b: A lack of industrial positive attitude toward adopting new service innovation has a negative effect on the potential value of mobile services.. 19.
(25) Moreover, competitive pressure has a significant influence on mobile service. Many firms mention that they will consider investing in mobile applications when their competitors and strategic partners, the source of competitive pressure, begin to experiment with new service practices (Wang and Cheung, 2004). Thus, competitive pressure can drive firms to seek the benefits of new mobile services. In other words, a lack of competitive pressure causes firms not to be able to see the value of mobile services and keeps them from moving into the realm of mobile business (Wang and Cheung, 2004). Thus, we developed hypothesis H2c: H2c: A lack of competitive pressure has a negative effect on the potential value of mobile services.. 3.2.2 Organizational barriers. 政 治 大. In this study, we discuss three different kinds of organizational barriers: organizational features (organization size and organization age), organizational culture, and business alignment.. 立. ‧ 國. 學. ‧. Firm size is one of the most important structural factors that affects a firm’s speed and pattern of adopting innovations (Damanpour, 1991; Damanpour, 1992; Yao et al., 2003). Wang and Cheung (2004) have argued that firm size has an interaction effect on the use of mobile technologies in daily firm business and that larger firms demonstrate a significantly stronger intention to adopt e-business than do smaller firms. We can derive that large firms expect that mobile innovations can preserve organizational growth, attract more customers, and increase exposure rates. Thus, hypothesis H3a is as follows:. n. er. io. sit. y. Nat. al. Ch. engchi. i n U. v. H3a: Organization size has a positive effect on the potential value of mobile services. The past literature has indicated that organization age is negatively related to the adoption of innovations (Flanagin et al., 2000). Newer organizations are born into an environment saturated with advanced communication and information technologies, and thus, they naturally rely on technologies to achieve competitive advantage (Porter, 1985). Anthony et al. (2007) also argue that new organizations must create structures involving costly learning and other set-up costs, and older organizations are less like to react to environmental change due to bureaucratization and other time-dependent processes. Because mobile services are often perceived as a new technological trend, a new channel, and a new opportunity to gain competitive advantage in the specific industry to which a particular firm belongs, we argue that the newer organizations 20.
(26) may be more inclined to use mobile services, and they may expect higher value from those mobile services than older organizations. Hypothesis H3b is as follows: H3b: Organization age has a negative effect on the potential value of mobile services. Organizational culture is also a key factor that affects a firm’s decision to invest in an innovation. Today, the new innovative market tendency is toward mobility and service orientation. Additionally, if senior managers in an organization such as the CEO recognize these market trends, they are more likely to adopt mobile services and perceive that the benefits of the service outweigh the risks. Then, the firm will be more likely to adopt the mobile service. Consequently, our hypothesis here is as follows:. 政 治 大 H3c: Organizational culture has a positive effect on the potential value of a 立 mobile service.. ‧ 國. 學. ‧. IT-business alignment can aid stakeholders in developing a clearer understanding of the goals and objectives of the project at the outset and can maximize the potential return on IT investment (Huang and Hu, 2007). Particularly now, in the information explosion age, firms take customer service seriously. If they aim to increase the productivity and efficiency of customer service representatives and enhance customer service value, the firms that want to gain competitive advantage will recognize the value of new IT innovations such as mobile service technology: they may help the firm to fulfill their need to transform an enormous amount of data into a reliable source, correct related customer information, access real-time customer information, and more. Because mobile service technology allows these firms to fulfill their business needs, the technology is more aligned with their business goals. Thus, hypothesis H3d is as follows:. n. er. io. sit. y. Nat. al. Ch. engchi. i n U. v. H3d: A lack of business alignment has a negative effect on the potential value of a mobile service.. 3.3 Conversion Barriers with Mobile Service The conversion process includes resource barriers, knowledge barriers, and usage barriers. Based on the literature review in Chapter 2, three co-specialized resources related to mobile services are mobile knowledge, mobile operations, and mobile objects. We use absorptive capacity (Zahra and George, 2002) to discuss how firms 21.
(27) can use their acquisition, assimilation, transformation, and exploitation capabilities to digest external knowledge through new mobile technology. Last, we use the perspective of actual usage to determine the usage barriers of mobile services.. 3.3.1 Resource barriers 3.3.1.1 Mobile knowledge We define mobile knowledge as the firm’s ability or know-how as necessary to improve the success of mobile service investment. Mobile knowledge is also the source of core knowledge that can increase the value of mobile technology. Mobile knowledge assets are managed by mobile knowledge management (mKM) in mobile corporate environments with the support of appropriate mobile information technologies (Zuopeng and Sajjad, 2008). The increasing mobility of the workforce and knowledge pose new challenges for organizations as they seek to effectively manage knowledge and develop more flexible modes of communication, collaboration, and information-sharing.. 立. 政 治 大. ‧ 國. 學. ‧. Thus, a firm that has mobile knowledge can access and analyze external information comprehensively on mobile devices in both knowledge-intensive and mobile environments and thereby obtain useful knowledge and mobile value anytime and anywhere. In other words, a lack of mobile knowledge means that the firm does not have the ability or know-how to handle mobile information, and this will negatively affect the realized value of a mobile service after use, even if the firm expects a high level of value from that mobile service. Therefore, we work from hypothesis H4a:. n. er. io. sit. y. Nat. al. Ch. engchi. i n U. v. H4a: A lack of mobile knowledge has a negative moderating effect on the relationship between the potential and realized value of mobile services.. 3.3.1.2 Mobile operations In addition to mobile knowledge to show the mobile type of IT knowledge resources, mobile operations are critical for IT operations with mobile issues. Slilva and Gray (2008) argue that the current mobile environment and the organizational structure as necessary to push mobility forward and achieve the benefits of mobile services will require more centralized strategy and be controlled by mobile operations today. Thus, when mobility increases in complexity, multiplying the mobile hardware, software, and services in which an organization regularly invests and that it must support, the role of mobile operations — as a subset of IT operations — will emerge as a central point of expertise and control many aspects of organizational mobility. Therefore, 22.
(28) firms have mobile operations to align all elements that are critical to ensuring that mobility continues to benefit the organization and to manage outside mobile networks. Because mobile operations can be viewed as a process controller for mobility, companies cannot realize the value of mobile services without them. Hence, we develop hypothesis H4b: H4b: A lack of mobile operations has a negative moderating effect on the relationship between the potential and realized value of mobile services.. 3.3.1.3 Mobile objects Mobile objects are made up of important IT objects that facilitate and support mobile applications, including mobile technological infrastructure, mobile handheld devices, and mobile technical support for human resources. Mobile technological infrastructure (e.g., Wireless Application Protocol (WAP), Bluetooth, 3G, and General Packet Radio Service (GPRS)) provides connectivity in the mobile world (Varshney and Vetter, 2000; Perry et al., 2001; Nah et al., 2005). Mobile handheld devices such as mobile phones and personal digital assistants (PDAs) have increased the sophistication and popularity of mobile technology and drive organizations to change the way they support mobile and remote workers (Technology Computer Weekly, 2005). Besides, mobile services cannot succeed without the mobile technical support for human resources. Therefore, even if companies expect a high level of value from mobile services, they will not be able to realize that level of value if they lack essential IT objects. Thus, hypothesis H4c is as follows:. 立. 政 治 大. ‧. ‧ 國. 學. er. io. sit. y. Nat. al. n. v i n H4c: A lack of mobile objects C hasha negative moderating e n g c h i U effect on the relationship between the potential and realized value of mobile services.. 3.3.2 Knowledge barriers Knowledge barriers spring from limited information processing capabilities on the part of employees and lacks of absorptive capacity and organization learning over time, as the related knowledge and expertise are not acquired (Cohen and Levinthal, 1990; Attewell, 1992; Asahi, 1995; Chircu and Kauffman, 2000; Zahra and George, 2002). The same principle applies to the newly mobile service market. If a firm possesses both organizational learning and innovation capabilities in this mobile era, it can decrease the knowledge barriers based on information-sharing, training and learning, facilitate the absorption of external innovative knowledge, and make organizational resources more accessible, shareable and valuable through new mobile 23.
(29) innovations. On the other hand, a firm without the above capabilities will encounter knowledge barriers that inhibit the realization of a higher value of mobile service after use and thus will have difficulty creating competitive edge in the mobile economy. That is to say, although the high potential value of mobile services can lead to a high level of realized value, a lack of organizational learning and absorptive capacity will reduce the extent to which value can be realized. Therefore, we develop hypothesis H5: H5: Knowledge barriers negatively moderate the relationship between the potential and realized value of mobile services.. 3.3.3 Usage barriers. 政 治 大. According to the previous discussion of usage, we know that actual usage has often been identified as a key construct influencing the business value generated from IT, even in mobile services. Vrechoupoulos et al. (2003) suggest that complicated use affects the realization of mobile service value. Sinisalo and Karjaluoto (2009) assert that the degree of mobile service usage is related to mobile phone capabilities including SMS, WAP, MMS, XHTML and HTML. Moreover, smartphone users exhibit more actual usage of mobile data communication. With this in mind, we argue that firms may not realize the value of mobile services if they are not appropriate for use. Thus, we develop hypothesis H6:. 立. ‧. ‧ 國. 學. io. sit. y. Nat. n. al. er. H6: A lack of actual usage has a negative moderating effect on the relationship between the potential and realized value of mobile services.. Ch. engchi. 24. i n U. v.
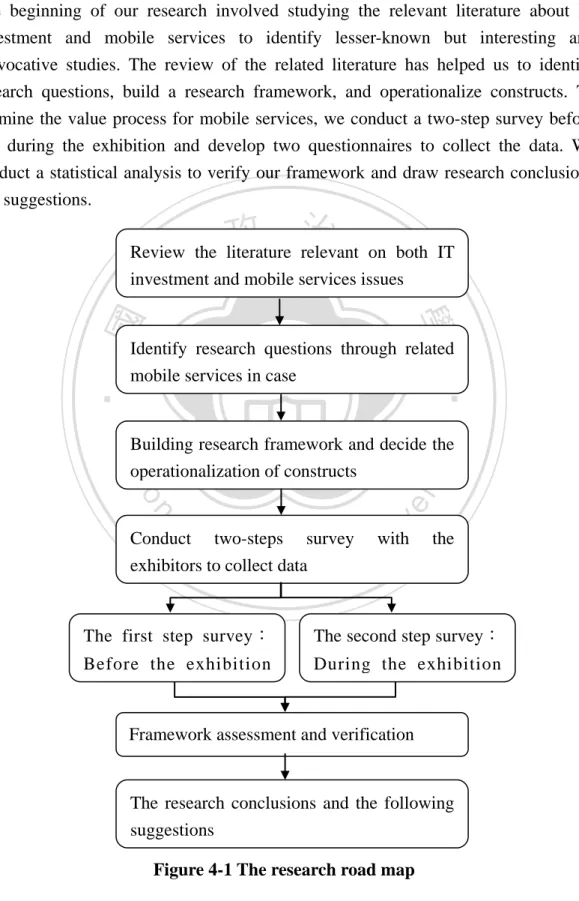
(30) CHAPTER 4: RESEARCH METHODOLOGY 4.1 Research Method The beginning of our research involved studying the relevant literature about IT investment and mobile services to identify lesser-known but interesting and provocative studies. The review of the related literature has helped us to identify research questions, build a research framework, and operationalize constructs. To examine the value process for mobile services, we conduct a two-step survey before and during the exhibition and develop two questionnaires to collect the data. We conduct a statistical analysis to verify our framework and draw research conclusions and suggestions.. 政 治 大. Review the literature relevant on both IT investment and mobile services issues. 立. ‧ 國. 學. ‧. Identify research questions through related mobile services in case. y. Nat. n. al. er. io. sit. Building research framework and decide the operationalization of constructs. Ch. Conduct two-steps survey exhibitors to collect data. engchi. i n U. v. with. the. The first step survey:. The second step survey:. Before the exhibition. During the exhibition. Framework assessment and verification. The research conclusions and the following suggestions Figure 4-1 The research road map 25.
(31) 4.2 Industry and Case Background: Orbi Service 4.2.1 The MICE Industry The MICE (Meetings, incentives, Conventions and Exhibitions) industry and mobile commerce services have recently become a more widely discussed issue in what is known as the mature internet environment. Making use of mobile services on handheld devices can offer MICE participants with real-time, relevant customer information that can create higher levels of business value and benefits for participants in the MICE industry.. 4.2.2 Orbi service Orbi is an integrated service platform that aims to offer delicate service and an intimate experience for the three participants in the MICE industry: organizers, exhibitors, and buyers. This service was developed by the Service Science Research Center at National Chengchi University and sponsored by the Taiwan External Trade Development Council (TAITRA) and the Sayling Wen Education Foundation.. 立. 政 治 大. ‧ 國. 學. ‧. In our research, we aimed to determine what value exhibitors expect to gain from Orbi and what facilitators/barriers may affect the value realization process. Exhibitors’ purpose is to join a specific exhibition, build relationships with new customers, maintain relationships with old customers, collect the latest industry and competitor information, introduce new products and test customer responses, build brand awareness and firm image, and so on. The services required to fulfill exhibitor demands as provided by Orbi are summarized in Table 4-1.. n. er. io. sit. y. Nat. al. Ch. i n U. Table 4-1 The Orbi service. Condition. v. eThe n gdescription c h i of Orbi service. The Orbi platform enables exhibitors to upload information regarding marketing, including enterprise logos, introduction Before the exhibition of exhibitors, new products, booth activities, mobile advertisements (e.g., banners, e-DM) and product introduction videos.. During the exhibition. The Orbi service automatically sends out messages regarding products and services to increase exposure to new production and business brands. The service provider lends visitors the exhibition service 26.
(32) intelligence device, Orbi. Accordingly, when visitors use the Orbi device during the exhibition, they can directly identify the location of a specific booth either using the electrical map or by clicking on the enterprise logo in Orbi to get information on exhibitors, products, and activities. Exhibitors can choose to gain daily reports on exhibitions that include daily buyer analysis during the exhibition and get a comprehensive report of exhibition analysis after the exhibition.. After the exhibition. When exhibitors use these services, they may discover the gap between their expectations and their perceptions. The potential value of the service is the maximum value that exhibitors expect before using the service, which may be affected by where and what the exhibitors are. When the exhibitors are using the service, they may not realize the expected value because there are not enough salespeople at the exhibition to handle the stream of buyers, they may lack the knowledge necessary to absorb the information that Orbi provides, or they may not have sufficient skill to use Orbi properly.. 立. 政 治 大. ‧. ‧ 國. 學. sit. y. Nat. 4.3 Measurement. n. al. er. io. The operationalization of the independent, moderating and dependent variables is shown in Table 4-2.. Ch. i n U. v. Table 4-2 Measurement of constructs. engchi. Independent Variables Components. Items. Measures of Industry Barriers. Network Externalities. NE1. The degree to which the number of participants who adopt new services can affect the value of services. (Pae and Hyun 2002). Industry Characteristics of Adopting New Service Innovation. IC1 IC2. Competitive Pressures Components. NE2. IC3 CP1 CP2 Items. The degree of industrial innovative characteristics to adopt a new service. (Patterson 2003) The degree of competitive pressure that affects the willingness to adopt a new innovative service. (Zhu 2006) The degree of attention from other companies to customer service innovations. (Flanagin 2000) Measures of Organizational Barriers 27.
(33) Organizational Features. Organizational Culture. The number of employees in the company necessary to develop mobile innovations. (Patterson et al. 2003) The age of the company to develop mobile innovations. (Patterson et al. 2003) The degree of consistency of a company’s culture in terms of customer service innovation as necessary to maintain the customer relationship. (Ruppel 2001) The degree to which a company’s culture in terms of customer service innovation improves sales growth. (Ruppel 2001) The degree of transformation of customer information to be reliable, relevant and accurate based on customer service innovation. (Thong and Yap 1995) The speed of access to customer information based on customer service innovation. (Reinartz 2004). Size Age OC1 OC2. Business Alignment. BA1 BA2. Moderating Variables Components. Items MK1. 立. MK2. The degree of technical knowledge used to develop and maintain relationship with customers via a mobile device. (Tippins and Sohi 2003). ‧. ‧ 國. 學. Mobile knowledge. 政 治 大. Measures of Resource Barriers. sit. y. Nat. io. er. MK3. aThe vto collect existing customer degree of procedures used i l n C h via mobile device. information (Tippins and Sohi 2003) U i e h n The degree of g thec procedures used to collect new customer. n MOP1 Mobile Operations MOP2 MOB1. information. (Tippins and Sohi 2003) The extent of mobile IT infrastructure development as used to support market needs. (Tippins and Sohi 2003). MOB2. The degree of mobile IT investment in human resource as used to support market needs. (Tippins and Sohi 2003). Items. Measures of Knowledge Barriers. AC1. The degree to which information acquisition is used to collect industry information. (Ulrich 2009) The degree to which information acquisition is used to keep in contact with customers and determine customer needs. (Tippins and Sohi 2003) The degree of knowledge transformation used to maintain and develop customer knowledge. (Ulrich 2009). Mobile Objects. Components. Absorptive Capacity. AC2. AC3. 28.
(34) Items. The degree of inner information exchange. (Ulrich 2009) The degree of exploitive capacity used to develop new business. (Ulrich 2009) Measures of Usage Barriers. AU1. The usefulness of the underlying mobile technology.. AU2. The intention to reuse the underlying mobile technology in the future.. AC4 AC5 Components Actual Usage. Dependent Variables Measures of Potential Value. PV 1. Improved business image. PV 2. Increased number of buyer visits. PV 3. Improved product matching. PV 4 PV 5. Improved exhibition service quality. Items. Measures of Realized Value. PV 1. Improved business image.. PV 2. Increased number of buyer visits.. PV 3. Improved product matching. PV 4 PV 6. marketing cost aReduced l C image propagation n i v Improved hengchi U Business revenue. PV 7. Awareness of market trends. PV 8. Improved exhibition service quality. PV 5. y. ‧. PV 8. n. Realized Value. 學. Awareness of market trends. io. PV 7. Nat. Components. ‧ 國. PV 6. 政 治 大 Improved image propagation 立 Business revenue Reduced marketing cost. sit. Potential Value. Items. er. Components. 4.4 Data Collection We began our research by distributing the survey using a two-step process as part of the Orbi project, working to determine how the exhibitors were evaluating the new mobile IT service. Our sample source was the exhibitors who were taking part in the Taipei International Sporting Goods Show (TaiSPO 2010) at the Nangang Exhibition Hall from April 29 to May 2, 2010. TaiSPO 2010 had 385 exhibitors, 1,715 booths, and 1,865 foreign buyers. TaiSPO 2010 was comprised of 8 categories, and the main focus was fitness equipment, including sporting goods such as skating and skiing 29.
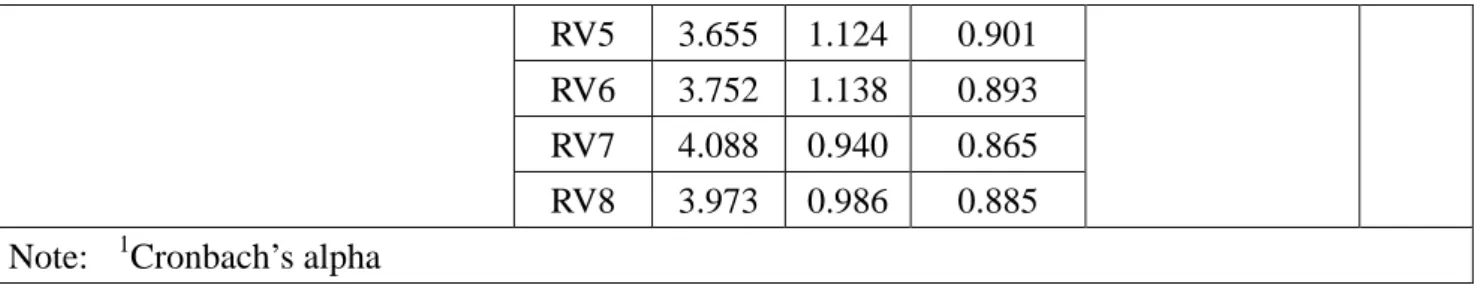
(35) equipment, sports balls and rackets, golfing products, sports apparel, and more. We sent out the questionnaires in two stages to collect the data. During the first stage, we aimed to determine the exhibitors’ expectations surrounding the Orbi service prior to the users’ (including both exhibitors’ and buyers’) exposure to the actual service. We used a web questionnaire to distribute our questions and sent out 297 questionnaires, ultimately collecting 132 questionnaires (including 8 invalid questionnaires) for a response rate of 41.41%. Basing on the first step, we focus on the exhibitors who had finished the web questionnaire and try to evaluate the Orbi service based on the exhibitors’ perceptions after the visitors had used the mobile service. As the result, we collected 124 paper questionnaires, including 11 invalid questionnaires, for a response rate of 91.1%. We use partial least squares (PLS) as our basic statistic tool to analyze the two-step questionnaires data with the aim of ascertaining the barriers that influence value.. 1-10. 11-100. 101-500. 501-1000. >=1000. 32. 50. 23. 6. 2. <=3. 4-6. 7-10. 11-20. >=21. 14. 10. 15. 35. 39. ‧. Nat. Sporting Good Categories. sit. y. Company Age. 學. Number of employees. ‧ 國. 政 治 大 Table 4-3 Characteristics of the Study Sample 立 Characteristics of Companies. fitness equipment area. io. n. al. er. Sportswear and Accessories Outdoor Sports Products Sporting Balls. Ch. Diving and Water Sport Equipment. engchi. i n U. v. 42.00% 11.71% 6.00% 5.71% 4.29%. Skating and Skiing Equipment. 2.57%. Message Products. 2.29%. Miscellaneous Products. 25.43% Position of Exhibition Staffs. Sales. 72.57%. Marketing. 5.75%. Managing Director. 11.95%. Secretary. 0.88%. Merchandiser. 1.77%. Accounting. 3.10%. Others. 3.98% 30.
(36) 4.5 Measurement Model Analysis and Results We used partial least squares (PLS), a second-generation statistical technique, to analyze the data. We chose PLS because it is the only model that can simultaneously evaluate formative and reflective constructs and because it is better for use with small samples (Chin, 1998a; Chin, 1998b). Moreover, according to Jarvis et al. (2003), the decision to model a construct as formative or reflective should be based on four major criteria: (1) the direction of causality from construct to indicators, (2) the interchangeability of the indicators, (3) co-variation among the indicators, and (4) a nomological net of construct indicators. On this basis, the constructs in our research can be considered to be reflective. The first step in our research was to evaluate the measurement properties at play. We used the loading criteria proposed by Hulland (1999). A loading of 0.707 or higher was considered desirable, whereas a loading of 0.5 or below was dropped. As one can see from Table 4-4, the loadings for all of the items were higher than 0.709.. 政 治 大. 立. ‧ 國. 學. ‧. The next step is to evaluate the convergent and discriminant validity of the data. Fornell and Larcker (1981) argue that convergent validity can be examined using Cronbach’s alpha, composite reliability, and average variance extracted (AVE), and they indicate that the AVE cannot be less than 0.5. According to George and Mallery (1999), the following rule of thumb applies in most situations: a > 0.9 as excellent, a > 0.8 as good, a > 0.7 as acceptable, a > 0.6 as questionable, a > 0.5 as poor, and a < 0.5 as unacceptable. Furthermore, based on Nunnally’s (1978) guidelines, a composite reliability score of 0.70 or above is acceptable for exploratory research, and our findings met this requirement. Our findings as introduced in Table 4-4 have AVE and composite reliability that are all above these thresholds, and the Cronbach’s alpha of all of the items except for Network Externality and IT Objects is larger than 0.8. We still chose to include these items to preserve content validity (Bollen and Leenox 1991).. n. er. io. sit. y. Nat. al. Ch. engchi. i n U. v. Table 4-4 Item Reliability Analysis Item Reliability Analysis (n=113) Items. Mean. SD. Loadings. Reliability (α)1. AVE. Network Externality. NE1. 3.732. 0.947. 0.879. NE2. 4.089. 0.780. 0.846. 0.853(α=0.648). 0.744. Industry Characteristic of Adopting New Service. IC1. 3.089. 0.901. 0.866. IC2. 3.143. 0.934. 0.927. 0.918(α=0.867). 0.789. IC3. 3.143. 0.924. 0.870. Independent Variables. Industry Barriers. 31.
(37) Innovation CP1. 3.688. 0.916. 0.915. CP2. 3.589. 0.903. 0.942. Organizational Features. SIZE. 2.178. 0.927. AGE. 3.759. Organizational Culture. OC1. Business Alignment. 0.926 (α=0.842). 0.862. 1.000. 1(n/a). 1. 1.360. 1.000. 1(n/a). 1. 3.652. 0.894. 0.927. OC2. 3.580. 0.903. 0.913. 0.917 (α=0.819). 0.847. BA1. 3.786. 0.820. 0.927. BA2. 3.893. 0.848. 0.929. 0.925 (α=0.838). 0.847. Items. Mean. SD. Loadings. Reliability (α)1. AVE. MK1. 3.212. 1.129. 0.960. MK2. 3.194. 1.124. 0.952. 0.955 (α=0.929). 0.875. 1.187 0.893 治 MOP1政2.849 1.344 0.977 大 立MOP2 2.805 1.348 0.982. 0.979 (α=0.958). 0.960. 0.803 (α=0.545). 0.679. Resource barriers. Mobile Operations. MK3. ‧ 國. Dependent Variables. Potential Value. Realized Value. 1.107. 0.920. MOB2. 3.079. 1.119. 0.709. AC1. 3.752. 1.048. 0.719. AC2. 3.725. 0.993. 0.721. AC3. 3.717. 1.081. 0.828. AC4. 3.611. 0.976. 0.839. AC5. 3.664. 0.969. 0.817. AU1. 3.205. 1.091. 0.930. a l AU2 3.152 1.032 0.935 v i n C h Mean SD U Loadings Items engchi. n. Actual Usage. 2.778. ‧. io. Usage Barriers. Absorptive Capacity. Nat. Knowledge Barriers. MOB1. 學. Mobile Objects. 3.168. PV1. 4.088. 0.940. 0.783. PV2. 3.973. 0.986. 0.872. PV3. 4.009. 0.920. 0.868. PV4. 3.912. 1.022. 0.875. PV5. 3.912. 0.911. 0.846. PV6. 3.973. 0.910. 0.774. PV7. 3.876. 0.927. 0.752. PV8. 4.000. 0.906. 0.813. RV1. 3.867. 1.129. 0.866. RV2. 3.619. 1.219. 0.866. RV3. 3.681. 1.143. 0.924. RV4. 3.575. 1.163. 0.892. 32. 0.890 (α=0.844). 0.618. 0.930 (α=0.849). 0.869. Reliability (α)1. AVE. 0.944 (α=0.933). 0.679. 0.967 (α=0.961). 0.786. y. Mobile Knowledge. sit. Moderating Variables. er. Organizational Barriers. Competitive Pressures.
(38) Note:. 1. RV5. 3.655. 1.124. 0.901. RV6. 3.752. 1.138. 0.893. RV7. 4.088. 0.940. 0.865. RV8. 3.973. 0.986. 0.885. Cronbach’s alpha. The correlation pattern listed in Table 4-5 shows that each item’s correlation with its own construct is greater than its correlation with the other constructs, which provides evidence of discriminant validity. Table 4-6 also confirms that the square root of the AVE for the defined construct is greater than its correlations with other latent constructs. The overall evidence suggests that the constructs demonstrate good measurement properties.. 政 治 大. Table 4-5 Factor Structure Matrix of Loadings and Cross-Loadings Factor Structure Matrix of Loadings and Cross-Loadings. 立. Industry Network. Characteristic of. Competitive. Features. Features. Culture. (SIZE). (AGE). (OC). Business. Potential Realized. Alignment Value. Value. (BA). (RV). 0.5412. 0.0556. 0.0376. 0.4978. 0.5225 0.3902 0.1142. 0.2073. 0.4849. -0.0582. -0.0675. 0.4678. 0.4135 0.3495 0.1282. 0.2383. 0.8659. 0.3527. -0.0085. 0.0046. 0.4147. 0.4232 0.5154 0.0979. IC2. 0.4003. 0.9273. 0.5317. 0.1106. -0.0308. 0.6148. 0.4520 0.4748 0.1046. IC3. 0.4424. 0.8697. CP1. 0.5918. 0.5413. CP2. 0.5229. 0.5025. SIZE. 0.0021. AGE. io. 0.4643. y. (PV). sit. IC1. tional. er. 0.8460. ‧ 國. NE2. tional. ‧. 0.8786. tional. Nat. NE1. Organiza- Organiza-. 學. Scale Externality Adopting New Pressures Items Service Innovation (CP) (NE) (IC). Organiza-. n. a l 0.6389 0.0805 -0.0737 i v0.6384 n 0.6456 C h 0.0188 -0.0088 0.9154 U engchi. 0.4692 0.4053 0.1014 0.4683 0.3991 0.1816. 0.9418. -0.0027. -0.0087. 0.7015. 0.5204 0.4782 0.1095. 0.0651. 0.0076. 1.0000. -0.4108. -0.0279. -0.0688 -0.0635 0.0086. -0.0140. -0.0340. -0.0094. -0.4108. 1.0000. 0.0644. 0.0060 -0.1275 0.0322. OC1. 0.5037. 0.6180. 0.7024. 0.0119. 0.0816. 0.9272. 0.5043 0.4845 0.2585. OC2. 0.5288. 0.5131. 0.6331. -0.0667. 0.0349. 0.9130. 0.5783 0.4448 0.2257. BA1. 0.5461. 0.4724. 0.4841. -0.0705. -0.0047. 0.5693. 0.9270 0.5235 0.2092. BA2. 0.4670. 0.4606. 0.5071. -0.0572. 0.0157. 0.5192. 0.9287 0.5294 0.1321. PV1. 0.3954. 0.3678. 0.3700. -0.0184. -0.1421. 0.3894. 0.4248 0.7829 0.2820. PV2. 0.3959. 0.4978. 0.4323. -0.0465. -0.2129. 0.4807. 0.4965 0.8719 0.2891. PV3. 0.4025. 0.4697. 0.4495. -0.074. -0.0665. 0.4906. 0.5338 0.8683 0.3938. PV4. 0.4021. 0.5374. 0.4766. -0.0867. -0.1453. 0.5110. 0.5110 0.8751 0.2671. PV5. 0.3661. 0.4363. 0.4187. -0.0972. -0.0478. 0.4530. 0.5478 0.8457 0.2177. 33.
數據

+7
相關文件
2.1.1 The pre-primary educator must have specialised knowledge about the characteristics of child development before they can be responsive to the needs of children, set
Reading Task 6: Genre Structure and Language Features. • Now let’s look at how language features (e.g. sentence patterns) are connected to the structure
Promote project learning, mathematical modeling, and problem-based learning to strengthen the ability to integrate and apply knowledge and skills, and make. calculated
Wang, Solving pseudomonotone variational inequalities and pseudocon- vex optimization problems using the projection neural network, IEEE Transactions on Neural Networks 17
Define instead the imaginary.. potential, magnetic field, lattice…) Dirac-BdG Hamiltonian:. with small, and matrix
This kind of algorithm has also been a powerful tool for solving many other optimization problems, including symmetric cone complementarity problems [15, 16, 20–22], symmetric
專案執 行團隊
A function f is said to be continuous on an interval if it is continuous at each interior point of the interval and one-sidedly continuous at whatever endpoints the interval
