Exploiting the image of the surface reflectivity to
measure refractive index profiling for various
optical fibers
Chun-Jen Weng,1,2 Ken-Yuh Hsu,1 and Yung-Fu Chen,3,*
1Department of Photonics & Institute of Electro-Optical Engineering, National Chiao Tung University, 1001
Ta-Hsueh Road, Hsinchu 30050, Taiwan
2Instrument Technology Research Center, National Applied Research Laboratories, Taiwan 3Department of Electrophysics, National Chiao Tung University, Taiwan
Abstract: A direct image method of surface reflectivities on a cleaved fiber end with a filtered halogen lamp and a TE-cooled CCD with high dynamic range is proposed to measure the multi-wavelength refractive index profiling (RIP). A polished black glass is used to be a reference standard for measuring the absolute reflectivity of the fiber end. With the developed calibration procedures, both the spatially dependent sensitivity and spectral responsivity of the CCD pixels can be eliminated to achieve the high spatial accuracy. Tested fiber is connected with a fiber terminator to prevent errors from the backside return light. With the present method, the RIP can be precisely measured for not only multi-mode fibers but also single-mode fibers.
©2015 Optical Society of America
OCIS codes: (060.2270) Fiber characterization; (060.2350) Fiber optics imaging; (060.2300)
Fiber measurements; (120.0120) Instrumentation, measurement, and metrology; (110.2960) Image analysis.
References and links
1. M. Young, “Optical fiber index profiles by the refracted-ray method (refracted near-field scanning),” Appl. Opt.
20(19), 3415–3422 (1981).
2. N. Gisin, R. Passy, and B. Perny, “Optical fiber characterization by simultaneous measurement of the transmitted and refracted near field,” J. Lightwave Technol. 11(11), 1875–1883 (1993).
3. N. H. Fontaine and M. Young, “Two-dimensional index profiling of fibers and waveguides,” Appl. Opt. 38(33), 6836–6844 (1999).
4. D. Marcuse and H. M. Presby, “Focusing method for nondestructive measurement of optical fiber index profiles,” Appl. Opt. 18(1), 14–22 (1979).
5. T. Iwai and S. Kobayashi, “Error analysis of optical fiber refractive-index profiling using the focusing method,” Appl. Opt. 27(11), 2344–2352 (1988).
6. W. H. Hatton, E. L. Buckland, and M. Nishimura, “Measuring the refractive-index profile of optical fibers by the cladding-mode near-field technique,” Opt. Lett. 12(9), 738–740 (1987).
7. P. L. Chu and T. Whitbread, “Nondestructive determination of refractive index profile of an optical fiber: fast Fourier transform method,” Appl. Opt. 18(7), 1117–1122 (1979).
8. A. Roberts, E. Ampem-Lassen, A. Barty, K. A. Nugent, G. W. Baxter, N. M. Dragomir, and S. T. Huntington, “Refractive-index profiling of optical fibers with axial symmetry by use of quantitative phase microscopy,” Opt. Lett. 27(23), 2061–2063 (2002).
9. N. M. Dragomir, E. Ampem-Lassen, S. T. Huntington, G. W. Baxter, A. Roberts, and P. M. Farrell, “Refractive index profiling of optical fibers using differential interference contrast microscopy,” IEEE Photon. Technol. Lett.
17(10), 2149–2151 (2005).
10. B. L. Bachim, T. K. Gaylord, and S. C. Mettler, “Refractive-index profiling of azimuthally asymmetric optical fibers by microinterferometric optical phase tomography,” Opt. Lett. 30(10), 1126–1128 (2005).
11. E. Ampem-Lassen, S. T. Huntington, N. M. Dragomir, K. A. Nugent, and A. Roberts, “Refractive index profiling of axially symmetric optical fibers: a new technique,” Opt. Express 13(9), 3277–3282 (2005). 12. E. Ampem-Lassen, F. Sidiroglou, J. L. Peng, S. T. Huntington, and A. Roberts, “Index mapping for fibres with
symmetric and asymmetric refractive index profiles,” Opt. Express 16(15), 10912–10917 (2008).
13. A. D. Yablon, “Multi-wavelength optical fiber refractive index profiling by spatially resolved Fourier transform spectroscopy,” J. Lightwave Technol. 28(4), 360–364 (2010).
14. M. Ikeda, M. Tateda, and H. Yoshikiyo, “Refractive index profile of a graded index fiber: measurement by a reflection method,” Appl. Opt. 14(4), 814–815 (1975).
15. M. Tateda, “Single-mode-fiber refractive-index profile measurement by reflection method,” Appl. Opt. 17(3), 475–478 (1978).
16. T. Wilson, J. N. Gannaway, and C. J. R. Sheppard, “Optical fibre profiling using a scanning optical microscope,” Opt. Quantum Electron. 12(4), 341–345 (1980).
17. S. T. Huntington, K. A. Nugent, A. Roberts, P. Mulvaney, and K. M. Lo, “Field characterization of a D-shaped optical fiber using scanning near-field optical microscopy,” J. Appl. Phys. 82(2), 510–513 (1997).
18. W. S. Tsai, W. S. Wang, and P. K. Wei, “Two-dimensional refractive index profiling by using differential near-field scanning optical microscopy,” Appl. Phys. Lett. 91(6), 061123 (2007).
19. Y. Youk and D. Y. Kim, “Tightly focused epimicroscope technique for submicrometer-resolved highly sensitive refractive index measurement of an optical waveguide,” Appl. Opt. 46(15), 2949–2953 (2007).
20. F.-W. Sheu and H. J. Jhang, “Capturing a reflective cross-sectional image of an optical fiber with partially coherent laser light to measure the refractive index profile of a multimode optical fiber,” Opt. Express 21(2), 2408–2413 (2013).
21. Thorlabs fiber specification sheet, http://thorlabs.com
22. D. Lorenser, X. Yang, and D. D. Sampson, “Accurate modeling and design of graded-index fiber probes for optical coherence tomography using the beam propagation method,” IEEE Photon. J. 5(2), 3900015 (2013).
1. Introduction
Various optical fibers are widely used in the communication and sensor applications. The wavelength range of fiber applications generally covers from near IR to visible range. Since the spatial dependence of refractive indices is one of the most important parameters in the transverse plane of optical fibers, the method for measuring the multi-wavelength refractive index profiling (RIP) of various optical fibers is highly demanded. Numerous methods for measuring RIP have been developed in the past, including refractive near-field [1–3], transverse focusing method [4–6], transverse interferometry [7–13], and reflection method [14–20]. Among these approaches, the reflection method is based on measuring the surface reflectivities on the fiber end to determine the refractive indices. A scanning confocal microscope [16, 19] or a scanning near-field optical microscope [17,18] with a laser or a light emitting diode (LED) is often employed to achieve the high spatial resolution and high accuracy in the measurement of RIP. However, the scanning method usually takes a relative long time for data acquisition. Recently, a direct image technique of surface reflectivities with the partially coherent laser illumination was proposed to measure RIP [20], in which a rotating diffuser was used to improve the non-uniformity and speckle noise due to the coherence of the light source. In comparison with the scanning method, the method of the direct image is a convenient and straightforward scheme. Nevertheless, the light source based on a laser or a LED is not suitable to obtain the multi-wavelength RIP. In addition, multiple lasers or LEDs are rather cumbersome in the combination of the whole system. Therefore, it will be highly desirable to develop a direct image method with a wide band lamp for precisely measuring the multi-wavelength RIP with high spatial resolution.
In this work, we use an optical microscope to develop a direct image method for measuring the surface reflectivities on the cleaved fiber end with a halogen lamp illumination to determine the multi-wavelength RIP with high spatial resolution. A TE-cooled CCD with a high dynamic range is employed to capture the image of the surface reflection on the fiber end. A polished black glass is used as a reference standard to deduce the absolute reflectivity of the fiber end. More importantly, this black glass is also used to calibrate the nonuniformity of the sensitivity of the CCD pixels to improve the spatial accuracy. The wavelength-dependent reflectivity of the reference black glass is further exploited to calibrate the responsivity of the CCD to achieve the multi-wavelength measurement. Besides, a fiber terminator is connected to the other fiber end instead of water or index matching oil immersion to prevent the errors of measurement from the backside return light. An aperture stop is utilized to reduce the errors resulting from the angle dependent reflectivity. With the developed calibration procedures, the surface reflectivities on various fiber ends can be precisely measured to determine the RIP. In comparison with the previous image technique based on the partially coherent laser illumination [20], the present method can be used to measure the RIP not only for a multi-mode fiber but also for a single-mode fiber.
2. Principle and method
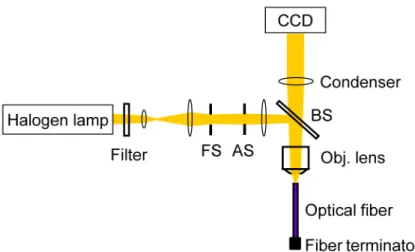
Figure 1 shows the experimental setup for measuring surface reflectivities on an optical fiber end. The basic configuration is based on an optical microscope which the wavelength covers from 400 nm to 1100 nm. A bandpass filter (FWHM~10 nm) was used to select a monochromatic beam at the specific wavelength from an 100-W halogen lamp. The filtered beam passed through an a field stop, aperture stop, an objective lens (Zeiss, EC Epiplan-Apochromat 20 × /50 × , N.A. = 0.6/0.95) and then illuminated on the cleaved fiber end. The backside end of the optical fiber was connected with a 50-dB fiber terminator (Thorlabs, FTAPC1; 400–2100 nm) to prevent the backside return light. Köhler illumination was set to enhance the optical homogenization for uniformly illuminating the light on the transverse surface of a fiber end to achieve the high spatial accuracy. The aperture stop was used to adjust the incident angle on the fiber end while a filed stop was used to limit the filed angle. The incident angle of illumination light was controlled to be less than 30° for reducing the errors coming from the angle dependent reflectivity. The detailed discussion for this issue will be shown later. A TE-cooled CCD (Hamamatsu, ORCA-R2), a 16 bits monochromatic sensor with the high dynamic range of 6000:1, was used to capture the reflective image of the optical fiber.
Fig. 1. Schematic of the experimental setup for measuring surface reflectivities on the fiber end comprising a halogen lamp, an objective lens and a TE-cooled CCD. FS, field stop; AS, aperture stop; BS, beamsplitter.
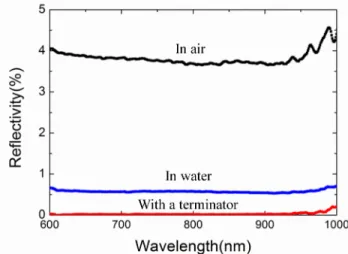
A polished black glass (diameter = 25 mm, surface flatness<λ/20, λ = 632.8 nm) was used as a reference standard to obtain the absolute reflectivity of the fiber end. The absolute surface reflectivity of the black glass Rblackglass(λ) was measured with a calibrated spectrometer
(PerkinElmer, Lambda 900), as shown in Fig. 2. Since the black glass had a very high attenuation (optical density = 9) for the incident illumination light, there was almost no backside reflection, like the condition of the optical fiber with a terminator. With Rblackglass(λ)
as a reference standard, the absolute surface reflectivity for a fiber under measurement Rfiber(x,y,λ) can be expressed as
( , , ) ( , , ) ( ) , ( , , ) fiber fiber blackglass blackglass I x y R x y R I x y λ λ λ λ = (1)
where Iblackglass(x,y,λ) and Ifiber(x,y,λ) are the intensities of the illumination light through the
microscope and reflected from the black glass, and the fiber under measurement, respectively. The x and y are the spatial position on the fiber end.
Fig. 2. The spectral reflectivity of the black glass measured with a calibrated spectrometer.
An objective lens with high numerical aperture is necessary to acquire a spatial resolution (r = 0.61λ/sin θ) down to the 1 μm for measuring RIP of a single-mode fiber or a multi-mode fiber in the visible range. However, the incident angle of the illumination light needs to be reduced to control the measurement errors arising from the oblique incidence. The influence of the oblique incidence on the measurement can be theoretically analyzed with the Fresnel formula. The reflective intensities from the targets for the un-polarized illumination beam with an oblique incident angle can be expressed as
2 2 2 2 2 0 2 2 2 sin cos 1 ( ) cos sin ( , ) ,
2 cos sin cos 1 (sin )
i i i i i i i i i n n I n I n n n n θ θ θ θ θ θ θ θ θ − − − − = + + − + − (2)
where Ι0 is the intensity of illuminating beam, θi is the incident angle and n is refractive index
of the target. Equation (2) reveals that the reflective intensity from the target is increased with increasing the oblique incident angle θi. The reflective intensities for the fiber and the black
glass are denoted as I(nfiber,θi) and I(nblackglass,θi), respectively. As seen in Eq. (1), the accuracy
of measuring the surface reflectivity of the fiber end mainly depends on the value of I(nfiber,θi)
/I(nblackglass,θi). In our system, nblackglass was approximately 1.522 at the wavelength of 620 nm
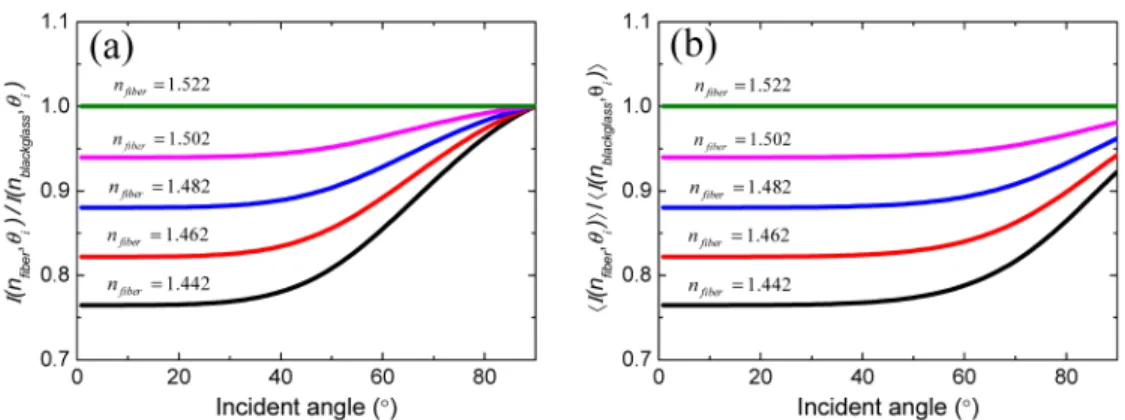
and the refractive index for the fiber under measurement was in the range of 1.442 – 1.522. Figure 3(a) shows the value of I(nfiber,θi)/I(nblackglass,θi) as a function of the incident angle θi for
five different values of nfiber in the concerned region. It can be seen that the value is almost a
constant for the incident angle less than 20°. In fact, critical illumination method can be employed to obtain a higher spatial resolution. The illuminating beam focused by an objective lens is an angular distribution. Considering an uniform angular distribution, the average value of I(nfiber,θi)/I(nblackglass,θi) can be obtained by
max max 0 0 ( ) ( , ) , , , ( ) ( , ) fiber i i fiber i blackglass i blackglass i i I n I n I n I n d d θ θ θ θ θ θ θ θ =
(3)where θmax is the maximum angle incident on the sample. Figure 3(b) shows the average value
of I(nfiber,θi)/I(nblackglass,θi) as a function of the incident angle θi. In comparison with the
Fig. 3(a), the average value of I(nfiber,θi)/I(nblackglass,θi) is less sensitive to the incident
angle. The value is almost a constant for the incident angle less than 30°. However, the critical illumination method may suffer the problem from the image of lamp filament.
Fig. 3. (a) The value of I(nfiber,θi) /I(nblackglass,θi) as a function of the incident angle where the
value of nfiber is in the range of 1.442 −1.522, (b) the average value of
I(nfiber,θi)/I(nblackglass,θi) as a function of the incident angle.
Since the incident angle is limited in the range of small angles, the θi - dependence is
omitted in the following analysis. The effective intensities captured by the CCD for Ifiber(x,y,λ)
and Iblackglass(x,y,λ) can be given by
( , , ) ( , , ) ( , , ) ( , , ) ( , , ),
CCD
fiber fiber background
I X Y λ =S X Y λ A X Y λ I x y λ +I X Y λ (4)
( , , ) ( , , ) ( , , ) ( , , ) ( , , ),
CCD
blackglass blackglass background
I X Y λ =S X Y λ A X Y λ I x yλ +I X Y λ (5) where X and Y are the spatial position on the CCD, λ is test wavelength, S(X,Y,λ) is the spatially dependent sensitivity and spectral responsivity of the CCD pixels, A(X,Y,λ) is the distributions of the attenuation in the microscope, and Ibackground(X,Y,λ) is the background noise
on the CCD. For an optical microscope with a magnification factor M, X = M × x and Y = M × y. Substituting Eqs. (4) and (5) into Eq. (1), the spatially dependent surface reflectivities on the fiber end Rfiber(x,y,λ) can be written as
( , , ) ( , , ) ( , , ) ( ) . ( , , ) ( , , ) CCD fiber background fiber blackglass CCD blackglass background I X Y I X Y R x y R I X Y I X Y λ λ λ λ λ λ − = − (6)
Equation (6) reveals that the information of the black glass can be used to directly determine the spatially dependent reflectivity of the fiber end without knowing S(X,Y,λ) and A(X,Y,λ). In other words, the influence of S(X,Y,λ) and A(X,Y,λ) can be eliminated with the reference to black glass. Substituting Rfiber(x,y,λ) into the Fresnel formula for the refractive indices on an
optical fiber end, n fiber(x,y,λ) can be obtained by
1 ( , , ) ( , , ) . 1 ( , , ) fiber fiber fiber R x y n x y R x y λ λ λ + = − (7)
In general, the difference of refractive index between the core and cladding regions Δn are ~0.006 and ~0.03 for a single-mode fiber and multi-mode fiber, respectively. Since the TE-cooled CCD has a high dynamic range of 6000:1 and a 16 bits A/D converter, the
measurement resolution of refractive index could be better than 2 × 10⁻⁴ based on the
proposed image method of the surface reflectivity. Thus, the present method can be used to achieve a spatial resolution of 1 μm as well as a resolution of 2 × 10⁻⁴ for refractive index. 3. Experimental results
Figure 4 shows the experimental results for the reflectivity of the backside fiber end exposed to air, immersed in water, and connected with a terminator. The tested fiber was a multi-mode graded-index fiber. It can be seen that the reflectivity was approximately 3.8% at 620 nm
when the backside fiber end was exposed to air. To decrease the reflectivity, the backside fiber end was immersed in water in the previous works with reflection method and was measured to be 0.58% here. However, the reflectivity can be further significantly reduced down to ~0.01% by connecting the backside fiber end with a 50-dB terminator. Referring to Fig. 4, it is obvious that connecting with a terminator we arise here is a promising method to effectively diminish the backside return light. The present method was employed to measure the RIP for various optical fibers in later, including an ultrahigh-numerical-aperture fiber (Thorlabs, UHNA3), a single-mode fiber (Thorlabs, SM600), and a multi-mode graded-index fiber (Thorlabs, GIF625).
Fig. 4. Measured results of the backside return light for backside fiber end in air, in water and with a terminator.
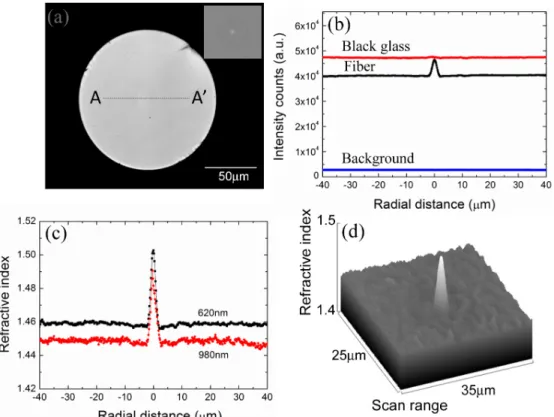
Figure 5(a) shows the global image at the wavelength of 620nm for the ultrahigh-numerical-aperture fiber with a 20 × magnification factor and spatial resolution of 1.1 μm. We can see that the core is brighter than the cladding because of the higher refractive index as shown in the insert of Fig. 5(a). Figure 5(b) demonstrates the experimental results of the
effective intensities for the black glass CCD ( , , )
blackglass I X Y λ , the fiber CCD( , , ) fiber I X Y λ , and background CCD ( , , ) background
I X Y λ for different position between point A and A’ at the wavelength
of 620 nm. Based on the experimental result of the black glass as depicted in Fig. 5(b), the
uniformity of illumination light focused by an objective lens was nearly 0.006 (U = (Imax
-Imin)/(Imax + Imin)). Therefore, Köhler illumination was beneficial for halogen light to
uniformly illuminate on the transverse surface of the fiber end to achieve high spatial accuracy. To achieve the precise RIP measurement, the background must be further eliminated even though the intensity was approximately 2700 counts at 620 nm and 7000 counts at 980 nm. With Eq. (6) and (7), the RIP of the fiber for different position between point A and A’ shown in Fig. 5(a) at the wavelength of 620 nm and 980 nm was plotted in Fig. 5(c). And the two-dimensional RIP was also illustrated at 620 nm in Fig. 5(d). From the numerous experiments, the measurement accuracy of refractive index mainly depended on stability of lamp intensity. The variation of lamp intensity was about ± 0.5% during the measuring process. The standard deviation σn was about 0.0017. The differences of the refractive index between the core and cladding Δn were 0.043 and 0.042 at the wavelengths of 620 nm and 980 nm, respectively. The values of N.A. could be calculated to be approximately 0.36 and 0.35 at the wavelengths of 620 nm and 980 nm, respectively. These values were good agreement with the N.A. of 0.35 for the specification of the fiber vendor [21].
Next, we measured the RIP of a single-mode fiber (SM600) with a core size ~4 μm by an objective lens with a 50 × magnification factor and a N.A. of 0.95 at 580 nm. The incident
angle was adjusted to be less than 20° for reducing the errors coming from the angle dependent reflectivity. The one-dimensional RIP of the single-mode fiber as a function of the radial distance from the core at a fixed azimuthal angle was obtained as shown in the Fig. 6. The spatial resolution is approximately 1 μm. The difference of the refractive index between the core and cladding Δn was 0.0046. The N.A. can be deduced to be approximately 0.116 at 580 nm which agrees very well with the N.A. of 0.11 ± 0.01 for the specification of the fiber vendor [21].
Fig. 5. (a) Global image of an ultrahigh-numerical-aperture fiber end. The line of A-A’ is selected to show refractive index profile. Insert, the central part of the fiber end, (b) the effective intensities on the CCD for the fiber end, black glass and background, (c) the one-dimensional refractive index profiling of the fiber end at 620 nm and 980 nm, and (d) the surface plot for the selected image of the spatially dependent refractive index on the fiber end.
Finally, a multi-mode graded-index fiber (Thorlabs, GIF625) with a core size of 62.5 μm was measured by a 20 × objective lens at 800 nm. With the present calibration procedures, the two-dimensional and one-dimensional RIP were obtained and displayed in Fig. 7(a) and Fig. 7(b), respectively. The dark area in the Fig. 7(a) is the projection of the field stop which is used to avoid the stray light from other field angle. Since the background on the CCD was eliminated effectively based on Eq. (6), the refractive index was 1.0 in the dark area (air). We can see that the experimental result is consistent with the fitting curve used in [22] as shown in Fig. 7(b). The Δn was 0.028 which corresponds to a N.A. of approximately 0.285 at the wavelength of 800 nm. The calculated N.A. was in good agreement with the N.A. of the specification of fiber vendor with the value of 0.275 ± 0.015 [21].
Fig. 7. (a) The surface plot for the image of the spatially dependent refractive index on the graded-index fiber end, and (b) one-dimentional refractive index profile on the graded-index fiber end.
4. Conclusion
In summary, we have successfully achieved the multi-wavelength refractive index profiling of various optical fibers by the direct images of surface reflectivies on the cleaved fiber ends with a filtered halogen lamp. With the high-numerical-aperture objective lens and a TE-cooled CCD of high dynamic range, the spatial resolution and the resolution of refractive index are better than 1 μm and 2 × 10⁻⁴, respectively. By introducing a black glass with the measured spectral reflectivity as a reference standard, not only the spectral reflectivity of the tested fibers but also the sensitivity and responsivity of the capturing CCD can be calibrated for the measuring surface reflectivity to determine the RIP. Besides, the backside fiber end is connected with a fiber terminator to reduce the backside return light. The aperture stop is used to control the incident angle on the fiber end for reducing the errors coming from the angle dependent reflectivity. Since the wavelength ranges of this imaging system covers from 400 nm to 1100 nm, the various optical fibers in the visible range to NIR range such as a single-mode fiber, ultrahigh-numerical-aperture fiber, and multi-single-mode graded-index fiber can be easily measured precisely.
Acknowledgments
This work was sponsored in part by the Ministry of Science and Technology, Taiwan under contract number MOST 103-2122-M-009-016-MY3. Technical help from Mr. Cheng-Yeh Lee at Department of Electrophysics in NCTU is especially appreciated.