行政院國家科學委員會專題研究計畫 成果報告
鐵鈀合金之磁非等方性與磁性相微結構探討
計畫類別: 個別型計畫
計畫編號: NSC93-2212-E-151-013-
執行期間: 93 年 08 月 01 日至 94 年 07 月 31 日
執行單位: 國立高雄應用科技大學模具工程系
計畫主持人: 林英志
計畫參與人員: 林建鋒
報告類型: 精簡報告
報告附件: 出席國際會議研究心得報告及發表論文
處理方式: 本計畫涉及專利或其他智慧財產權,2 年後可公開查詢
中 華 民 國 94 年 7 月 21 日
Investigation of the Microstructure and Anisotropy of the Ferromagnetic
Fe-Pd Alloys
Yin-Chih Lin
1, Chien-Feng Lin
21
Department of Mold and Die Engineering, National Kaohsiung University of Applied Sciences
2
Department of Mechanical Engineering, Kun Shan University of Technology
NSC Project No. : NSC-93-2212-E-151-013
Abstract
The research paper was carried out to investigate the relationship between the microstructure and magnetic property of the thermally aged Fe-25wt%Pd alloys which induced high susceptibility at T350 K, and the
-T curves ZFC and FC did not coalesce until they reached temperature at T = 350 K as determined by SQUID (superconducting quantum interference device magnetometer). The crystal structure change was studied using transmission electron microscopy (TEM) and X-ray diffraction pattern where observation of the phase transition was made. The research result reveals that the alloys after solid solution treatment (S. T.) then thermal aging at 748 K for given times, the alloys will give rise to the reaction as follows:γfcc (quenching) →bct+L1m (the novel monoclinic L1m structure with lattice parameter of a = 3.183 Å, b = 3.716 Å, c = 3.114 Å, and β = 91.215°) → by thermal aging bct+L1m → αbct+L1m+L10-fct, where the αbct indicates ordered BCT soft magnetic structure with depleted-Pd elements, while the L10-fct denotes ordered FCT hard magnetic structure with enriched-Pd elements. The crystal orientation relationships between the L1m; αbctcan be demonstrated as [1 11]L1m//[012]αbctand [1 01]L1m//[11 0]αbct, and the L10-fct; L1m; αbct can be illustrated as [101]L10-fct//[201]L1m//[112]αbctand [100]L10-fct// [011]Lm//[11 0]αbct, respectively.
Keywords:Fe-Pd alloys; TEM and X-ray; phase transition; SQUID; magnetism
1. Introduction
Magnet materials play an important role in todays science and technology. Many common devices at home and elsewhere, like appliances, computers, printers, motors and actuators are made of magnet materials. Also, the magnet materials are important components of many industrial, military, and aerospace systems [1-2]. The Fe-Pd alloys contain compounds with the L10-fct structure and high magnetic anisotropy that have been studied as important magnet materials. The L10-fct structure with an ordered face-centered tetragonal phase has high crystal anisotropy constants K1~107-108 ergs/cm3 [3-5], and fine transformation twins may contribute to the coercivity. This characteristic magnetism will be suitable for application to the
thermally stable high-density magnetic recording media. The primary purpose of the present study is to set insight into some basic knowledge of the phase transition and magnetic property of Fe-25wt%Pd ferromagnetic alloys by use of SADP (selected area diffraction pattern) of TEM, X-ray diffraction, and SQUID. There is an evidence of the monoclinic intermediate structure (L1m) which should be formed during the bct-fct martensite transformation, and the ordered L10-fct phase results from the monoclinic L1m structure owing to a phase transition. Also, from the TEM study in association with Fe-Pd phase diagram investigation, it is discovered that the temperature of the γfccphase decomposition intobct+L1mseems to occur in near 700-950 K. This phase transformation belongs to a displacement martensite transition (diffusionless reaction). The tetragonal bct monoclinic L1m phase transition induces a large number of volume changes due to atomic shear displacement attendant on atomic shear strains, therefore a large number of modulated structures (i.e., wavy contrast) can be found in the TEM image. The crystal structures identification and the crystal orientation relationships between αbct; L1m; L10-fctwill be confirmed by SADP of TEM, while the lattice parameter of αbct, L1m, L10-fctstructures will be obtained by the calculation method using X-ray diffraction d-spacing in association with measurement the SADP of TEM. After aged treatment, the magnetic property of the alloy reveals a high susceptibility at T 350 K, which is contributed by αbctand L1mphases. The alloy increases in the coercivity, which is ascribed to the precipitation of L10-fctstructure [3-5].
2. Experimental procedure
The Fe-25wt%Pd alloys were melted by pure electrolytic iron (99.9%) and pure palladium (99.95%) in an arc vacuum furnace under a controlled protective argon atmosphere. The cast ingot was homogenized at 1323 K for 216 ks in an evacuated quartz capsule and subsequently hot forged to a thickness of 2 mm. After forged, the specimens were sliced and solution treated (S. T.) at 1236 K for 22 ks in an evacuated quartz capsule again and quenched into water at room temperature, then aged treatment was carried out at 748 K for given times. Thin foils for TEM were prepared by double jet electropolishing in a solution containing 82% acetic acid, 9% perchloric acid, and 9% methanol at a temperature in
the range of –7 C~10 C using a current density of 2 A/cm2 to 4 A/cm2. Transmission electron microscopy (TEM), with a double tilt stage, was performed in a JEOL 200 CX and JEOL 3010 AEM instruments operated at 200 kV. The X-ray diffraction patterns were detected at room temperature using an X-ray diffractometer (Siemens D5000 Karlsruhe) with Cu-K radiation, and diffraction angles were in the 2ranges from 35 to 140. The magnetic property zero-field-cooled (ZFC) and field-cooled (FC) measurements were carried out with a superconducting quantum interference device (SQUID) magnetometer. The temperature dependence of mass susceptibility (-T curve) measurements on samples cooled under 100 Oe were made in the temperature range from 0 K to 350 K by induction method.
3. Results and discussion
3.1.
γ
fccphase separation into ordered
bct+L1
mstructures
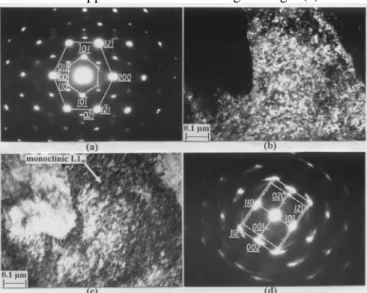
An essential TEM selected area diffraction pattern with zone axis [1 11]L1m//[012]bctof the Fe-25wt%Pd alloys S. T. at 1236 K for 22 ks quenching in water is shown in Fig. 1(a) (hkl denotes monoclinic L1mstructure; hkl denotes tetragonal bct phase). On the basis of the diffraction pattern analysis, a faint superlattice reflection at the (100)bct, (021)bctposition can be seen from the micrograph indication that the as quenched γfcc phase separation into bct should be a weakly first ordering reaction [6]. The ordering reaction begins during the quench, and it seems to occur in near the temperature of 700-950 K. Due to appear the superlattice reflection in the SADP, therefore the bct should be reasonably inferred as an ordered structure. By calculating the X-ray diffraction peaks in association with SADP measurements, it is found that the ordered bct martensite has a lattice parameter of a = 2.894 Å, c = 2.876 Å, and c/a = 0.994. Fig. 1(b) is a dark field (DF) image formed using monoclinic (101)L1m reflection corresponding to Fig. 1(a). In this image, the L1mstructure is in bright contrast, and the dark contrast is orderedbctphase. The L1mis a monoclinic structure with a lattice parameter of a = 3.183 Å, b = 3.716 Å, c = 3.114 Å,and β= 91.215°. In the DF image, the monoclinic L1m structure with a nanometer particles can be distinctly observed in the early phase transition. Fig. 1(c) is a bright field (BF) image. The wavy contrast (i.e., the modulated structures) appears in the micrograph, and the traces of the striations parallel to the
g
= (110)L1m vector which corresponds to Fig. 1(a). The black nano-particle of L1m structure precipitation in the bct matrix, indicated by arrow, is shown in Fig. 1(c). The tetragonal bct→ monoclinic L1mdecomposition belongs to a displacement transition, in which the atoms rapidly shift a small displacement to form a new monoclinic structure. In the case, a largenumber of {110} shear strains occur in the matrix that attendant a large amount of wavy contrast can be observed in the BF image. For further confirmation of the tetragonal bct→ monoclinic L1mtransition existing in the alloy system, the other SADP taken from same sample but different area is shown in Fig. 1(d), in which the SADP demonstrates [101]L1m//[110]bct and (1 01)L1m//(110)bct; (02 0)L1m//(002)bct, respectively. (hkl denotes monoclinic L1m structure; hkl denotes tetragonal bct phase). The superlattice (001)bct reflection distinctly appears in Fig. 1(d) that manifest the bctphase has an ordered structure again. In addition, in Fig. 1(d), around the fundamental (002)bct reflection, the double and splitting reflections can be seen in the micrograph that indicates the disordered γfccphase being separation intobct+L1m. The fairly low degree of order bct has a large number of fine nuclei. This case is consistent with the modulated structures and martensite microtwins appearance in the BF image of Fig. 1(c).
Fig. 1. TEM micrographs of the Fe-25wt%Pd alloys S. T. at 1236 K for 22 ks quenching in water: (a) SADP of the zone axis [1 11]L1m//[012]bct(hkl denotes monoclinic L1mstructure; hkl denotes ordered bct matrix), (b) DF image of (101)L1m monoclinic L1m reflection corresponding to (a), (c) BF image, (d) the other zone axis, including the monoclinic L1mstructure and ordered bct phase, demonstrated [1 0 1]L1m//[11 0]bct. The monoclinic L1mstructure has a lattice parameter of a = 3.183 Å, b = 3.716 Å, c = 3.114 Å, and β= 91.215°; the orderedbcttetragonal martensite has a lattice parameter of a = 2.894 Å, c = 2.876 Å, and c/a = 0.994.
3.2. The ordered
bct+L1
mphases decomposition
into
bct+L1
m+L1
0-fctstructures
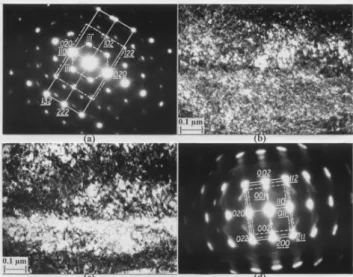
Figs. 2(a)-(d) are a series of TEM micrographs taken from the alloys after S. T. then thermally aged at 748 K for 3.6 ks. Fig. 2(a) is a typical SADP zone axis [101]L10-fct//[2 01]L1m//[112]bct (hkl denotes ordered L10-fct phase; hkl denotes monoclinic L1mstructure; hkl denotes ordered bct matrix). Careful analysis of the
SADP zone axis, reveals it as (02 0)L10-fct//(02 0)L1m//(110)bctand (102)L1m//(2 22)bct, respectively. Note, in the SADP around the (020)L1m; (020)L10-fct reflection, very small satellites can be observed in the micrograph, indicated that the L1m → L10-fct phase transition accompanies with a modulation due to composition fluctuations [7]. Fig. 2(b) is a DF image for (02 0)L10-fct; (02 0)L1m or (110)bct reflections that correspond to Fig. 2(a). Shown in Fig. 2(c) is a BF image. From the TEM micrographs of Figs. 2(a)-(c) analyses, we can see the martensite shear band morphology as well as very small precipitation particles attendant upon modulated structures. Therefore, it can reasonably be
Fig. 2. TEM micrographs of the alloys after S. T. and aged at 748 K for 3.6 ks showbct+L1mphases transition tobct+L1m+L10-fctstructures. (a) SADP of the zone axis [101]L10-fct//[2 01]L1m//[112]bct (hkl denotes ordered L10-fctphase; hkl denotes monoclinic L1mstructure; hkl denotes ordered bct matrix), (b) DF image for (02 0)L10-fct; (02 0)L1m or (110)bct reflections corresponding to (a), (c) BF image, (d) the other zone axis, including the L10-fct phase, monoclinic L1m structure, and ordered bct matrix, demonstrated [100]L10-fct//[0 11]L1m//[11 0]bct. The ordered L10-fct structure has a lattice parameter of a = 3.848 Å, c = 3.715 Å, and c/a = 0.965.
inferred that the phase transition sequences in the alloy systems should be as follows: γfccquenched transition → bct+L1m, and thermally aged bct+L1m → bct+L1m+L10-fct. The phase transformation mechanism includes: (a)bct→ L1mwhich is a displacive transition (diffusionless) through atoms rapidly shifting to form a new atomic arrangement that in displacive transition occurs rapidly. There are relatively large volume dilation and atomic shear strains associated with the transformation from high-temperature bct tetragonal phase to the low-temperature new L1m monoclinic structure. Also, the transformation may be triggered by the stress field. (b) L1m→ L10-fctthis reaction belongs to diffusion transition generally via a nucleation and grain
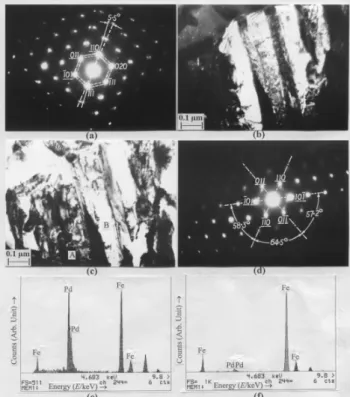
growth process which is similar to a reconstructive transformation. It occurs slowly and it has to start all over again to make the new L10-fct structure. For further confirmation of thebct+L1m+L10-fctstructures persistent existence in the aged alloy system, the other SADP taken from the same specimen is shown in Fig. 2(d), in which the orientation relationships between the bct+L1m+L10-fct structures are demonstrated to be [100]L10-fct//[011]L1m//[110]bct, and (020)L10-fct// (011)L1m//(110)bct; (002)L10-fct//(200)L1m//(0 02)bct, respectively. The TEM micrographs of the alloy after S. T. and aged at 748 K for 432 ks are shown in Figs. 3(a)-(d). Fig. 3(a) is a typical SADP zone axis illustrated [1 01]L10-fct//[11 1]L1m, and (111)L10-fct//(011)L1m; (02 0)L10-fct//(101)L1m, but as shown in Fig. 3(a) indicates the (1 11)L10-fctwith ~ 5.5° from (110)L1mthat manifests two phases existence in the SADP. A dark field image formed using (11 1)L10-fct and (11 0)L1m reflections corresponding to Fig. 3(a) is shown in Fig. 3(b) revealing the polytwinned L10-fct structures. The formation of polytwinned structure is due to minimize the atomic ordering strain energy that is accompanied by the atomic ordering reaction attendant to relax the strain energy as well [3-5,7]. Also, the polytwinned structure indicates {110} twin planes with a minimum strain energy that it is the ordered phase with L10-fct structure which is easily formed along the {110} twin planes [3-5,7]. Fig. 3(c) is a BF image. The modulated structures and microtwins can be observed in the BF and DF micrographs. As by carefully tilted the same specimen from same area, the single monoclinic [11 1]L1m zone axis is taken and shown in Fig. 3(d). This particular SADP has a 64.5° from (11 0)L1m to (011)L1m; a 57.2° from (011)L1mto (101)L1m; and a 58.3° from (11 0)L1mto (101)L1m. The SADP seems to resemble the traditional [111]FCC zone axis, but the angle, the lattice parameter, and the d-spacing are exactly different from the [111]FCCsystem. The result explains the fact that the monoclinic L1mstructure exists in the specimen, and the L10-fctphase precipitates from the L1m structure because of a phase transformation.
Qualitative X-ray energy-dispersive spectrometer (EDS) analyses, taken from TEM image, were carried out to examine the partitioning of Pd atoms during the phase transition. Fig. 3(e) is the EDS spectra taken from the L10-fct structure (i.e., the black region marked A shown in Fig. 3(c)), and Fig. 3(f) is that of thebctphase (i.e., the bright area marked B shown in Fig. 3(c)) adjacent to the L10-fct structure. Comparing the two spectra, a great disparity in Fe and Pd is found. The intensity of the Pd contents in L10-fct structures (black region) is markedly increased as shown in Fig. 3(e). Since the Pd is a high-austenite stabilizing element [8], the Pd-rich L10-fctstructure may still be able to remain a fct-based structure. This observation is quite consistent with the fact that Pd is a stronger L10-fctformer than Fe. The exchange is caused by the substitution of Pd for Fe,
Fig. 3. The TEM micrographs of the alloys after S. T. and aged at 748 K for 432 ks show the L10-fct structure and L1m phase. (a) SADP of the zone axis [1 01]L10-fct//[11 1]L1m(hkl denotes ordered L10-fctphase; hkl denotes monoclinic L1m structure), (b) DF image formed using (11 1)L10-fctand (11 0)L1m reflections corresponding to (a), (c) BF image, (d) a single L1m monoclinic [11 1]L1m zone axis taken from the same region by carefully tilted specimen, (e) EDS spectra taken from the ordered L10-fct structure (i.e., the black region marked with A) as indicated in (c), (f) EDS spectra taken from the bct phase (i.e., the bright area marked with B) contiguous to the L10-fct structure. Note the higher Pd element revealed in the spectrum from L10-fctstructure than that inbctphase.
which lowers the atomic potential energy (VBB) in a L10-fctalloy. The result will induce the higher growth rate and a higher anisotropic tendency in the L10-fctparticle. Fig. 3(f) is the EDS spectra taken from the bct phase revealing that the contents of Fe in the bct phase are significantly higher than those in the L10-fctstructure. It is noteworthy that the bct phase is rich in Fe, whereas Pd is very little. The EDS experiments taken from L10-fct, L1m, andbctphases are shown in Table 1, in which the
Phase Elements
(at%) bct L1m L10-fct
Fe 97.05 71.48 46.56
Pd 2.95 28.52 53.44
Table 1. Chemical composition of EDS analyses for thebct, L1m, and L10-fctphases of Fe-25wt%Pd alloys S. T. and aged at 748 K for 432 ks.
ordered αbctsoft magnetic structure reveals depleted-Pd elements, while the ordered L10-fct hard magnetic structure with enriched-Pd elements develops into the near equi-atomic FePd structure, and the monoclinic L1m magnetic structure appears medium-Pd elements.
3.3. X-ray diffraction pattern analyses
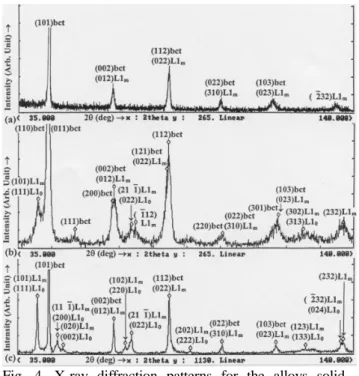
Figs. 4(a)-(c) represent a series of X-ray diffraction patterns for the alloy S. T., and after aged the alloy at 748 K for different aging times. The X-ray diffraction pattern of the alloy S. T. at 1236 K for 22 ks and water quenched is shown in Fig. 4(a), which revealsbct and L1m phase diffraction peaks. When the alloy was aged at 748 K for 36 ks, the ordered L10-fct structure also appeared in X-ray diffraction patterns in addition to the bct phase and the monoclinic L1mphase, as shown in Fig. 4(b). The X-ray diffraction peaks corresponding to the planes (011)bct, (002)bct, (112)bct, (022)bct, and (103)bctbroaden, which indicates the evolution of phase changes from thebctand L1mphases to a stable state phase formation of the ordered L10-fct structures. Comparing Figs. 4(a) and (b), there is a small shift in the diffraction angles demonstrating the lattice change owing to movement of the Pd atoms in association with the phase transformation [9-10]. Fig. 4(b) distinctly shows the tetragonal splitting peaks occur in near around 2= 64.34° and 64.79°. Careful inspection has revealed that the splitting peaks consist of two phases, which can be indexed as (200)bct, and (002)bct; (012)L1m. The similar tetragonal splitting peaks also appear at 2= 81.30° and 81.85°, which can be demonstrated as (121)bct; (022)L1m, and (112)bct. These splitting peaks are the result of formation of the completely ordered tetragonal bct structure attendant on the L1m-L10-fct precipitation reaction. The bct+L1m phases separation into bct+L1m+L10-fct structures confirmed by TEM are discussed in previous Section 3.2. The results, investigated by TEM and X-ray diffraction analyses, are exactly coincidental. Fig. 4(c) shows the X-ray diffraction patterns of the alloy S. T. and aged at 748 K for 432 ks. It clearly shows the presence of L10-fct, L1m, and bct phases. In addition, it is interesting to note that the tetragonal splitting peaks occur in near around 2= 47.21° and 49.01°. Detailed inspection has revealed that the splitting peaks consist of two phases, which can be indexed as (200)L10-fct; (1 11)L1m, and (002)L10-fct; (020)L1m reflections of the ordered L10-fct and monoclinic L1mstructures. Also, the similar tetragonal splitting peaks can be found at around 2 = 68.49° and 70.42°, which can be demonstrated as (220)L10-fct; (102)L1m, and (022)L10-fct; (211)L1m, respectively. Comparing Figs. 4(b) and (c), it reveals that the longer annealing time seems to lead the bct-phase peaks motion toward the higher diffraction angle side, while the ordered L10-fct peaks shift toward the lower diffraction angle side, in the case, the more completely ordered L10-fct structure with increased anisotropy will give rise to the enhanced magnetic coercivity in the Fe-25wt%Pd alloys [3-5,10].
Fig. 4. X-ray diffraction patterns for the alloys solid solution and after aging at 748 K for various times: (a) 1236 K for 22 ks S. T. and quenched in water; (b) aged at 748 K for 36 ks; (c) aged at 748 K for 432 ks. (bct denotes tetragonalbctmartensite, L1mdenotes monoclinic phase, L10denotes ordered L10-fctstructure).
3.4. Magnetic property
Fig. 5 (a) shows the temperature dependence of the magnetic mass susceptibility (: emu/g-Oe) of the alloy S. T. and aged at 748 K for 36 ks as measured by SQUID. The measured values displayed show both the zero-field-cooled (ZFC) data and the field-cooled (FC) data within a field of 100 Oe. It is interesting to note that in Fig. 5(a) the -T curves ZFC and FC with a high susceptibility do not coalesce until they reach temperature at T = 350 K, and that the spontaneous magnetization occurs at Ts = 5 K. The temperature of irreversibility (Tirr.) between the FC and ZFC curves is near at T = 320-350 K. We define the temperature of irreversibility as the temperature at which the FC and ZFC curves begin to diverge. The extent of thermal irreversibility to the -T curve is directly correlated to the magnetocrystalline anisotropy and therefore to the coercivity of the materials. Furthermore, the FC data lies above the ZFC data all the way out to temperature T = 5-350 K. By careful analysis of the ZFC data in Fig. 5(a), indicates that the monotonous increase in the ZFC susceptibility () up to T = 350 K for the alloys aged at 748 K for 36 ks shows that the blocking temperature is much above 350 K in the alloy systems. For this composition, the Pd is close to percolation that leads to the formation of larger L10-fct particles with high-ordering temperature [11]. In addition, a gradually decrease in the susceptibility () is observed in the FC curve when the temperature is decreased from 350 K to
(a)
(b)
Fig. 5. Temperature dependence of the magnetic mass susceptibility (T curve) of the Fe-25wt%Pd alloys: (a) S. T. and aged at 748 K for 36 ks; (b) S. T. and aged at 748 K for 432 ks. The measurements were carried out both at ZFC, and at FC in a field of 100 Oe.
5 K. These results are explained as follows: In the ZFC experiment, the temperature has not been raised enough to polarize a sufficient amount of the susceptibility in the direction of the applied field. At 350 K, the susceptibility still keeps the part memory of its initial ZFC state. Therefore, when the temperature is decreased, the part of the susceptibility which remained polarized in the hemisphere opposite to the applied field drags the susceptibility in this hemisphere leading to a decrease in the susceptibility [11]. If the experimental set-up allowed us to heat up the sample above its blocking temperature (T 350 K), this decrease would probably disappear. The FC data always lies above the ZFC data. This can be explained by the fact that upon cooling the sample in a magnetic field (100 Oe), the ferromagnetic particles become trapped in their higher-magnetized state, as they do not have enough thermal energy to pass over the potential energy barriers to return to their lower-magnetized equilibrium configuration, in the case, it will lead to the FC data lie above the ZFC data [12]. The temperature variation of ZFC and FC susceptibility of the alloy S. T. and aged at 748 K for 432 ks, measured
Temperature dependence of the magnetization as obtained by SQUID (Fe-25wt%P d alloys aged at 748 K for 432 ks)
0.13 0.15 0.17 0.19 0.21 0.23 0.25 0 50 100 150 200 250 300 350 400 T emperature (K) M as s su sc ep ti b il it y (e m u /g -O e) FC ZFC FC ZFC: zero-field-cooled FC: field-cooled in 100 Oe ZFC
Temperature dependence of the magnetization as obtained by SQUID (Fe-25wt%P d alloys aged at 748 K for 36 ks)
0.13 0.15 0.17 0.19 0.21 0.23 0.25 0 50 100 150 200 250 300 350 400 T emperature (K) M as s su sc ep ti b il it y (e m u /g -O e) FC ZFC ZFC ZFC: zero-field-cooled FC: field-cooled in 100 Oe FC
at H = 100 Oe, is compared in Fig. 5(b). Except the lower susceptibility occurring in low temperature (T = 5 K), Fig. 5(b) with a similar ZFC and FC curve resembles to Fig. 5(a). Therefore, we do not reiterate the ZFC and FC magnetic property of Fig. 5(b) here.
4. Conclusions
1. On S. T. and quenched alloys in water, the γfccphase separates into ordered bct+L1m phases, then by thermally aged alloys, the bct+L1m phases decompose into bct+L1m+L10-fct structures, as verified by both TEM and X-ray diffraction pattern. 2. The bct (tetragonal) L1m (monoclinic) phase
transition belongs to a displacive transformation, in which the reaction occurs rapidly and simultaneously attends on a large number of shear strains with modulated structures (tweed morphology), whereas the L1m (monoclinic) ordered L10-fct phase transition is a diffusion transformation via nucleation and grain growth process that is attendant upon composition fluctuations with polytwinned microstructures. 3. TEM selected area diffraction pattern reveals that
the orientation relationships between the L1m; αbct can be demonstrated as [1 11]L1m//[012]bct and [101]L1m//[11 0]bct, and the L10-fct; L1m; αbctcan be illustrated as [101]L10-fct//[201]L1m//[112]bct and [100]L10-fct//[0 11]L1m//[11 0]bct, respectively. 4. The chemical composition of the EDS analysis for
the ordered L10-fctstructure reveals it to be high in Pd with a near equi-atomic FePd concomitant the atomic ordering transformation, while thebctphase is high in Fe, but low in Pd, owing to the Pd atoms diffusion out to the L1mand L10-fctstructures. 5. SQUID magnetic measurements reveal that theT
curves appearing in the ZFC and FC curves with high susceptibility do not coalesce until they reach temperature T = 350 K, and the FC data lies above the ZFC data all the way out to temperature T = 5-350 K.
Acknowledgements
The authors would like to express their great appreciation to the National Science Council R.O.C. for supporting the work (under Grant-in-Aid for the project No: NSC-93-2212-E-151-013).
References
1.J. D. Livingston, The history of permanent magnet materials, JOM. February, pp. 30-34, 1990.
2.D. C. Jiles, Recent advances and future directions in magnetic materials, Acta Materialia, Vol. 51, pp. 5907-5939, 2003. 3.T. J. Klemmer, D. Hoydick, H. Okumura, B. Zhang and W. A.
Soffa, Magnetic hardening and coercivity mechanisms in L10
ordered FePd ferromagnets, Scripta Metallurgica et Materialia, Vol. 33, pp. 1793-1805, 1995.
4.T. J. Klemmer, C. Liu, N. Shukla, X. W. Wu, D. Weller, M. Tanase, D. E. Laughlin and W. A. Soffa, Combined reactions
associated with L10 ordering, Journal of Magnetism and
Magnetic Materials, Vol. 266, pp. 79-87, 2003.
5.B. Zhang and W. A. Soffa, Magnetic domains and coercivity in polytwinned ferromagnets, Phys. Stat. Sol. (a), Vol. 131, pp. 707-725, 1992.
6.J. J. Felten, T. J. Kinkus, A. C. E. Reid, J. B. Cohen, and G. B. Olson, Solid-solution structure and the weakly first-order displacive transformation in Fe-Pd alloys, Metallurgical and Materials Transactions A, Vol. 28A, pp. 527-536, 1997. 7.Lisha Wang, Zhaohui Fan, David E. Laughlin, Trace analysis
for magnetic domain images of L10polytwinned structures,
Scripta Materialia, Vol. 47, pp. 781-785, 2002.
8.M. Sugiyama, R. Oshima and F. E. Fujita, Mechanism of FCC-FCT thermoelastic martensite transformation in Fe-Pd alloys, Trans. of the Japan Institute of Metals, Vol. 27, No. 10, pp. 719-730, 1986.
9.Y. C. Lin, Structures and superparamagnetic properties of overaged Fe-Al-Mn-C alloys, Acta Materialia, 47, No. 18, pp. 4665-4681, 1999.
10.D. Vokoun, C. T. Hu, V. Kafka, Magnetic properties of annealed Fe-29.9 at% Pd ribbons, Journal of Magnetism and Magnetic Materials, Vol. 264, pp. 169-174, 2003.
11.L. C. C. M. Nagamine, B. Mevel, B. Dieny, B. Rodmacq, J. R. Regnard, C. Revenant-Brizard, I. Manzini, Magnetic properties and magnetoresistance of as-deposited and annealed CoxAg1-xand NixAg1-x(x = 0.2, 0.37) heterogeneous
alloys, Journal of Magnetism and Magnetic Materials, 195, pp. 437-451, 1999.
12.B. J. Hickey, M. A. Howson, S. O. Musa, G. J. Tomka, B. D. Rainford, and N. Wiser, Superparamagnetism in melt-spun CuCo granular samples, Journal of Magnetism and Magnetic Materials, 147, pp. 253-259, 1995.