ELSEVIER
P I I : S 0 9 6 0 - 8 5 2 4 ( 9 7 ) 0 0 1 2 1 - 1
Bioresource Technology 62 (1997) 85-90 © 1997 Elsevier Science Ltd. All rights reserved Printed in Great Britain 0960-8524/97 $17.00
E N H A N C E M E N T OF A N A E R O B I C DIGESTION OF WASTE
A C T I V A T E D S L U D G E BY ALKALINE SOLUBILIZATION
J i h - G a w L i n , a* C h e n g - N a n C h a n g b & S h o u - C h u n g C h a n g a
~lnstitute of Environmental Engineering, Chiao Tung University, 75 Po-Ai Street, Hsinchu City, Taiwan, ROC bGraduate Institute of Environmental Science, Tunghai University, Box 5-819, Taichung City, Taiwan, ROC
(Received 15 November 1996; revised version received 28 July 1997; accepted 8 August 1997)
Abstract
The performance of an anaerobic digestion fed with waste activated sludge (WAS) pretreated with N a O H was examined. The sludge was periodically collected from a municipal wastewater-treatment plant. The laboratory work was run in four 1-1 semi-continuous anaerobic digestion reactors. Reactor A was fed with untreated WAS at 1% total solids (TS). The other three reactors, B, C and D, were respectively fed with WAS (1% TS) pretreated with 20meq/l NaOH, WAS (1% TS) pretreated with 40meq/l NaOH, and WAS (2% TS) pretreated with 20 meq/l NaOH. The reactors were operated at 35°C at four hydraulic retention times - - 20, 13, 10 and 7.5 days. The performances o f reactors B, C and D, in terms o f chemical oxygen demand (COD), volatile solids (VS) removal, and gas production, were superior to that of reactor A. A t a retention time of 10 days, the COD removals o f reactors A, B, C and D were 38, 46, 51 and 52%, respectively. The gas productions of reactors B, C and D were, respectively, increased by 33, 30 and 163% over that o f reactor A. The sludge dewaterability was examined by capillary suction time (CST). The dewaterability of digested sludge was improved in reactors B, C and D. Capillary suction of digested sludges gave times in the range 148-389 s, compared with 309-735 s for undigested sludges. © 1997 Elsevier Science Ltd.
Key words: Waste activated sludge, anaerobic diges-
tion, hydrolysis, chemical pretreatment, dewater- ability.
INTRODUCTION
Anaerobic digestion is a common process for treat- ment of sludge. Compared with other processes, its advantages are less energy required, a better stabi- lized product, and usable gas. However, several limitations for anaerobic digestion include the slow reaction, the sensitivity to shock loads and toxic *Author to whom correspondence should be addressed.
85
materials, and its complicated operation. One factor influencing efficiency of anaerobic digestion is access to cell-bound organic matter. Digestion of waste activated sludge (WAS), in which most substrate is enclosed within cell membranes, requires release of the cell-bound substrate before it can be utilized by viable anaerobes. Thermal pretreatment (Haug et
al., 1983; Hiraoka et al., 1984; Pavlostathis and
Gossett, 1988; Li and Noike, 1992), thermochemical pretreatment (Stuckey and McCarty, 1978; Gossett
et al., 1982; Samson and Leduy, 1983; Pavlostathis
and Gossett, 1985; Sawayama et al., 1995), and alkaline solubilization (Rajan et al., 1989; Ray et al., 1990; Alleman et al., 1994; Woodard and Wukasch, 1994) have been investigated as methods to improve the digestibility of sludge and to increase production of methane. While thermal or thermochemical pretreatment of sludge results in an increase in biodegradability, the thermal process consumes a substantial amount of energy in addition to chemical consumption. The chemical pretreatment is more efficient and cost-effective when carried out at ambient temperature.
Sodium hydroxide at relatively low dosage levels is effective in solubilizing municipal WAS at ambient temperature. Alleman et al. (1994) demon- strated that alkaline treatment is effective in solubilizing munitions-grade nitrocellulose into soluble organic carbon forms. Woodard and Wukasch (1994) conducted a laboratory-scale study in the development of a hydrolysis/thickening/filtra- tion technology to improve the efficiency of solid digestion of WAS generated by the biological treat- ment of a pharmaceutical wastewater. Substantial solubilization (50-60%) of activated sludge suspended solids was achieved at room temperature, with a relatively short hydrolysis time. Rajan et al. (1989) showed that low-level alkaline pretreatment of waste activated sludge with NaOH can increase levels of solubilization up to 46%. Furthermore, Ray
et al. (1990) examined the ability of the single-stage
high-rate anaerobic digester to stabilize the alkaline- treated WAS with digesters operated at 35°C and
86 J.-G. Lin, C.-N. Chang, S.-C. Chang
five different hydraulic retention times, 20, 13, 10, 7.5 and 5 days. Pretreatment with sodium hydroxide improved the volatile solid reduction by 25-35% and increased gas production by 29-112% over the control sludge samples undergoing no alkaline treatment.
The overall objective of this study was to examine the ability of the single-stage high-rate anaerobic digester to stabilize WAS following alkaline chemical pretreatment. Organic removal, gas production, and sludge dewaterability were examined.
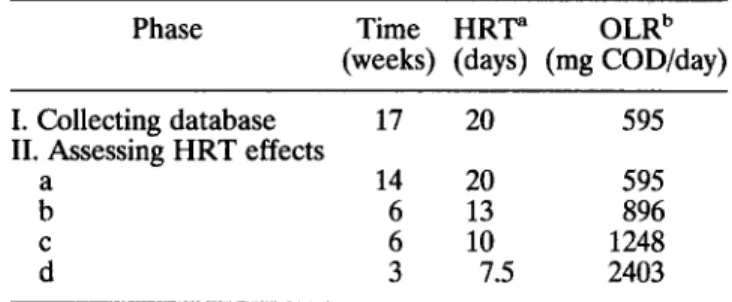
Table 1. Changes in organic loading rate and HRT during the experimental period
Phase Time HRT ~ OLR b (weeks) (days) (mg COD/day) I. Collecting database 17 20 595 II. Assessing HRT effects
a 14 20 595
b 6 13 896
c 6 10 1248
d 3 7.5 2403
aHRT, hydraulic retention time. bOrganic loading rate.
METHODS
Sludge collection and preparation
The waste activated sludge (WAS) samples were collected weekly throughout the year from the final clarifier of the Min-Shen Sewage Plant, at which inflows and operating parameters fluctuated. This plant uses a conventional activated sludge process, consisting of primary clarification, aeration, and final clarification. The average flow is 13500 M3/day, and the sludge retention time of the activated sludge process is 3 days with the food to microorganisms ratio (F/M) of 0.77kg BOD/kg MLSS/day (BOD = biochemical oxygen demand; MLSS = mixed liquid suspended solid). Collecting samples at different times reflects the variability of feed sludge characteristics. However, after collec- tion, the sludge was adjusted to give a concentration of 10000 mg/l (1%) total solids (TS) for consistent experiment.
Sludge solubilization
After preparation, the sludge (10000 mg/l TS) was divided into four portions. The first portion, the control sludge, was returned to the refrigerator for storage. The second and third portions were solubi- lized by adding sodium hydroxide (NaOH) at 20 and 40meq/1, respectively. The fourth portion was adjusted to give a final sludge concentration of 2% TS, and then solubilized by adding NaOH at 20 meq/l. The solubilizations were carried out in 1000ml batch reactors at ambient temperature (25°C) under anoxic conditions for 24 h. A stirring magnet bar was used to ensure sufficient mixing to prevent the sludge from settling and disperse the alkali added. After solubilization, the pretreated sludges were returned to the refrigerator until use.
Experimental apparatus
Four 1-1 laboratory-scale single-stage high-rate digesters were employed. Each reactor was a 1000ml reagent bottle. The top was efficiently sealed air-tight by a rubber stopper. Each reactor was mounted on a magnetic stirrer. A Teflon-coated stirring magnet was used and the stirring speed was maintained so that there was sufficient mixing to
keep the sludge from settling and to evenly distri- bute the sludge fed. The reactors were maintained at 35°C in an incubator. The gas produced from each reactor was collected in a measuring tube over saturated salt solution with 5% H2504. Sludge was introduced into the four reactors once per day from a glass graduated cylinder, following which the effluent sludge was withdrawn by gravity from each reactor.
Experimental plan
Changes in hydraulic retention time (HRT) and corresponding organic loading rates during the entire experimental period are shown in Table 1. The experimental plan for the project consisted of two phases. Phase I of the project lasted 4 months. This phase included the development of a balanced micro-organism population in the reactors and establishment of a stabilized operation. The experi- mental procedures were also refined during this period. Initially, each reactor was filled with an anaerobic seed sludge. All four reactors were then fed an untreated sludge (1% TS) and operated at a 20-day H R T and 35°C to allow the biological processes to stabilize with respect to volatile solids (VS) and chemical oxygen demand (COD) removals and gas production rates.
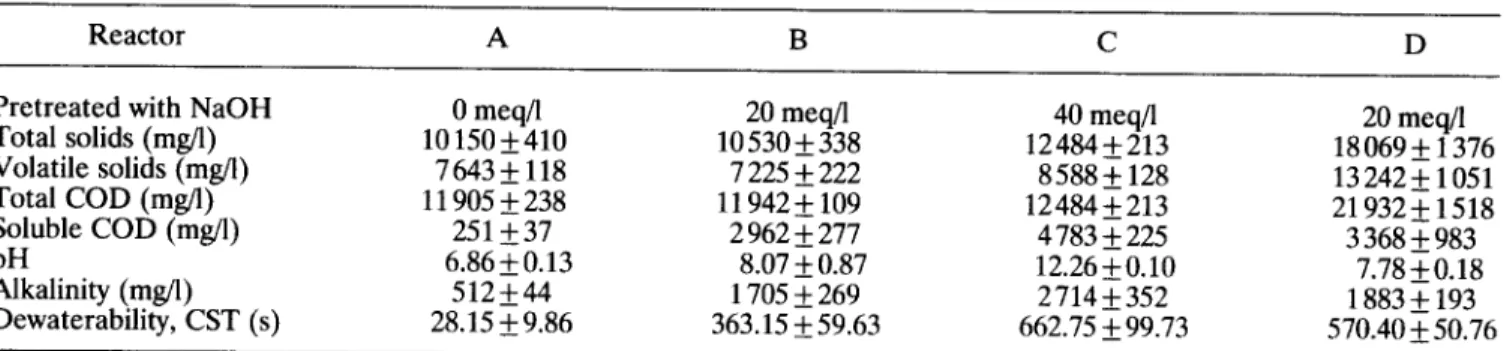
Phase II of the project lasted 7 months. This phase was designed to determine the effect of H R T on the performance of the reactors. At the begin- ning of this phase, reactor B received the sludge of 1% TS solubilized with NaOH at 20 meq/l, reactor C received the sludge of 1% TS solubilized with NaOH at 40meq/1, and reactor D received the sludge of 2% TS solubilized with NaOH at 20 meq/l. The feed sludge for reactor A was left unchanged as a control. All four reactors were fed these same sludges for the duration of the project. The charac- teristics of the feed sludges are presented in Table 2. The temperature was also maintained at 35°C during this phase. After the reactors had reached steady state, i.e., their VS and COD removal rates and gas production rates remained essentially constant with time, data collection began. After sufficient data
Digestion of activated sludge after NaOH treatments
Table 2. Average a characteristics of feed sludges
87
Reactor A B C D
Pretreated with NaOH 0 meq/1 20 meq/1 40 meq/l 20 meq/l
Total solids (mg/1) 10150___ 410 10 530___ 338 12 484 + 213 18 069___ 1376 Volatile solids (mg/l) 7 643 ___ 118 7 225 + 222 8 588 + 128 13 242 + 1051 Total COD (mg/l) 11905 +238 11942+ 109 12484+213 21932-1-1518 Soluble COD (mg/1) 251 + 37 2 962___ 277 4 783 + 225 3 368__+ 983 pH 6.86 + 0.13 8.07 __+ 0.87 12.26 + 0.10 7.78 _ 0.18 Alkalinity (mg/1) 512 ___ 44 1705 _ 269 2 714 ___ 352 1883 + 193
Dewaterability, CST (s) 28.15 -I- 9.86 363.15 -I- 59.63 662.75 _ 99.73 570.40 -I- 50.76 aAverages of four analyses.
were obtained at the 20-day HRT, the loading rate was increased to the 13-day HRT. After the organic removal rates and gas production had stabilized, data were again collected. This process was repeated for the 10- and 7.5-day HRTs.
Experimental analyses
The reactor pH, temperature, and gas production were monitored daily. The effluent total and volatile solids (TS and VS), and total and soluble COD were monitored at least every 2 days. Other parameters that were monitored less frequently included organic acids, alkalinity, and gas composition. Most experi- mental analyses followed the procedure recom- mended in Standard Methods (1992) (18th edition). The sludge dewaterability was examined by capillary suction time (CST). The instrument for this purpose was a Capillary Suction Time Filterability Test (Model 200, Triton Electronics Ltd, Gt. Dunmon, Essex, UK). This device consists of a timer, a sludge holder (18-mm cylinder), and blotter paper (Whatman No. 17, size 6.0 cm × 9.8 cm).
RESULTS A N D DISCUSSION
The major parameters measured were influent and effluent strength, using both solids (TS and VS) and COD as indicators, influent and effluent soluble COD, and gas production. Results of tests of anaerobic digestion of sludge pretreated with sodium hydroxide are summarized in Table 3, which compares the performance of the digesters.
Sludge characteristics
As organic material in pretreated sludge was hydrol- ysed, the soluble fraction of feed sludge was greater in reactors B, C and D than in reactor A. The soluble fraction (represented by soluble COD) of feed sludge into reactor A was in the range 2-10%, into reactor B 22-27%, into reactor C 36-40%, and into reactor D 10-20%. As bacteria utilized the hydrolytic products and as anaerobic digestion proceeded in reactors B, C and D, the digested sludges [Fig. 2(b)] contained a smaller soluble fraction than the feed sludges [Fig. 2(a)]. The soluble fraction of digested sludge from reactor A was 5-8%, from reactor B 6-12%, from reactor C
Table 3. Summary of digester performances
Digesters A B C D A B C D A B C D A B C D HRT (days) VS removal (%) COD removal (%) Gas composition CH4 (%) co2 (%) Gas production rate (l/mS/day) CH4 production rate (I/mS/day) CH4 production/VS removed (1 gas/kg VS) c n 4 production/COD removed (1 gas/kg COD) Total solids (mg/1) Volatile solids (rag/l) Total COD (mg/l) Soluble COD (mg/l) pH Alkalinity (mg/l) Dewaterability, CST (s) 20 20 20 20 13 13 13 13 10 10 10 10 7.5 7.5 7.5 7.5 35 36 42 45 35 37 39 24 28 31 31 36 19 26 33 45 39 47 47 47 38 46 47 37 38 46 51 52 21 39 37 47 71 76 84 74 72 76 86 75 73 77 84 74 74 77 86 74 12 11 2 15 16 14 2 18 14 9 3 18 12 12 4 19 83 113 113 164 123 150 146 282 158 210 205 416 133 258 247 514 59 86 86 121 89 114 126 212 115 162 172 308 98 199 212 380 437 688 531 432 422 558 495 927 544 726 642 600 506 753 549 449 253 307 332 247 261 264 272 370 251 297 275 255 300 325 343 264 7485 7560 8555 11690 7110 7460 9005 12785 7320 7647 9965 13585 8340 8460 10000 11860 4930 4485 4945 6745 5080 4535 5221 9335 5415 4980 5850 8953 6140 5540 5880 7860 7249 6278 6510 11184 7304 6485 6649 12830 7646 6459 6128 11228 9312 7311 8012 12356 387 390 648 544 530 740 1 154 1408 422 798 1290 1249 745 788 1724 1 100 7.07 7 . 4 1 7.84 7.41 7 . 1 8 7 . 4 8 7.96 7.45 7 . 0 9 7.44 7.85 7.45 7 . 1 1 7.41 7.78 7.55 1440 2332 2976 3080 1699 2976 3870 3635 1427 3100 3848 4317 1395 2776 3683 3844 34 148 209 263 55 214 274 389 27 160 227 299 38 167 254 291
88 J.-G. Lin, C.-N. Chang, S.-C. Chang
10-22%, and from reactor D 5-11%. The soluble fraction of digested sludge in reactor A was slightly greater than that of the feed sludge, as the hydrol- ysed products were produced slowly by enzymes; hydrolysis is the limiting step of anaerobic digestion of WAS, but the degradable organic material of hydrolysed products was utilized quickly, and the refractory material from hydrolysed products accumulated gradually.
Organic removal
The reactors had varied rates of removal of substrate in terms of COD and VS. The reactors fed with pretreated sludge had substrate removed more rapidly. As for COD removal, reactor A was in the range 21-39%, reactor B 39-47%, reactor C 37-51% and reactor D 37-52%. Pretreatment offers little advantage with prolonged retention if the objective is to obtain greater volumetric removal of organics. However, if greater stabilization is required, solubilization increases the removal. In contrast, at the shorter periods of retention, solubili- zation is required to attain a satisfactory organic stabilization. At 7.5-day HRT, the pretreatment resulted in at least twice the organic stabilization measured as removal of COD.
The fractional improvement of digester perform- ance is shown in Table 4. Improvement in VS removal of reactor C attained 72% over reactor A at 7.5 days of retention. For the same period, COD removal improved 76%. Comparison of reactors B, C and D showed that organic removal increased as the concentration of either NaOH or sludge solids increased. The performance of reactor D was better than that of reactor C; e.g., increasing the concen- tration of sludge solids proved more effective for
organic removal than increasing the concentration of NaOH. Solubilization by thermal pretreatment increased COD removals by 18-22% over sludge that lacked thermal treatment (Haug et al., 1983).
The digesters fed with autoclaved sludge showed 30-56% greater organic destruction than those fed with intact activated sludge (Pavlostathis and Gossett, 1988). Pretreatment with sodium hydroxide improved VS reduction in the range 25-35% over no pretreatment (Ray et al., 1990). By thermochem-
ical treatment, a maximum of 85% organics was converted to methane compared with approx. 53% in non-treated controls (Stuckey and McCarty, 1978).
Gas production and methane yield
The average content of methane in gas was 72%, 76%, 85%, and 74% for reactors A, B, C and D, respectively. The reactor fed with pretreated sludge had greater methane, and methane increased as the concentration of NaOH increased. The rate of gas production also increased when feed sludge was pretreated with NaOH; the reason was that pretreated sludge hydrolysed much organic material into solution, and the anaerobic digestion process used it immediately; hence reactors B and C had greater rates of gas production than reactor A. The influent substrate concentration of reactor D was the greatest and caused a greater rate of gas production than of the others. The fractional increase in gas production of reactors B, C and D was 22-94%, 19-86%, and 106-287%, respectively. The fractional increase of methane in reactors B, C and D was 29-102%, 42-116% and 106-287%, respectively. Thermal pretreatment resulted in a 30% increase in production of digestion gas (Hiraoka et al., 1984).
Table 4. Summary of improvements in digester performances
Retention Reactor Reactor Percent a Reactor Percent a Reactor Percent a
time (days) A B increase C increase D increase
VS removal (%) 20 35 36 1 42 19 45 29 13 35 37 6 39 11 24 - - 10 28 31 10 31 12 36 29 7.5 19 26 37 33 72 45 133 COD removal (%) 20 39 47 21 47 20 47 20 13 38 46 23 47 26 37 - - 10 38 46 22 51 35 52 38 7.5 21 39 84 37 76 47 123 Gas production
(l/m 3)
20 83 113 36 113 36 164 98 13 123 150 22 146 19 282 129 10 158 210 33 205 30 416 162 7.5 133 258 94 247 86 514 286 --, Negative value.Digestion of activated sludge after NaOH treatments 89 Pretreatment with sodium hydroxide increased gas
production by between 29 and 112% over the control sludge (Ray et al., 1990).
Reactors B and C had greater fractional increases of methane production than gas production, coinciding with the fact that reactors B and C had greater proportions of methane in the gas (Table 3). The fractional increase of methane and gas produc- tion was almost the same for reactor D, which indicated that the main gas composition did not vary much compared with reactor A. All pretreated sludges increased the fraction of gas and methane production as H R T decreased. The methane production per gram of VS destroyed in this project averaged 580 ml per gram of VS; methane produc- tion per gram of COD destroyed averaged 290 ml per gram of COD. Literature values for methane gas production vary considerably, but representative values are in the range 490-730 ml methane per gram VS destroyed (Metcalf and Eddy, 1991). For 1 g of COD removed, the theoretical methane produced would be 350 ml at standard temperature and pressure (STP).
pH Values and alkalinity
The pH of the feed sludge varied considerably for the four reactors, as the feed sludges of reactors B, C and D were pretreated with NaOH (Table 2). The pH of the digested sludge of the four reactors was almost the same (Table 3). The pH of all four reactors remained relatively constant for varied HRT, although the feed sludge of reactor C had an extreme pH. The alkalinity of the four reactors of feed and digested sludges varied greatly, increasing as the concentration of NaOH increased. The alkalinities of the feed sludges are shown in Table 2, and of digested sludges in Table 3. Compared with the feed sludge and digested sludge of the four reactors, the alkalinity in all increased during anaerobic digestion.
Effects of digestion on dewaterability
The CSTs for feed sludges and digested sludges of reactors A, B, C and D at different H R T are shown in Table 2 and Table 3. In a previous study, Lin et
al. (1996) found that CST had a large correlation coefficient of 0.92 with specific resistance filtration (SRF). The correlation between CST and SRF was:
SRF (se/g) = 6.55 × 10⁸ CST (s) - 1.8 × 1 0 9 for waste activated sludge collected from the Min-Shen Sewage Plant. Anaerobic digestion alters the distribution of particle size in sludges. When digestion works well, particles of all sizes are destroyed, but there is a preferential removal of particles of small sizes, a consequent loss of specific surface area, and therefore an improvement in dewaterability (Lawler et al., 1986). The dewater- ability of digested sludge was improved in reactors B, C and D. The CST values of digested sludges
were in the range 148-389s, whereas undigested sludges were 309-735 s. For reactors B, C and D, the best dewaterability of digested sludge occurred at 20-day HRT. The CST of digested sludge of reactor A was in the range 27-55 s, greater than that of feed sludge. Karr and Keinath (1978) reported that anaerobically digested sludge was more difficult to dewater, measured by CST and specific resist- ance, than either primary or activated sludge.
CONCLUSION
Four reactors were employed to evaluate the ability of a single-stage high-rate digester to treat waste activated sludge at retention tomes of 20, 13, 10 and 7.5 days at 35°C. Reactor A was fed with untreated WAS (1% TS). The other three reactors B, C and D were respectively fed with WAS (1% TS) pretreated with NaOH (20 meq/l), WAS (1% TS) pretreated with NaOH (40meq/1), and WAS (2% TS) pretreated with NaOH (20meq/l). The perfor- mances of reactors B, C and D, for COD and VS removal, and gas production were superior to that of reactor A. The dewaterability of digested sludge was improved in reactors B, C and D.
ACKNOWLEDGEMENTS
We thank the National Science Council, Republic of China for financial support (Grant NSC 83-0410-E-009-070).
REFERENCES
Alleman, J. E., Kim, B. J., Quivey, D. M. & Wquihua, L.O. (1994). Alkaline hydrolysis of munitions-grade nitrocellulose. Wat. Sci. Tech., 30, 63-72.
Gossett, J. M., Stuckey, D. C., Owen, W. F. & McCarty, P. L. (1982). Heat treatment and anaerobic digestion of refuse. J. Environ. Eng. Div., Proc., ASCE, 108, 437-454. Haug, R. T., LeBrun, T. J. & Tortorici, L. D. (1983).
Thermal pretreatment of sludges - - a field demonstra- tion. J. Water Pollut. Control Fed., 55, 23-34.
Hiraoka, M., Takeda, N., Sakai, S. & Yasuda, A. (1984). Highly efficient anaerobic digestion with thermal pretreatment Wat. Sci. Technol., 17, 529-539.
Karr, P. R. & Keinath, T. M. (1978). Influence of particle size on sludge dewaterability. J. Water Pollut. Control
Fed., 50, 1911-1930.
Lawler, D. F., Chung, Y. J., Hwang, S.-J. & Hull, B. A. (1986). Anaerobic digestion: effects on particle size and dewaterability. J. Water Pollut. Control Fed., 58, 1107-1117.
Li, Y.-Y. & Noike, T. (1992). Upgrading of anaerobic digestion of waste activated sludge by thermal pretreat- ment Wat. Sci. Technol., 26, 857-866.
Lin, J.-G., Chang, C.-N. and Hung, H.-C. (1996). Chemical conditioning for removal of water and phosphate from enhanced sludge. In Chemistry for the
protection of the environment 2, ed. Pawlowski, L., Lacy, W. J., Uchrin, C. G. and Dudzifiska, M. R., Plenum Press, New York. pp. 223-232.
90 J.-G. Lin, C.-N. Chang, S.-C. Chang
Metcalf and Eddy, Inc. (1991). Wastewater engineering:
treatment, disposa~ reuse, 3rd edn. McGraw Hill, New
York.
Pavlostathis, S. G. & Gossett, J. M. (1985). Modeling alkali consumption and digestibility improvement from alkaline treatment of wheat straw. Biotechnol. Bioeng,, 27, 345-354.
Pavlostathis, S. G. & Gossett, J. M. (1988). Preliminary conversion mechanisms in anaerobic digestion of biological sludge~ J. Environ. Eng. Div., ASCE, 114, 575 -592.
Rajan, R. V., Lin, J.-G. & Ray, B. T. (1989). Low-level chemical pretreatment for enhanced sludge solubiliza- tion. Res. J. Water Pollut. Control Fed., 61, 1678-1683. Ray, B. T., Rajan, R. V. & Lin, J.-G. (1990). Low-level
alkaline solubilization for enhanced anaerobic digestiort
Res. J. Water Pollut. Control Fed., 62, 81-87.
Samson, R. & Leduy, A. (1983). Influence of mechanical and thermochemical pretreatments on anaerobic diges- tion of Spirulina maxima algal biomas~ Biotechnol. Len., 5, 671-676.
Sawayama, S., Inoue, S., Yagishita, T., Ogi, T. & Yokoyama, S.-Y. (1995). Thermochemical liquidization anaerobic treatment of dewatered sewage sludge. J.
Ferment. Bioeng., 79, 300-302.
Standard methods for the examination of water and waste- water (1992). 18th edn. Am. Public Health Assoc.,
Washington, D.C.
Stuckey, D. C. & McCarty, P. L. (1978). Thermochemical pretreatment of nitrogenous materials to increase methane yield. Biotechnol. Bioeng. Syrup.,, 8, 219-233. Woodard, S. E. & Wukasch, R. F. (1994). A hydrolysis/
thickening/filtration process for the treatment of waste activated sludge. Wat. Sci. Technol., 30, 29-38.