Crossed molecular beam studies on the reaction dynamics of O ( D 1 ) + N 2 O
Yu-Ju Lu, Chi-Wei Liang, and Jim J. Lin
Citation: The Journal of Chemical Physics 125, 133121 (2006); doi: 10.1063/1.2202828 View online: http://dx.doi.org/10.1063/1.2202828
View Table of Contents: http://scitation.aip.org/content/aip/journal/jcp/125/13?ver=pdfcov Published by the AIP Publishing
Articles you may be interested in
Dynamics of reactions O ( D 1 ) + C 6 H 6 and C 6 D 6 J. Chem. Phys. 129, 174303 (2008); 10.1063/1.2994734
Reaction dynamics of O H + ( 3 ) + C 2 H 2 studied with crossed beams and density functional theory calculations
J. Chem. Phys. 125, 133117 (2006); 10.1063/1.2212417
Imaging photon-initiated reactions: A study of the Cl ( P 3 2 2 ) + CH 4 HCl + CH 3 reaction J. Chem. Phys. 123, 094301 (2005); 10.1063/1.2009737
Dynamics of the O ( 1 D )+ CO 2 oxygen isotope exchange reaction J. Chem. Phys. 119, 8213 (2003); 10.1063/1.1618737
Experimental and quantum mechanical study of the H+D 2 reaction near 0.5 eV: The assessment of the H 3 potential energy surfaces
J. Chem. Phys. 108, 6160 (1998); 10.1063/1.476060
Crossed molecular beam studies on the reaction dynamics of O
„
1D
…+N
2O
Yu-Ju Lu and Chi-Wei Liang
Institute of Atomic and Molecular Sciences, Academia Sinica, Taipei 106, Taiwan and Department of Chemistry, National Taiwan University, Taipei 106, Taiwan
Jim J. Lina兲
Institute of Atomic and Molecular Sciences, Academia Sinica, Taipei 106, Taiwan
and Department of Applied Chemistry, National Chiao Tung University, Hsinchu 300, Taiwan
共Received 21 March 2006; accepted 14 April 2006; published online 5 October 2006兲
The reaction of oxygen atom in its first singlet excited state with nitrous oxide was investigated under the crossed molecular beam condition. This reaction has two major product channels, NO + NO and N2+ O2. The product translational energy distributions and angular distributions of both
channels were determined. Using oxygen-18 isotope labeled O共1D兲 reactant, the newly formed NO
can be distinguished from the remaining NO that was contained in the reactant N2O. Both channels
have asymmetric and forward-biased angular distributions, suggesting that there is no long-lived collision complex with lifetime longer than its rotational period. The translational energy release of the N2+ O2 channel 共fT= 0.57兲 is much higher than that of the NO+NO channel 共fT= 0.31兲. The
product energy partitioning into translational, rotational, and vibrational degrees of freedom is discussed to learn more about the reaction mechanism. The branching ratio between the two product channels was estimated. The 46N2O product of the isotope exchange channel, 18O +44N2O→16O +46N2O, was below the detection limit and therefore, the upper limit of its yield was estimated to
be 0.8%. © 2006 American Institute of Physics.关DOI:10.1063/1.2202828兴
I. INTRODUCTION
There is considerable experimental1–13 and
theoretical14–25 attention on the reaction dynamics of
O共1
D兲+N2O. The reaction has two major product channels
which are highly exothermic: O共1
D兲 + N2O
→ NO + NO, ⌬H0 K0 = − 81.9 kcal/mol, 共R1兲
→N2+ O2共1⌬兲, ⌬H0 K0 = − 102.3 kcal/mol. 共R2兲
Both channels are fast 共close to the gas kinetic limit兲 and
without potential energy barriers. 共R1兲 is thought to be the primary source of NO in the upper stratosphere, where
highly reactive O共1
D兲 is produced by UV photolysis of
ozone. Because it is relatively more feasible to detect NO by spectroscopic methods such as laser induced fluorescence 共LIF兲, resonance enhanced multiphoton ionization 共REMPI兲,
and Fourier-transform infrared 共FT-IR兲 emission
spectros-copy, most experimental studies have focused on 共R1兲. To
our knowledge, there is no experimental literature on the reaction dynamics of共R2兲 so far.
共R1兲 produces two NO molecules. Conventionally we
call the newly formed NO that contains the incoming O共1D兲
atom the new NO and call the remaining NO the old NO.
The exothermicity of共R1兲 corresponds to 17 quanta of NO
vibrational energy. Early studies by the Simons group3–5
in-vestigated 共R1兲 by LIF technique, especially
Doppler-resolved, polarized LIF probing of NO products from veloc-ity aligned O共1D兲 reactant4,5 in cell conditions. The internal state-resolved translational energy distribution was analyzed from the Doppler profiles. They concluded that besides a complex mechanism producing intermediate NO vibrational levels共= 1 – 15兲, a substantial fraction of 共R1兲undergoes a stripping mechanism. In the stripping mechanism, the old NO is left rotationally and translationally cold共as a specta-tor兲 while the newly formed NO is vibrationally very hot and
forward scattered. In particular, the new NO共= 16, 17兲
+ old NO共= 0兲 channel demonstrates the stripping
mechanism.5
Kajimoto and co-workers have studied 共R1兲 by LIF
spectroscopy.6–10They measured the vibrational distributions
of the new and old NO by using isotope labeled 18O共1D兲
reactant.7The new NO has a bimodal vibrational distribution and is vibrationally hotter than the old NO. The old NO still has a considerable population in high vibrational levels. They suggested a short-lived complex mechanism in which the energy redistribution between the new and old NO mol-ecules is quite efficient.7The same group also found that the
vibrational population of NO in = 11– 17 decreases
mono-tonically over this range,8which would not be expected if the stripping mechanism is significant. A recent work measured the rotational state distribution of NO 共= 0 , 1 , 2兲 products. The rotational temperature was found to be very high and close to the prediction of phase space theory.9 FT-IR 共Ref.
11兲 and, recently, time-resolved FT-IR 共Ref. 12兲 techniques
have also been used to measure the NO vibrational popula-tion of共R1兲, resulting in similar NO vibrational distributions.
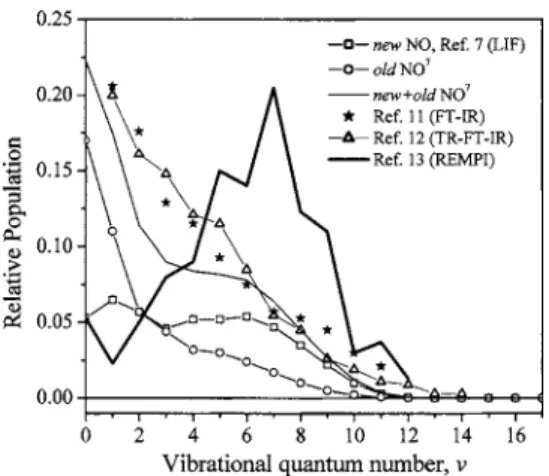
Figure 1 shows a summary of the presently available NO
a兲Author to whom correspondence should be addressed. Electronic mail: jimlin@gate.sinica.edu.tw
0021-9606/2006/125共13兲/133121/8/$23.00 125, 133121-1 © 2006 American Institute of Physics
vibrational populations measured by a few groups. While most cell experiments show that the total NO vibrational
distribution is peaked near = 0, the Houston group13
re-ported that the distribution is peaked at = 7. They used a single molecular beam technique to probe the rotationally
cooled but vibrationally unquenched NO product of共R1兲by
1 + 1
⬘
REMPI. The average vibrational energy is between24 000 and 28 000 cm−1, which is much greater than other
literature values.13
There are several ab initio calculations on the potential
energy surface 共PES兲 of 共R1兲 and 共R2兲. Last et al.14 used
Moller-Plesset method to calculate the minimum energy paths of 共R1兲and共R2兲. The lowest 1A
⬘
surface is attractivefor both 共R1兲 and 共R2兲, while electronic excited surfaces
might be unimportant at low collision energies. González
et al.15 used high level CASPT2 method to calculate the
minimum energy paths near the entrance regions of共R1兲and
共R2兲. Reaction intermediates and transition states have been located by CASSCF method and single point energies were refined by CASPT2 method. A few intermediates were found
for 共R1兲, such as trans-ONNO, cis-ONNO, etc. Although
some local minima have been located for共R2兲by CASSCF
method, they are likely only artifacts and do not exist at the
CASPT2 level of theory.15,16 Recently, Takayanagi and
Akagi17have constructed a global potential energy surface at CASPT2/cc-PVDZ level of theory. On this surface, there is a
deep well at the entrance region of 共R1兲, but there is no
significant well for 共R2兲. From the CASPT2 global PES
共Ref.17兲 and minimum energy paths,15it can be seen that the preferred orientations of the attaching O共1D兲 atom are quite
different for共R1兲and共R2兲.
Some theoretical investigations have focused on NO dimers or N2O2 isomers. Low-lying electronic states of NO
dimers have been investigated using MRCI and CASPT2 methods.18Structures and energies of various N2O2 isomers
have been calculated by ab initio and density functional methods.19
Quasiclassical trajectory 共QCT兲, transition state theory 共TST兲, and quantum-classical calculations have been carried out on empirical surfaces as well as on ab initio potential energy surfaces.15–17,20–24 A quantum-classical wave packet
calculation20 has been performed on the global CASPT2
PES.17 The product branching ratio between共R1兲 and共R2兲
shows a significant dependence on the initial orientation angle, similar to a previous classical trajectory result17using the same surface. This initial orientation effect may explain
why the product rovibrational distribution of 共R1兲 from a
laser-initiated half reaction experiment6 is quite different from the full-collision case. The translational energy depen-dence has also been studied.17,20 Furthermore, product rota-tional distributions of low vibrarota-tional NO 共= 0 , 1 , 2兲 levels
have been calculated by QCT methods9 on this surface.
While a “half-collision” QCT calculation, in which statistical distribution at the reaction intermediate is assumed, well re-produces the experimental rotational distributions, a “full-collision” QCT calculation made a poor prediction with too much rotational excitation. It may be due to poorly repro-duced couplings between the stretching and bending/
torsional motions on the PES.9 A reduced dimensionality
calculation,21 in which the three stretching motions were
fully treated at fixed initial and final orientation angles, shows that the new NO product is vibrationally hotter than the old NO.
N2O is isoelectronic with CO2. Recent crossed molecu-lar beam studies26,27show that CO2exchanges isotopes with
O共1D兲 atom very efficiently through two distinct
mecha-nisms: a conventional electronic quenching isotope
ex-change, e.g., Q共1D兲+CO2→COQ+O共3P兲, and a newly
found nonquenching isotope exchange, e.g., Q共1D兲+CO2
→COQ+O共1
D兲. Here Q denotes the 18O isotope. Ab initio PES and RRKM calculations well support these two
mechanisms.28 It is, therefore, reasonable to imagine that
N2O could undergo an analogous isotope exchange with
O共1
D兲 atom,
Q共1D兲 + N2O→ N2Q + O共3P/1D兲. 共R3兲
The yield of 共R3兲 may affect isotope modeling of
strato-spheric N2O. There are debates about the significance of
共R3兲 in the atmospheric isotope modeling.29–32
There are other energetically allowed product channels, such as N + NO2, N2+ 2O共3P兲, and O共3P兲+N2O, which have
very minor yields.33Recently, the yield of electronic
quench-ing of O共1D兲 by N
2O has been determined to be
0.04± 0.02.34
In this report, we investigated the reaction dynamics of
共R1兲and共R2兲by the crossed molecular beam method.
Prod-uct translational energy distributions and angular
distribu-tions of 共R1兲 and 共R2兲 were measured. Possible reaction
mechanisms are discussed by comparing the product energy partitioning into vibrational, rotational, and translational de-grees of freedom. We also searched for the product of共R3兲.
II. EXPERIMENT
Most features of the crossed molecular beam apparatus have been described previously.27 Only the relevant part of
the experimental setup is mentioned here. An O共1
D兲 atomic
beam was generated by laser photolysis of a skimmed O2
molecular beam at 157.6 nm, O2+ h共157.6 nm兲→O共1D兲
+ O共3
P兲. The 30–50 mJ output of a F2 excimer laser
共Lambda Physik, LPX 210i, F2 version兲 was focused by a
FIG. 1. Summary of available NO vibrational populations of共R1兲measured by various groups.
133121-2 Lu, Liang, and Lin J. Chem. Phys. 125, 133121共2006兲
special cylindrical-spherical MgF2 lens to a spot size of 3
⫻3 mm2. Isotope labeled O
2 共18O 97%兲 was used when an
18O共1
D兲 atomic beam was needed. The O共1D兲 atomic beam
had a very narrow velocity distribution共⬍2%兲 and an
an-gular divergence of about ±4° 关full width at half maximum
共FWHM兲兴. Besides O共1D兲 atoms, this atomic beam has an
equal amount of O共3
P兲 atoms. The reactivity of O共3P兲 atom
toward N2O is much lower than that of O共1D兲 atom.35 There-fore it is safe to ignore contributions from the O共3P兲 atoms
in the atomic beam.
A N2O molecular beam was generated by expanding
neat N2O gas through a fast pulsed valve 共Even-Lavie
valve兲.36
A sharp edge skimmer共Beam Dynamics Inc., 2 mm
diameter兲 was used to define the angular divergence to about
±1.5° 共FWHM兲. This pulsed valve produced a narrow pulse
width of⬃30s共FWHM, for N2O gas pulse at the
interac-tion region兲, which significantly reduced the effusive back-ground gases from the beam source.
Two reactant beams crossed each other at a 90° angle. In the case of18O共1D兲共2160 m/s兲+N2O共660 m/s兲 experiment, the collision energy was 7.8 kcal/ mol. Scattered products traveled 24 cm and were then detected by a time-resolved quadrupole mass spectrometer. The electron impact ionizer of the mass spectrometer is located in a triple differentially
pumped ultrahigh vacuum chamber 共10−12torr兲 to reduce
background from residual gases and from the scattering
chamber. Time-of-flight 共TOF兲 spectra of the nascent
prod-ucts were recorded by a multichannel scalar共EG&G, Turbo
MCS兲 with 2s time bins. Product velocity distributions
were derived from the TOF spectra. Angular distribution was measured by rotating the whole detector. Trial product trans-lational energy distribution P共ET兲 and angular distribution
P共兲 in the center-of-mass 共CM兲 frame were input to a
for-ward convolution computer program to simulate the TOF spectra in the laboratory frame. The P共ET兲 and P共兲 were
adjusted iteratively until a satisfactory fit to the experimental TOF spectra and angular distribution was obtained. Instru-mental functions used in the program were properly
deter-mined by a series of calibration experiments, such as O2
photolysis at 157.6 nm, O + Ne/ Ar elastic scattering, etc.
III. RESULTS AND DISCUSSION
A. NO + NO channel and N2+ O2channel
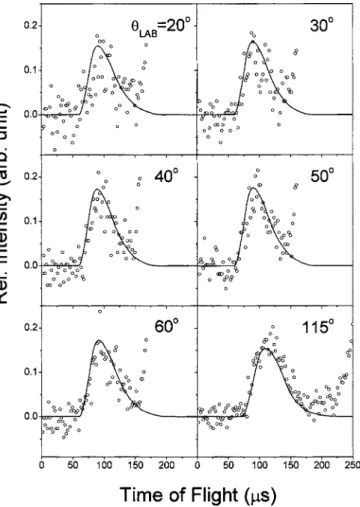
Figure2shows experimental TOF spectra of the mass 32
product from a crossed molecular beam reaction of
18O共1
D兲+N2O→32NO +30NO. Using an isotope labeled
18O共1D兲 beam, we can distinguish the newly formed 32NO
from the old 30NO. The open circles represent the
experi-mental data and the solid lines represent the fit simulated by the forward convolution program. Here the 0° laboratory
FIG. 2. Experimental TOF spectra of mass 32 probing the product from 18O共1D兲+N2O→32NO +30NO reaction at several laboratory angles. Open circles: data, solid line: fit.
FIG. 3. Experimental TOF spectra of mass 30 probing the product from 18O共1D兲+N2O→32NO +30NO reaction at several laboratory angles. Open circles: data, solid line: fit.
angle is defined as the direction of O共1D兲 velocity vector.
The N2O velocity is at 90° laboratory angle. The laboratory
angle of the center of mass is about 37°. In Fig.2, the TOF peaks corresponding to formation of the new NO show higher intensity at smaller laboratory angles. Some minor
background that may come from N2O molecular beam shows
up at larger laboratory angles, but it is much slower than the
signal peak. Figure3shows TOF spectra of mass 30, which
represent the old NO product. Dissociative ionization of
scat-tered N2O in the electron impact ionizer produces large
background at TOF longer than ⬃150s. Fortunately this
background peak is slower and does not overlap with the signal peak. We have checked TOF spectra at mass 44
共N2O+兲 to confirm the source of background. This
ground also makes the TOF spectra noisier. Despite the back-ground, we can clearly see that the old NO peaks have higher intensity at larger laboratory angles.
In the center-of-mass共CM兲 frame, the new NO and old
NO have to be momentum matched, which means that they must fly in opposite directions. For example, a new NO fly-ing in the forward direction 共CM= 0 °兲 is matched with an old NO flying in the backward direction共CM= 180°兲. Here, the forward direction is defined as the direction of the O共1
D兲
velocity vector in the CM frame. With the TOF spectra of both new and old NO at wide-ranging laboratory angles, we can fit the product translational energy distribution P共ET兲 and
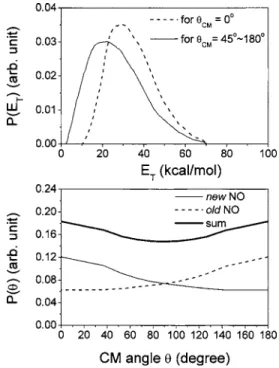
angular distribution P共兲 in the CM frame. The result is plot-ted in Fig. 4. First, we tried to fit the data with a single
P共ET兲, but we found that the new NO is slightly faster in the
forward direction than at other CM. Therefore we used a
faster P共ET兲 in the forward direction for the new NO 共dashed
line in Fig. 4 upper兲 and a slower P共ET兲 for CM
= 45° – 180°. For CM between 0° and 45°, an interpolated
P共ET兲 between the two P共ET兲’s was used. The angular
dis-tribution is shown in Fig. 4. By momentum matching, the
P共兲 of the new NO and that of the old NO must be mirror
images. The summation of the two P共兲’s was used to fit
mass 30 data from an unlabeled experiment, 16O共1D兲+N2O
→30
NO +30NO. As expected, the fitting 共not shown兲 is as
nice as those in Figs.2 and3. In Fig.4, we can see that the
P共兲 for the new NO is quite broad and forward biased.
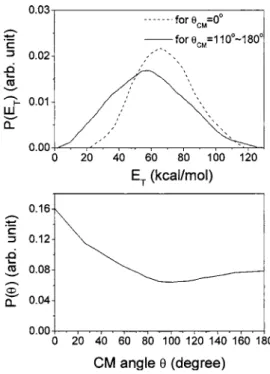
For共R2兲, the O2 product was observed at mass 34 from
the reaction of 18O共1D兲+N2O→34O2+ N2. The data and fit
are shown in Fig.5. The N2 product could not be measured
due to high background at mass 28 from residual CO gas in
the detector chamber. Here we used 18O labeled reactant to
avoid background from residual O2 gas in the scattering
chamber. Compared with mass 32共the new NO product兲, the
mass 34 signal 共18O16O兲 has a similar angular distribution, that is, higher intensity at smaller laboratory angles. Regard-ing the TOF peaks, the mass 34 is faster and sharper than the mass 32. The P共ET兲 and P共兲 of 共R2兲 are shown in Fig. 6.
Analogous to 共R1兲, a faster P共ET兲 was used at the forward
direction, and the P共兲 is broad and forward biased. The
P共ET兲’s of 共R2兲 are peaked at ⬃60 kcal/mol, much higher
than those of 共R1兲 共20–30 kcal/mol兲. Although 共R2兲 has a
higher exothermicity of 102 kcal/ mol with respect to 共R1兲
共exothermicity of 82 kcal/mol兲, the translational energy re-lease of 共R2兲is still much more significant. It should reveal features of the potential energy surface, which are different
FIG. 4. Product translational energy distribution P共ET兲 and angular
distri-bution P共兲 used to fit Figs.2and 3 for the reaction of 18O共1D兲+N2O →32NO +30NO共R1兲.
FIG. 5. Experimental TOF spectra of mass 34 probing the product from 18O共1D兲+N2O→N
2+34O2 reaction at several laboratory angles. Open circles: data, solid line: fit.
133121-4 Lu, Liang, and Lin J. Chem. Phys. 125, 133121共2006兲
for 共R1兲 and 共R2兲. For these two highly exothermic reac-tions, the majority of available energy is from the reaction exothermicity which corresponds to the drop of potential en-ergy from reactant side to product side. Along the reaction coordinate of 共R1兲, there is a very significant potential en-ergy drop at the entrance valley. That is, the entrance well or intermediate of共R1兲is quite stable relative to the reactants. There is no significant well in the entrance region of 共R2兲. Along the reaction coordinate of 共R2兲, there is a large and pronounced共clifflike兲 potential energy drop at the exit val-ley. These features can be seen on the three-dimensional minimum energy paths calculated by Last et al.14and on the
global PES at CASPT2/cc-PVDZ level of theory.17This level
of CASPT2 calculation has been confirmed by other CASPT2 calculations using a larger active space and/or other basis sets.15,16On this PES, there is a deep entrance well for
共R1兲. When NNO is fixed at the equilibrium geometry of a
N2O molecule, the entrance well is deepest at linear O–NNO
geometry, but its barrier to product is also high. When O–NNO is bent, the well becomes shallower, but the barrier to product is also reduced significantly. This entrance well is broad in terms of orientation angle of the attacking O共1D兲
atom and covers about a hemisphere at the N end of the N2O
reactant.17
A trans-bent ONNO intermediate has been located by
CASSCF共18e,14o兲 method.15
At the CASPT2 refined en-ergy, this intermediate is 65.8 kcal/ mol lower than the reac-tant and the barrier to product is about 3.6 kcal/ mol. A cis-bent ONNO intermediate has also been found. Its energy is significantly higher than the trans isomer, suggesting that it should be less important for共R1兲.15
In both high level PES calculations, there is no signifi-cant entrance well for共R2兲 and the potential energy drop at the exit valley is very large.15,17 The energy release at the
exit valley should correlate to the product energy partition-ing. The reaction coordinate of 共R2兲 near the exit region is quite parallel to the bond length of the breaking NN–OO bond with only small variations of the bending angles.14,17It is thus expected that the majority of the energy release should be transferred to the product translational energy. On the other hand, the energy release at the entrance valley should be transferred to vibrational motions of the interme-diate and thus contributes less to the product translational energy. Besides stretching motions, bending motions should be extensively involved in共R1兲because of significant varia-tions of bending angles along the minimum energy path.15,17
Both共R1兲 and共R2兲have nonsymmetric product angular
distributions, indicating that the lifetime of the reaction in-termediate 共if it exists兲 is shorter than its rotational period.
共R1兲has at least one stable intermediate.15However, its life-time is expected to be short because the barrier height to products is small. For 共R2兲, the barrier to products is either nonexistent or negligible,15,17suggesting even faster reaction time scales. Forward scattered products can easily be ac-counted for by contributions from large impact parameters as there is no potential energy barrier in the entrance region.
Both minimum energy paths of共R1兲 and共R2兲 involve
non-linear geometries, which could smear out the product angular distributions.
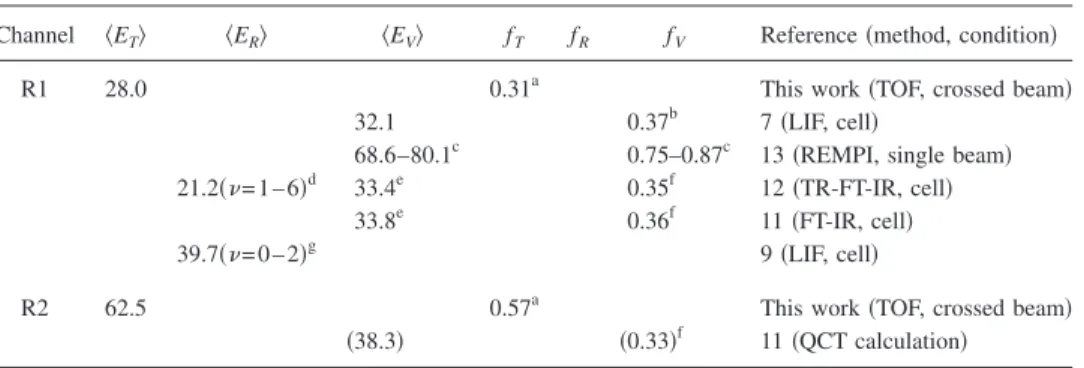
From the P共E兲’s in Figs. 4 and6, we can calculate the
average kinetic energy release具ET典 and the translational
frac-tion of the available energy, fT=具ET典/Eavl. Here the available
energy Eavlis the sum of the collision energy and the reaction
exothermicity. TableIsummarizes the product energy
parti-tioning of 共R1兲 and 共R2兲. The average product vibrational
energy of 共R2兲 is from a QCT calculation. All other values
are from various experimental measurements. There is a large discrepancy in literature values for the product vibra-tional distribution of 共R1兲. Pisano et al.13 measured the NO vibrational distribution using a REMPI method in a single molecular beam. They reported a much higher vibrational excitation than other studies. Their average total product
vi-brational energy has a lower bound of 24 000 cm−1,
corre-sponding to fV艌0.75.13From our experimental data, we
de-termined fT= 0.31. If this fV艌0.75 is right, fR has to be
almost zero to balance the energy partitioning, considering possible error bars of both fV and fT. However, small fR is
not likely. High rotational excitation of the NO product in
v = 0 – 6 has been observed by several groups.4,5,9,12
Brouard et al.5suggested two共limiting兲 types of reaction mechanisms: one a direct “stripping” reaction yielding NO 共v=0兲+NO共v=16–18兲 and the other an indirect process in which the collision complex survives for a sufficient time to allow energy redistribution, leading to the formation of rota-tionally hot NO in v = 1 – 15. However, the relative yield of
the stripping mechanism is only supported by the observed large signal of NO共v=0兲.5By energy balance, this particular
product channel of NO 共v=0兲+NO共v=16–18兲 must have
small translational energy. The yield of this particular channel should be minor according to our experimentally
derived P共ET兲 in Fig. 4 as it is peaked away from zero.
The NO共v=0兲 signal could be easily contaminated by
back-ground NO gas, consistent with the observation that the
FIG. 6. Product translational energy distribution P共ET兲 and angular
distri-bution P共兲 used to fit Fig. 5 for the reaction of 18O共1D兲+N2O→N 2 +34O2共R2兲.
NO共v=0兲 in their measurement is translationally and rota-tionally much colder than other vibrational levels.5
Further-more, recent LIF studies show that NO共v=0,1,2兲 products
are highly rotational excited.9Full determination of the NO rotational distribution is difficult due to very fast rotation-to-translation relaxation rates. A time-resolved FT-IR emission
study12 gives a lower bound of average rotational energy
of⬃3700 cm−1共population-weighted average over v=1–6兲,
in which partial rotational relaxation is likely under the
ex-perimental condition. The LIF study9 shows much higher
average rotational energies ranging from 6300 to 7500 cm−1
for v = 0 , 1 , 2. Shorter delay time in the LIF detection
should reduce the probability of rotational relaxation. NO 共v=0–6兲 already covers the majority 共⬎80%兲 of the vibra-tional population.7,11,12 If we take the fV= 0.37 from Ref. 7
and our fT= 0.31, we can deduce fR= 0.32, that is, the
aver-age total rotational energy is about 29 kcal/ mol
共⬃10 000 cm−1兲. The pair correlation of the two NO
mol-ecules is not clear yet. If they share the rotational energy
about evenly, each NO molecule should have ⬇5000 cm−1
average rotational energy, which is roughly consistent with
Refs. 9 and 12, considering that only very low vibrational
levels are probed in Ref.9and partial rotational relaxation is
likely in Ref. 12. As the yield of the stripping mechanism
should be minor, a short-lived complex should be responsible for the major mechanism of共R1兲. The lifetime of the colli-sion complex should be less than its rotational period as suggested by the asymmetric P共兲 in Fig.4. Energy redistri-bution in the intermediate is very likely but not complete as evidenced by the observed vibrational and rotational distri-butions of the NO products.7,9,12The new NO is only mod-erately vibrationally hotter than the old NO.7Also, a statis-tical phase space theory can describe the major part of the
rotational distribution for the NO 共v=0,1,2兲 product.9 It
may be asked why the energy redistribution in the interme-diate is more efficient than expected from the short lifetime and low barrier to product. The absence of hydrogen atom in this tetraatomic system may be one of the reasons, as the vibrational density of states is much higher than hydrogen containing systems of the same number of atoms.9,25
A direct mechanism for共R2兲is expected from the lack of a potential energy well between the reactant and product and our data support this mechanism. Furthermore, a QCT calculation11 has shown that the vibrational distribution of the O2共1⌬兲 product is very hot with v peaked at 9 while the
N2 product is extremely cold vibrationally. In contrast, the
vibrational distribution of the new and old NO products from the same QCT calculation are broad and monotonically de-ceasing with an effective vibrational temperature of
⬃9000 K.11
From the relative signal intensities of the products of
共R1兲and共R2兲, we can deduce their relative yields. We have to compare the signal intensities in the CM frame, so the laboratory-CM transformation Jacobian factor has to be in-cluded. The cross sections37 and cracking ratios of electron impact ionization at 70 eV are also taken into account.38The transmission efficiency of the quadrupole mass filter is as-sumed to be the same for mass 30, 32, 34, 44, and 46. For the
branching ratio between 共R1兲and共R2兲, we used the signals
at masses 32共32NO+兲 and 34 共34O 2
+兲 which should have very
similar transmission efficiencies. After appropriate account-ing for all of these sensitivity factors, we get the relative branching ratio of共R1兲: 共R2兲=62: 38= 1.6.
The NASA/JPL panel recommends the rate constants
of 共R1兲 and 共R2兲 to be 6.7⫻10−11 and 4.9⫻10−11cm3
molecule−1s−1 at 298 K for use in stratospheric modeling
studies,39in which the branching ratio of 共R1兲: 共R2兲 is 1.4. The IUPAC subcommittee evaluated the gas kinetic data for use in the studies of atmospheric chemistry and
recom-mends that the rate constants are 7.2⫻10−11 and 4.4
⫻10−11cm3molecule−1s−1at 298 K,40
in which the branch-ing ratio of 共R1兲: 共R2兲 is 1.6. It is very close to our result, although our collision energy of 7.8 kcal/ mol is significantly higher than those at 298 K.
Takayanagi et al. investigated the collision energy
de-pendence on this branching ratio by QCT calculation17 as
well as quantum-classical calculation20on the CASPT2
glo-bal surface. But the QCT calculation ignored the contribution of nonzero impact parameters; therefore, the branching ratio is only semiquantitative. The calculated branching ratio of
TABLE I. Comparison of the product energy partitioning共具ET典, 具ER典, and 具EV典 are in kcal/mol兲.
Channel 具ET典 具ER典 具EV典 fT fR fV Reference共method, condition兲
R1 28.0 0.31a This work共TOF, crossed beam兲
32.1 0.37b 7共LIF, cell兲
68.6–80.1c 0.75–0.87c 13共REMPI, single beam兲 21.2共= 1 – 6兲d 33.4e 0.35f 12共TR-FT-IR, cell兲
33.8e 0.36f 11共FT-IR, cell兲
39.7共= 0 – 2兲g 9共LIF, cell兲
R2 62.5 0.57a This work共TOF, crossed beam兲
共38.3兲 共0.33兲f 11共QCT calculation兲 aEav1共R1兲=89.7 kcal/mol, Eav1共R2兲=110.1 kcal/mol, and E
c= 7.8 kcal/ mol.
bEav1共R1兲=87.0 kcal/mol. cEav1共R1兲=91.5 kcal/mol.
d10.6 kcal/ mol per NO molecule, partially relaxed.
ePopulation of NO共= 0兲 was assumed by extrapolating. Here we pick P共= 0兲=1.2P共= 1兲. fEav1共R1兲=94.5 kcal/mol, 具E
c典=12.6 kcal/mol, Eav1共R2兲=118.4 kcal/mol, Ec= 16.1 kcal/ mol.
g19.9 kcal/ mol per NO molecule.
133121-6 Lu, Liang, and Lin J. Chem. Phys. 125, 133121共2006兲
共R1兲:共R2兲 has a maximum value of⬃1.3 at medium colli-sion energies ranging from 4 to 8 kcal/ mol and decreases at higher collision energies. The quantum-classical calculation shows a similar trend but somewhat smaller branching ratios
with the maximum value of ⬃1.1. The room temperature
data should represent the reaction events of low collision energies around 1 kcal/ mol. The above calculated branching ratios at low collision energy range are about 1, which is significantly smaller than the room temperature experimental values recommended by both JPL and IUPAC. In contrast, a TST calculation based on CASPT2 transition state structures shows a fast rising branching ratio when the temperature is lowered.15
B. Isotope exchange channel
We have searched for the possibility of the isotope
ex-change channel,共R3兲, by measuring TOF spectra of mass 46
at a few laboratory angles, but we could not find any signifi-cant signal. The only TOF peak observed at mass 46 is likely from the elastic and inelastic scatterings of N2O. A normal
N2O sample should have 0.2% 46N2O 共natural abundance兲
which is also scattered by the O atom beam without any reaction and becomes background. We can simulate this con-tribution by scaling the TOF signal of mass 44 by the natural abundance of 46N2O. If共R3兲 exists, the TOF signal should have this background subtracted. Experimentally, the signal is too weak to do the subtraction. Since the signal is likely smaller than the background, we can use the intensity of the
background 共scaled from the mass 44 TOF spectra兲 as the
upper limit of 共R3兲. After accounting for the appropriate
laboratory-CM transformation Jacobian factor and relative detection efficiencies, we determined the upper limit of the
branching ratio of 共R3兲/关共R1兲+共R2兲+共R3兲兴 to be 0.8%. It
suggests that the isotope exchange between N2O and O共1D兲
is relatively unimportant, consistent with very recent literature.32
In the isotope exchange reaction of O共1D兲+CO
2,
crossed molecular beam results show a long-lived collision
complex mechanism.26,27 RRKM calculation estimated the
reaction time scale to be subnanosecond.28 Although the
electronic quenching isotope exchange process to produce
O共3P兲+CO
2is quite exothermic, it is relatively slow because
it is spin forbidden. The nonquenching exchange process has been shown to be even slower, primarily due to small avail-able energy and large density of states of the CO3complex.
If the 共presumed兲 isotope exchange reaction of O共1D兲
+ N2O is mechanistically similar to those of O共1D兲+CO2, the
expected rate should be also small and could not compete with the very fast共R1兲 and共R2兲.
IV. CONCLUSION
We have studied the O共1D兲+N2O reaction at
7.8 kcal/ mol collision energy using the crossed molecular
beam technique. Three product channels, NO + NO 共R1兲,
N2+ O2 共R2兲, and isotope exchange reaction 共R3兲, were
in-vestigated. By analyzing the product angular distributions and the product energy release in various degrees of free-dom, the reaction mechanisms were discussed in detail.
Dis-crepancy of the NO product vibrational distribution in the literature was discussed. A short-lived complex should be the major mechanism for the NO + NO channel. Although the lifetime is expected to be quite short, the couplings between vibrational modes in the entrance well/intermediate region may be strong enough to randomize large fraction of the available energy, resulting in statistical-like product energy distributions. On the other hand, the energy partitioning of the N2+ O2channel is highly nonstatistical. A very high
frac-tion of translafrac-tional energy release was observed, consistent with the shape of the potential energy surface. Finally, we have estimated the relative branching ratio of共R1兲:共R2兲to be
62:38. The isotope exchange reaction共R3兲was not observed
in our sensitivity range共⬍0.8% in yield兲, suggesting that it is not important in the atmospheric isotope modeling.
ACKNOWLEDGMENTS
This work is supported by National Science Council,
Taiwan 共NSC94-2113-M-001-004兲 and Academia Sinica,
Taipei, Taiwan. The authors like to thank Professor Yuan T. Lee for helpful discussions and A. L. Van Wyngarden for valuable comments on the manuscript.
1J. R. Wiesenfeld, Acc. Chem. Res. 15, 110共1982兲.
2N. Goldstein, G. D. Greenblatt, and J. R. Wiesenfeld, Chem. Phys. Lett. 96, 410共1983兲.
3G. A. Chamberlain and J. P. Simons, J. Chem. Soc., Faraday Trans. 2 71, 402共1975兲.
4M. Brouard, S. P. Duxon, P. A. Enriquez, R. Sayos, and J. P. Simons, J. Phys. Chem. 95, 8169共1991兲.
5M. Brouard, S. P. Duxon, P. A. Enriquez, and J. P. Simons, J. Chem. Phys. 97, 7414共1992兲.
6K. Honma, Y. Fujimura, O. Kajimoto, and G. Inoue, J. Chem. Phys. 88, 4739共1988兲.
7H. Akagi, Y. Fujimura, and O. Kajimoto, J. Phys. Chem. 111, 115共1999兲. 8H. Akagi, Y. Fujimura, and O. Kajimoto, J. Chem. Soc., Faraday Trans.
94, 1575共1998兲.
9S. Kawai, Y. Fujimura, O. Kajimoto, and T. Takayanagi, J. Chem. Phys. 120, 6430共2004兲.
10H. Tsurumaki, Y. Fujimura, and O. Kajimoto, J. Chem. Phys. 111, 592 共1999兲.
11X. B. Wang, H. Z. Li, Q. H. Zhu, F. N. Kong, and H. G. Yu, J. Chin. Chem. Soc.共Taipei兲 42, 399 共1995兲.
12G. Hancock and V. Haverd, Phys. Chem. Chem. Phys. 5, 2369共2003兲. 13P. J. Pisano, M. S. Westley, and P. L. Houston, Chem. Phys. Lett. 318,
385共2000兲.
14I. Last, A. Aguilar, R. Sayós, M. González, and M. Gilibert, J. Phys. Chem. A 101, 1206共1997兲.
15M. González, R. Valero, J. M. Anglada, and R. Sayós, J. Chem. Phys. 115, 7015共2001兲.
16H. Akagi, A. Yokoyama, Y. Fujimura, and T. Takayanagi, Chem. Phys. Lett. 324, 423共2000兲.
17T. Takayanagi and H. Akagi, Chem. Phys. Lett. 363, 298共2002兲. 18R. Sayós, R. Valero, J. M. Anglada, and M. González, J. Chem. Phys.
112, 6608共2000兲.
19M. A. Vincent, I. H. Hillier, and L. Salsi, Phys. Chem. Chem. Phys. 2, 707共2000兲.
20T. Takayanagi, Chem. Phys. 308, 211共2005兲.
21T. Takayanagi and A. Wada, Chem. Phys. 269, 37共2001兲.
22M. Ben-Nun, M. Brouard, J. P. Simons, and R. D. Levine, Chem. Phys. Lett. 210, 423共1993兲.
23M. González, R. Sayós, P. A. Enríquez, D. Troya, and M. P. Puyuelo, Faraday Discuss. 108, 427共1997兲.
24M. González, D. Troya, M. P. Puyuelo, R. Sayós, and P. A. Enríquez, Chem. Phys. Lett. 300, 603共1999兲.
25H. Akagi, Y. Fujimura, and O. Kajimoto, J. Chem. Phys. 110, 7264 共1999兲.
26M. J. Perri, A. L. Van Wyngarden, K. A. Boering, J. J. Lin, and Y. T. Lee,
J. Chem. Phys. 119, 8213共2003兲.
27M. J. Perri, A. L. Van Wyngarden, K. A. Boering, J. J. Lin, and Y. T. Lee, J. Phys. Chem. A 108, 7995共2004兲.
28A. M. Mebel, M. Hayashi, V. V. Kislov, and S. H. Lin, J. Phys. Chem. A 108, 7983共2004兲.
29Y. L. Yung, M. C. Liang, G. A. Blake, R. P. Muller, and C. E. Miller, Geophys. Res. Lett. 31, L19106共2004兲.
30T. Rockmann and J. Kaiser, Geophys. Res. Lett. 32, L11807共2005兲. 31Y. L. Yung, M. C. Liang, G. A. Blake, R. P. Muller, and C. E. Miller,
Geophys. Res. Lett. 32, L11808共2005兲.
32J. Kaiser and T. Rockmann, Geophys. Res. Lett. 32, L15808共2005兲. 33J. A. Davidson, C. J. Howard, H. I. Schiff, and F. C. Fehsenfeld, J. Chem.
Phys. 70, 1697共1979兲.
34S. Nishida, K. Takahashi, Y. Matsumi, N. Taniguchi, and S. Hayashida, J. Phys. Chem. A 108, 2451共2004兲.
35NIST kinetic database, http://kinetics.nist.gov/index.php
36U. Even, J. Jortner, D. Noy, N. Lavie, and C. Cossart-Magos, J. Chem. Phys. 112, 8068共2000兲.
37http://physics.nist.gov/PhysRefData/Ionization/ 38Mass spectra of NO and O
2 are from the NIST chemistry webbook 共http://webbook.nist.gov兲; the available cracking ratios are for room tem-perature samples. Because NO+and O
2
+both have strong bond energy, the extent of cracking is small and its dependence on the product internal excitation is expected to be small, which should not be a significant factor for the branching ratio determination.
39S. P. Sander, R. R. Friedl, D. M. Golden et al., Evaluation No. 14, JPL Publication No. 02-25, 2003共JPL, Pasadena, CA, 2003兲.
40R. Atkinson, D. L. Baulch, R. A. Cox, R. F. Hampson, Jr., J. A. Kerr, M. J. Rossi, and J. Troe, J. Phys. Chem. Ref. Data 26, 521共1997兲.
133121-8 Lu, Liang, and Lin J. Chem. Phys. 125, 133121共2006兲