國 立 交 通 大 學
電子工程學系 電子研究所碩士班
碩 士 論 文
矽奈米線生物感測器之分析與模擬
Analysis and Simulation for Silicon Nanowire
Biosensors
研 究 生:呂昆諺
指導教授:蘇 彬 教授
矽奈米線生物感測器之分析與模擬
Analysis and Simulation for Silicon Nanowire
Biosensors
研 究 生:呂昆諺 Student: Kun-Yen Lu
指導教授:蘇 彬 Advisor: Pin Su
.
國 立 交 通 大 學
電子工程學系 電子研究所
碩 士 論 文
A ThesisSubmitted to Department of Electronics Engineering & Institute of Electronics College of Electrical and Computer Engineering
National Chiao Tung University in Partial Fulfillment of the requirements
for the Degree of Master in
Electronic Engineering September 2009 Hsinchu, Taiwan
矽奈米線生物感測器之分析與模擬
研究生:呂昆諺 指導教授:蘇 彬
國立交通大學電子工程學系 電子研究所碩士班
摘要
在本論文中提供一個廣泛適用於矽奈米線生物感測器模擬的架構。使用這 種模擬的架構,我們系統化地探討元件設計對生物感測器靈敏度的所造成影響。 同時,我們也探討因為本質參數變異對矽奈米線生物感測器所造成的影響,其中包含了隨機參雜濃度變動 (Random Dopant Fluctuation)、線邊緣的粗糙程度
(Line-edge Roughness)。經由模擬的結果,我們得知一個擁有較低摻雜濃度、 較小通道半徑與較短通道長度的矽奈米線生物感測器有更好的靈敏度與抵抗靈 敏度擾動的能力。而當通道半徑小於十奈米,量子效應會進一步的驅動生物感測 器靈敏度的成長。另一方面,我們研究在電解液中使用擴散型電子流抑制遮蔽效 應對生物感測器所造成的影響。研究發現,使用擴散型電子流十分有效的抑制遮 蔽效應,在一個輕摻雜、小通道半徑的生物感測器上靈敏度會明顯的增加,特別 是在摻雜原子與待測分子的之間所帶電性相反的情況下。除此之外,天線型矽奈 米線生物感測器的分析與模擬,在本論文中也將做進一步的討論。
Analysis and Simulation for Silicon Nanowire
Biosensors
Student: Kun-Yen Lu Advisor: Pin Su
Department of Electronics Engineering Institute of Electronics
National Chiao Tung University
Abstract
This thesis provides a comprehensive simulation framework for silicon nanowire (Si-NW) biosensors. Using this simulation framework, we have systematically investigated the impact of device design on the sensitivity of Si-NW biosensors. In addition, we have examined the impacts of intrinsic parameter fluctuations such as random dopant fluctuations (RDF) and line-edge roughness (LER). Our study indicates that Si-NW biosensors with smaller diameter, shorter channel length, and lower channel doping have better sensitivity and less sensitivity variation. When diameter is smaller than ~10nm, the quantum effect further enhances the sensitivity. Regarding the suppression of screening effects, our simulations indicate that the electro-diffusion flow can significantly suppress the screening effects in the electrolyte solution, and Si-NW biosensors with lower channel doping and smaller diameter have more enhancements in the sensitivity, especially for the accumulation mode. Besides, the structure of Si-NW biosensor with antenna has been simulated and analyzed.
誌 謝
從剛進實驗室時的懵懵懂懂,到今日畢業在即一切卻又顯得如此的離情依 依,兩年的歲月在不知不覺中流過。剎那間,驪歌響起、微風輕拂,又要向下一 個人生階段邁進。兩年的光陰,不論是與教授的討論,或是在實驗室與大家一起 為研究努力、打拼的情景,一切的酸、甜、苦、辣,都是我最深的懷念。 得之於人者太多,出之於己者太少。在此時此刻,這兩句話不禁浮然躍於 心頭之上。在碩士班兩年的時間,特別感謝指導老師-蘇彬教授,老師對學術上 的熱忱以及對學術嚴謹的要求都是我學習的榜樣。同時,也很感謝吳育昇學長、 胡璧合學姐、郭俊延學長、范銘隆學長、王生圳學長、陳伯年學長、謝欣原學弟 以及余昌鴻學弟在日常生活中,不論是課業上或是研究上的幫助。能和大家在同 一個實驗室,是我在這段求學期間中最幸福也是最幸運的事。此外林鴻志教授門 下的徐行徽學長及生科所楊裕雄教授門下的蕭程允學長,對我論文的完成給予我 相當大的幫助在此一並感謝。 最後,感謝我的家人,不論我處在任何的困境都有你們的陪伴。謝謝我的 爸爸呂元春先生和媽媽葉月嬌女士,你們辛苦的工作撫育我,為我所做一切的事 都是支持我能不斷向前邁進的動力。 就像是陳之藩所說的:『要感謝的人太多了,所以就謝天吧!』。謹以此論文 獻給所有給幫助過我的人。 2009/9/1 呂昆諺于風城Contents
Abstract (Chinese) ... Ⅰ Abstract (English) ... Ⅱ Acknowledgement ... Ⅲ Contents ... Ⅳ Figure Captions ... Ⅵ Chapter 1 Introduction 1-1 Background ... 11-2 Organization of the Thesis ... 3
1-3 References ... 3
Chapter 2 Device Design of Silicon Nanowire Biosensors Considering Intrinsic Parameter Fluctuations 2-1 Introduction ... 5
2-2 Simulation Approach and Calibration ... 6
2-2.1 Simulation Approach ... 8
2-2.2 Calibration ... 10
2-3 Impact of Process Variations on Si-NW Biosensors ... 11
2-3.1 Impact of Diameter Variation on the Sensitivity of Si-NW Biosensors ... 11
2-3.2 Impact of Channel Length Variation on the Sensitivity of Si-NW Biosensors ... 13
2-3.3 Impact of Random Dopant Fluctuations on the Sensitivity of Si-NW Biosensors ... 14
2-4 Quantum Mechanical Effects on the Sensitivity of Silicon Nanowire Biosensors ... 17
2-5 Summary ... 19
2-6 References ... 20 Chapter 3 Investigation of Si-NW Biosensors with Electro-Diffusion Flow
3-1 Introduction ... 39
3-2 Simulation Approach and Calibration ... 40
3-2.1 Equivalent Circuit Model... 40
3-2.2 Simulation Approach ... 41
3-2.3 Calibration ... 44
3-3 Sensitivity of Si-NW Biosensors Operating in the Accumulation Mode and Depletion Mode ... 45
3-3.1 Accumulation Mode ... 45
3-3.2 Depletion Mode ... 48
3-4 Quantum Mechanical Effects on Small-Diameter Si-NW Biosensors ... 49
3-5 Summary ... 50
3-6 References ... 51
Chapter 4 Simulation and Analysis for Silicon Nanowire Biosensors with Antenna 4-1 Introduction ... 69
4-2 Simulation Approach and Calibration ... 69
4-2.1 Simulation Approach ... 70
4-2.2 Simulation Results ... 72
4-3 Analytical Sensitivity Model for Long channel Si-NW biosensors with Antenna in Subthreshold Region ... 74
4-4 Summary ... 77
4-5 References ... 78
Chapter 5 Conclusions 5-1 Conclusions ... 89
Figure Captions
Fig. 2-1. Schematic sketch of a Si-NW biosensor. ... 23 Fig. 2-2. (a) The biomolecules detecting system, which can be separated to (b) the
electrolyte solution region, and (c) the semiconductor region. ... 24 Fig. 2-3. Simulation procedure for a Si-NW biosensor. ... 25 Fig. 2-4. Simulation of the PSA molecule. (a) The net charge of a PSA molecule
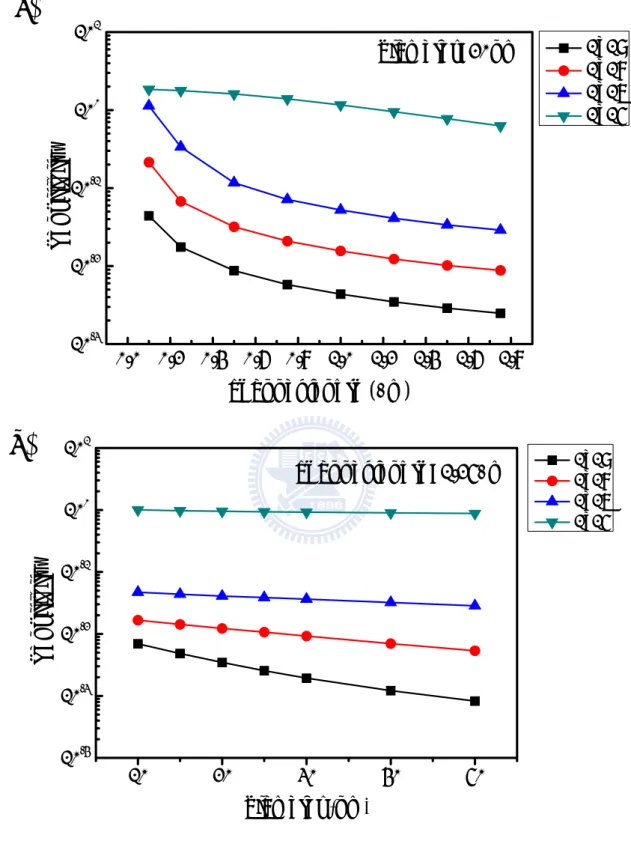
depends on the pH value of solution. (b) Comparison of simulation results with the Harvard experimental data [2.16]. ... 26 Fig. 2-5. Sensitivity of Si-NW biosensors as a function of (a) channel length, and (b)
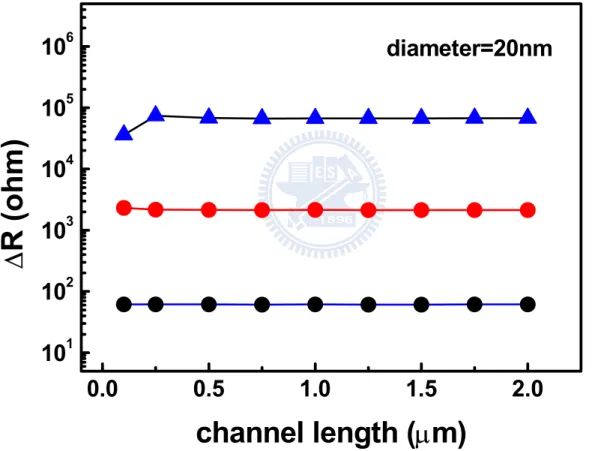
diameter for various channel doping concentrations. ... 27 Fig. 2-6. In the Si-NW biosensors, the resistance change is insensitive to the
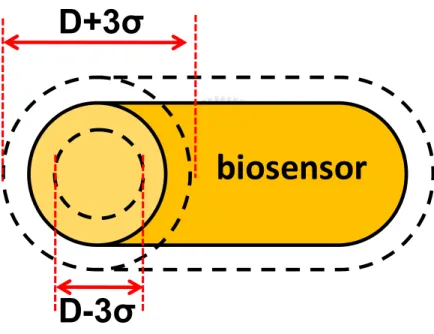
channel length scaling. ... 28 Fig. 2-7. Schematic sketch of a Si-NW biosensor with ±3σ diameter variation. ... 29 Fig. 2-8. Impact of diameter variation on the sensitivity for various channel doping
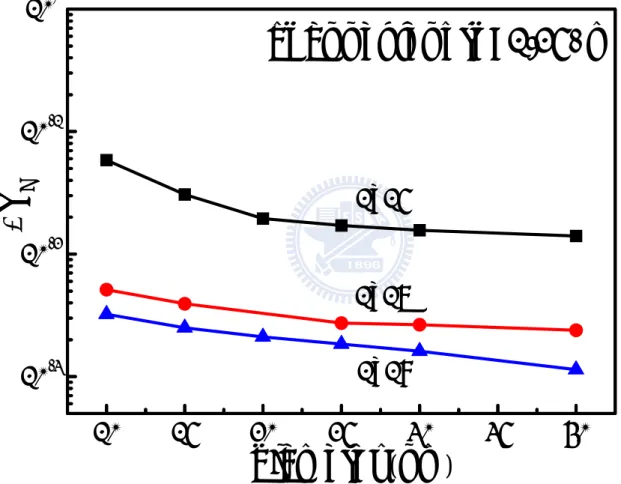
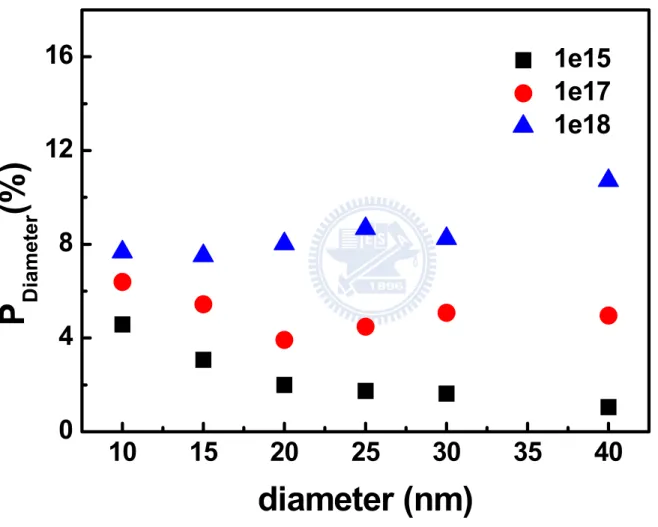
concentrations. ... 30 Fig. 2-9. The percentage change of sensitivity variation in diameter for various
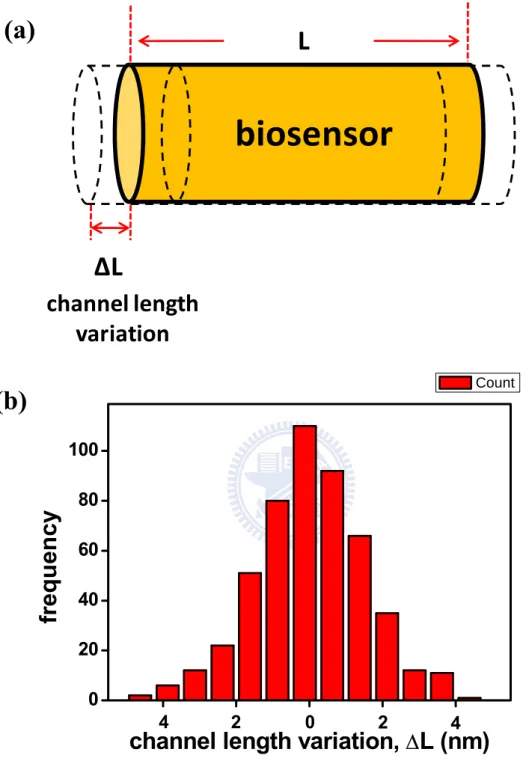
doping concentrations. ... 31 Fig. 2-10. (a) Schematic sketch of a Si-NW biosensors with channel length variation, ∆L. (b) Gaussian distribution of the channel length variation. The figure includes 500 ensembles. ... 32 Fig. 2-11. Sensitivity variation in channel length for (a) heavily doped cases, and (b)
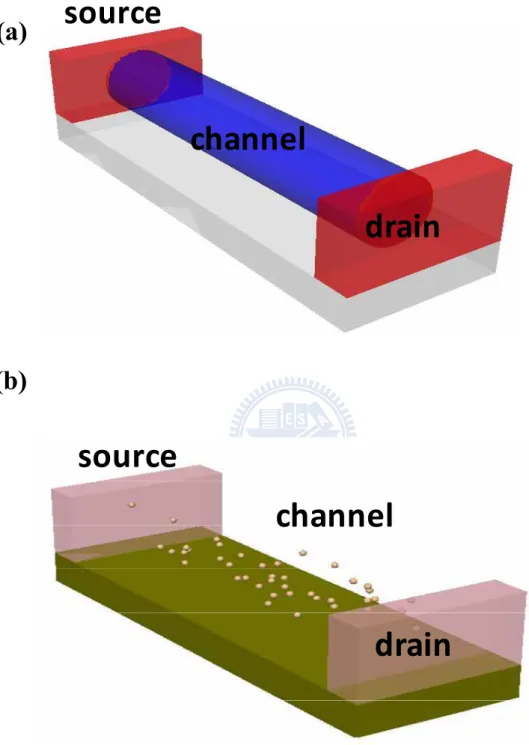
lightly doped cases. ... 33 Fig. 2-12. Schematic sketch of a Si-NW device with (a) continuous doping, and (b)
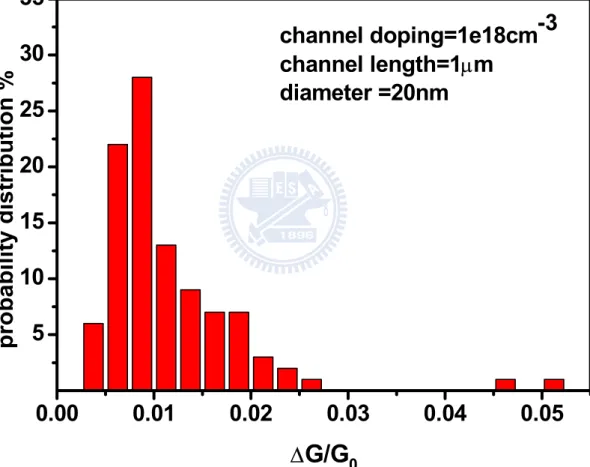
individually dopants distributed in the channel. ... 34 Fig. 2-13. Statistical fluctuations in sensitivity due to random dopant fluctuations. . 35 Fig. 2-14. Impact of the random dopant fluctuations for (a) heavily-doped, and (b)
lightly-doped Si-NW biosensors for various channel length. ... 36 Fig. 2-15. When the density gradient parameter γ=15, the exact solution of coupled
Poisson-Schrodinger equations can be captured well by our ISE simulation. ... 37 Fig. 2-16. Impact of quantum effects on (a) heavily-doped, and (b) lightly-doped
Si-NW biosensors. ... 38 Fig. 3-1. The proposed biomolecules detecting system [4], which can be separated
to (b) the electrolyte solution region, and (c) the semiconductor region. .. 53 Fig. 3-2. The equivalent circuit models of two screening effect behaviors:
(a)Without solution bias, the biomolecule is shielded by the accumulated ions. (b)With solution bias, the electro-current suppresses the screening effect of biomolecule, and increases the QSI in silicon. ... 54
Fig. 3-3. The simulation procedure for a Si-NW biosensor with solution bias. ... 55 Fig. 3-4. Our simulation results agree well with the Stanford simulation results. The ratio of the induced charge Q’ to Qdop increases with the solution bias
because the solution bias induces more charges in the biosensor... 56 Fig. 3-5. The potential change is defined as log (10 ∆ψ). (a) At solution bias=0V, the potential change is limited in the vicinity of biomolecule because of the serious screening effect. (b) At solution bias=1V, the screening effect is suppressed and the potential change spreads over a border space. ... 57 Fig. 3-6. Two operation modes of Si-NW biosensors: (a) the accumulation mode
which means the biological charge is opposite to the charge of carriers in the silicon, and (b) the depletion mode that is contrary to the accumulation mode. ... 58 Fig. 3-7. (a) Schematic structure of a Si-NW with an approximated rod for ds DNA & ss DNA. (b) The device design parameters for our Si-NW biosensor simulations. ... 59 Fig. 3-8. With increasing the solution bias, the Si-NW biosensor has more induced
charge Q’ in the channel. Comparing (a) and (b), we can find that the RQ’/Qdop for 20mM solution is larger than the RQ’/Qdop for 100mM solution.
... 60 Fig. 3-9. In the accumulation mode, the sensitivity has the largest value through an
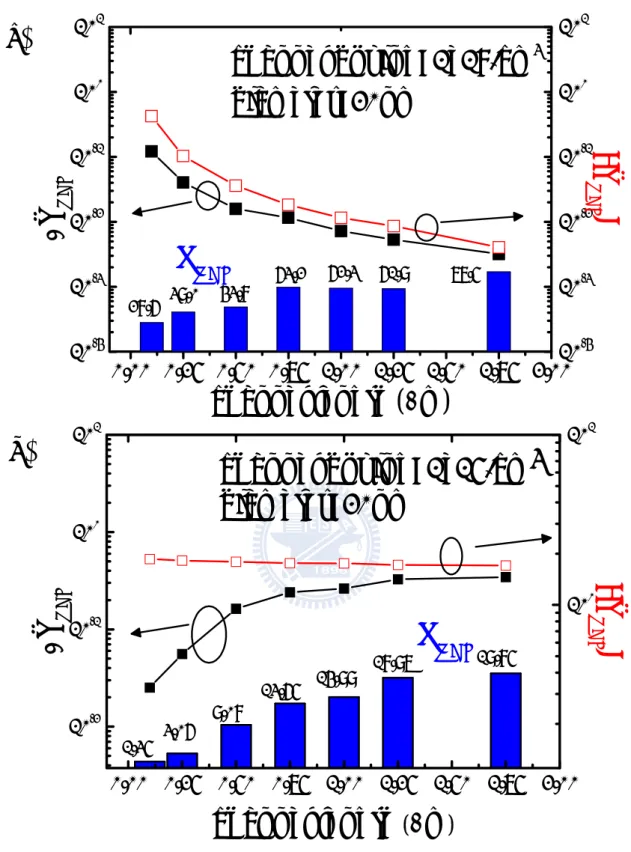
optimized solution bias. (a) For 20mM, the largest sensitivity of dsDNA and ssDNA are ~6.1 and ~4.3,respectively. (b) For 100mM, the corresponding values are ~3.5 and ~2.1. The biosensor operating in the light electrolyte concentration has larger sensitivity compared to in the heavy electrolyte concentration. ... 61 Fig. 3-10. In the accumulation mode, the sensitivity increases with decreasing
channel diameter of the nanowire biosensor. ... 62 Fig. 3-11. In the accumulation mode, the sensitivity increases with decreasing doping concentration of the nanowire biosensor. ... 63 Fig. 3-12. In depletion mode, the induced charge Q’ increases rapidly with the
solution bias and has an enhancement of ~3.5X/~3X compared to the Qdop
in 20mM/100mM (at solution bias=3V), respectively. It means the biosensor operating in light ion concentrations has better performance. .. 64 Fig. 3-13. The corresponding largest sensitivity for dsDNA/ssDNA are (a) 0.95/0.92
electrolyte concentration. ... 65 Fig. 3-14. In the depletion mode, the sensitivity of a Si-NW biosensor increases with decreasing diameter because of the increased surface to volume ratio. ... ... 66 Fig. 3-15. The sensitivity does not increase with decreasing channel doping
concentration because the sensitivity is saturated in the depletion mode. 67 Fig. 3-16. Impact of quantum effects on the sensitivity of small-diameter Si-NW
biosensors. ... 68 Fig. 4-1. The proposed biomolecules detecting system [4.3] which can be separated to (b) the sensing region, and (c) the semiconductor region. ... 80 Fig. 4-2. The simulation procedure for a Si-NW biosensor with antenna. ... 81 Fig. 4-3. Simulation of the surface potential change in the electrolyte solution with
pH 6 and pH 7. Our simulation results agree well with the experimental results [4.11]. ... 82 Fig. 4-4. The sensitivity of Si-NW biosensors with antenna operating in the
subthreshold and superthreshold region for various (a) channel diameters, and (b) channel lengths. ... 83 Fig. 4-5. The subthreshold swing of Si-NW biosensors with antenna depends on
various device design parameters such as (a) diameter, (b) channel length, and (c)channel doping. ... 84 Fig. 4-6. Schematic sketch of a Si-NW structure [4.4]. The origin (r=0 and y=0) is
defined at the center of the channel/source junction. ... 85 Fig. 4-7. The simulation results are captured well by our analytical model in the (a)
Id versus Vg curves, and (b) Id versus Vd curves. ... 86
Fig. 4-8. Comparison of the analytical sensitivity model with simulation results for various doping concentrations. ... 87 Fig. 4-9. Comparison of the analytical sensitivity model with simulation results for
various diameters. ... 87 Fig. 4-10. The corresponding sensitivity of Si-NW biosensors for various
Chapter 1
Introduction
1.1 Background
Biosensor is one of the most widely researched topics in bio-technology over past decades. For better sensitivity and faster analysis, the size of biosensors has been progressively miniaturized. In 2001, the research group at Harvard [1.1] has demonstrated silicon nanowire (Si-NW) served as a highly sensitive sensor for charged biological molecules and chemical species. Moreover, Si-NW biosensors have been used to demonstrate detection of DNA and proteins [1.2]-[1.4] at very low concentrations. With scaling the size of biosensors, device design and analysis become crucial and critical issues.
Moreover, for devices in the nanometer regime, several process variations such as random dopant fluctuation, channel length variation, and diameter variation may become pronounced because of the smaller device critical dimensions. It is difficult to capture device variability by investigating single device or using conventional simulation approach. Instead, using full Monte Carlo simulations to collect a large amount of identical devices and analyze the impacts of process variations on Si-NW biosensors is needed.
Besides, the electrostatic screening due to the ions in the electrolyte solution is also an important issue [1.5]. In 2008 IEDM, the research group at Stanford [1.6] has proposed a novel method to suppress the screening-induced performance limits of
Si-NW biosensors. In [1.6], the proposed method has significantly improved the performance of Si-NW biosensors, but it only considers the Si-NW biosensors operating in different electrolyte concentrations. The impacts of other device design parameters are short of discussion. Moreover, with scaling the size of biosensors, the quantum effect may play an important role. We provide a systematic investigation of Si-NW biosensors design and consider the electro-diffusion flow in the electrolyte solution.
Finally, we compare the ISFET of traditional bulk structure with a novel structure with antenna proposed by the research group at NCTU [1.7]. The new structure shows a superior subthreshold swing and higher on/off current ratio than the traditional bulk device. Although these advantages can further improve the performance of biosensors, the characteristics of the new structure with antenna have not been well understood. In addition to establishing a simulation methodology for the new structure, we demonstrate an analytical sensitivity model [1.8] for Si-NW biosensors with antenna operating in subthreshold regime. This model may provide more physical insights for Si-NW biosensors.
In this work, we have developed three distinct simulation frameworks to individually address the design considerations of Si-NW biosensors. The first simulation framework is for the direct-detection Si-NW biosensors. It considers that the biomolecules are directly accepted on the surface of Si-NW biosensors and change the conductance of Si-NWs. The second simulation framework is for Si-NW biosensors with solution bias. It considers the screening effect in the electrolyte solution. The third simulation framework is for the Si-NW biosensor with antenna. It considers that the charged biomolecules is uniformly distributed on the antenna
surface and the surface potential changes as detecting the biomolecules.
1.2 Organization of this Thesis
This thesis is organized as follows. In chapter 2, we investigate the impacts of intrinsic device parameter fluctuations on Si-NW biosensors and discuss the impacts of quantum effects on small-diameter Si-NW biosensors. In chapter 3, the effects of electro-diffusion current flow on Si-NW biosensors are assessed using our combined simulation procedure. In chapter 4, we investigate the Si-NW biosensors with antenna and demonstrate an analytical sensitivity model for Si-NW biosensors with antenna operating in subthreshold regime. Chapter 5 concludes this work.
Chapter 1 References
[1.1] Y. Cui, Q. Wei, H. Park, and C. M. Lieber, “Nanowire nanosensors for highly sensitive and selective detection of biological and chemical species,” Science, vol. 293, no. 5533, pp. 1289-1292, Aug. 2001.
[1.2] G. Zheng, F patlowsky, Y. Cui, W. U. Wang, and C. M. Lieber, “Multiplexed electrical detection of cancer markers with nanowire sensor arrays,” Nat. Biotechnol., vol. 23, no. 10, pp. 1294-1031, Oct. 2005.
[1.3] J. Hahm and C. M. Leiber, “Direct ultrasensitive electrical detection of DNA and DNA sequence variations using nanowire nanosensors,” Nano. Lett., vol. 4, no. 1, pp51-55, 2004.
[1.4] E. Stern, J. F. Klemic, D. A. Routenberg, P. N. Wyrembak, D. B. Turner-Evans, A. D. Hamilton, D. A. LaVan, T. M. Fahmy, and M. A. Reed, “Label-free immunodetection with CMOS compatible semiconducting nanowires,” Nature, vol. 445, no. 7127, pp. 519-523, Feb. 2007.
[1.5] P. E. Sheehan, and L. J. Whitman, “Detection limits for nanoscale biosensors,” Nano Letters, vol. 5, no. 4, pp. 803-807, 2005.
screening-induced performance limits of nanowire biosensors: a simulation sudy on the effect of elcetro-diffusion flow,” in IEDM Tech. Dig., pp. 491–494, 2008.
[1.7] H. H. Hsu, T. W. Liu, L. Chan, C. D. Lin, T. Y. Huang, and H. C. Lin, “Fabrication and characterization of multiple-gated poly-si nanowire thin-film transistors and impacts of multiple-gate structures on device fluctuations,” IEEE TED, vol. 55, no. 11, NOV. 2008.
[1.8] Y. S. Wu, and P. Su, “Sensitivity of gate-all-around nanowire MOSFETs to process variations-a comparison with multi-gate MOSFETs,” IEEE TED, vol. 55, no. 11, NOV. 2008.
Chapter2
Device Design of Silicon Nanowire Biosensors
Considering Intrinsic Parameter Fluctuations
2-1 Introduction
In the past decades, the detection of biological and chemical device has progressively developed and served at many areas such as diagnosis of diseases [2.1], new drug discovery, homeland security [2.2]-[2.3], health monitor, and so on. Since the early 1970s, the ion-sensitive field effect transistors (ISFET) have been as a low-cost alternative to a traditional pH sensor [2.4]. It resembles a conventional MOSFET, but the channel is exposed to the solution to enable ions to serve as a gate [2.5]. However, the ISFET is not sensitive enough for fast detection of biomolecules at ultra-low concentration, and its detection limits is about nanomolar level [2.6]. In recent years, chemical sensors with fluorescent labeling and parallel optical detection techniques have been demonstrated for the fast detection of biomolecules at ultra-low concentration [2.7], but the pre-work and post-work for manipulating the detection system are too expensive and time-consumption. Hence, developing a new device that can enable direct detection, ultra-sensitive and rapid analysis of the biological molecules becomes an emerging topic.
Due to the superior surface to volume ratio [2.8], silicon nanowire (Si-NW) is a good candidate for a direct label-free and ultra-sensitive sensor. The Si-NW biosensors have been demonstrated [2.9]. Compared with the ISFETs, the detection
limit of Si-NW biosensors is three to four orders of magnitude higher [2.6]. Hence, the size of Si-NW biosensors has been progressively reduced to nanometer scale for larger surface to volume ratio and better performance. When Si-NW biosensors are scaled to nanometer dimension, intrinsic device parameter fluctuation may play an important role [2.10]. In [2.11], the research group at Purdue has indicated that there exists a lower limit of channel doping concentration ND for Si-NW biosensors. When
channel doping density is below ND, the sensitivity will have unpredictable variations.
However, the impacts of other device parameter variations, such as channel length and diameter, on Si-NW biosensors are still short of discussion. Moreover, with diameter scaling, biosensors may need to consider the quantum effect. How the quantum effect affect the performance of Si-NW biosensor merits investigation.
Therefore, in this chapter, we investigate the device design of Si-NW biosensors considering the impacts of several process variations and the quantum effects. In Section 2-2, we develop a simulation flow considering Poisson-Boltzmann equation and investigate the impacts of various design parameters on Si-NW biosensors. In Section 2-3, we consider several process variations on Si-NW biosensors and calculate the corresponding sensitivity variation for different device design parameters. Section 2-4 gives the details of quantum effects for small-diameter Si-NW biosensors and discusses the influence of quantum effects for heavily- and lightly-doped cases. Section 2-5 summarizes the essential results of this chapter.
2-2 Simulation Approach and Calibration
consists of two electrodes (source and drain) and a functionalized surface around channel. The functionalized surface with specified receptors only conjugates with the target biomolecules. When the surface of biosensors receives target biomolecules, the potential distribution in the vicinity of biomolecules will be modulated. We assume Si-NW biosensors are operating in the accumulation mode because our simulation results indicate that the sensitivity of Si-NW biosensors is not determined by the doping type (n- or p-type). It is consistent with the Purdue’s simulation results [2.11]
.
The carriers in the channel are attracted by the biomolecules so they accumulate in the vicinity of conjugated receptors. Due to the charge redistribution in the channel, the conductivity of Si-NW biosensors will be changed. Hence, we can define the sensitivity, S, of a Si-NW biosensor as below:
,
(2-1)
where G/G0 is the conductance of Si-NW biosensors with/without detecting
biomolecules, and ∆G is the difference between G and G0. Although the sensitivity is
a good criterion to evaluate Si-NW biosensors, it is not intuitive enough to realize the relationship between the device design parameters and the sensitivity. We can approximate the biomolecule on the surface by a constant surface density σ and redefine the expression of sensitivity as the relative change in charge as below:
,
(2-2)
where q is the elementary charge, Neff is the effective doping concentration in the
channel, and d is the channel diameter. Equation 2-2 suggests that Si-NW biosensors with smaller diameters and lower doping densities are expected to have higher
sensitivity. It also explains why the surface to volume ratio increases with decreasing diameter.
2-2.1 Simulation Approach
The system of a Si-NW biosensor can be divided into two sub-regions, as shown in Fig. 2-2. Fig. 2-2(b) is the first sub-region, A, which contains the electrolyte solution, target biomolecules, and the various ions. Although these ions can provide the necessary buffer for the stability of biomolecule-receptor binding, they can also shield the biomolecules. The electrostatic potential in this region can be described by the nonlinear Poisson-Boltzmann (PB) equation [2.12]-[2.13]:
∑
, (2-3)
where εω is the dielectric constant of water, q is the elementary charge, Φ is the electrostatic potential, β=kB/T (kB is the Boltzmann constant, T is the temperature),
κ
is the modified Debye-Huckel parameter [2.13], and Zi is the fixed charge ofbiomolecules.
Fig. 2-2(c) is the second sub-region, B, which contains the silicon channel and oxide. In this region, we assume the silicon and oxide are perfect without any defects or traps, and the impurities in the channel are completely ionized. The carrier transport and the potential distribution in this region can be described by the drift-diffusion equation and Poisson’s equation, respectively.
, , , ,
(2-4)
(2-5)
where J is the current density, q is the elementary charge, is the mobility, n/p are the electro/hole density, Φ is the electrostatic potential, D is the diffusion coefficient, and Ndop is the net impurity concentration. The subscripts “e,h” correspond to electron
/ hole, respectively.
Equation (2-3)-(2-5) are the physical models used in the calculation of the Si-NW biosensor. We separate the numerical method into five main steps to solve the above equations.
In the first step: We use a numerical solver, COMSOL physical simulation tool [2.14] to solve the Poisson-Boltzmann equation and compute the electrical field distribution in the region A. Through the Gauss’s theorem, we can estimate the charge density in the water/oxide interface by integrating the electrical field. The differential form of Gauss’s law is expressed as:
·
,
(2-6)
where E is the electric field, ρ is the charge density, and ε is the electric constant of water.
In the second step: In the region B, the coupled drift-diffusion equation and Poison-Boltzmann equation are solved by the semiconductor simulation tool, ISE [2.15]. We take the first step result, the interface charge density, as the boundary condition of ISE simulation.
In the third step: Give specified operating bias to calculate the sensitivity of Si-NW biosensors.
In the fourth step: Vary the device design parameters in the first, second, and third steps, sequentially. In addition, we collect and categorize the simulation results to build the sensitivity table for various design parameters.
In the fifth step: We investigate and analyze the sensitivity for various design parameters, and systematically optimize the design parameters of Si-NW biosensors.
In summary, the simulation procedure of Si-NW biosensors is shown in the Fig. 2-3.
2.2.2 Calibration
In this section, we provide our simulation results for the detection of prostate-specific antigen (PSA) calibrated with the Harvard experimental data [2.16]. The research group at Harvard has successfully demonstrated highly-sensitive and label-free electrical detection of PSA by using Si-NW devices. The prostate-specific antigen is a marker for prostate cancer and its net charge on the surface depends on the pH of solution [2.17]. The simulation of PSA can be separated into three steps. In the first step, we find the sequence of PSA in the protein data bank [2.18]. In the second step, we use the protein calculator [2.19] to estimate the net charge on the various pH of solution. In the final step, we use our established simulation flow to investigate the relative conductance change of Si-NW biosensors. Fig. 2-4(a) shows
that the net charge depends on the pH of solution. Fig. 2-4(b) shows that our simulation results are very close to the Harvard experimental data [2.16].
In addition, we demonstrate the sensitivity of Si-NW biosensors for various design parameters. Fig. 2-5(a) and Fig 2-5 (b) show that the sensitivity increases with shorter channel length, smaller diameter, and lower channel doping concentration. These results are well expected from equation (2-2) except the dependence of channel length. For further investigating the dependence of sensitivity on length, the sensitivity can be rewritten as S=∆R/R0, where ∆R is the change in resistance due to
Si-NW biosensors detecting the target molecules, and R0 is the initial resistance. Fig.
2-6 shows that the change in resistance, ∆R, remains the same. It makes the sensitivity increase reversely with the channel length.
2-3 Impact of Process Variations on Si-NW Biosensors
2-3.1 Impact of Diameter Variation on The Sensitivity of Si-NW
Biosensors
To access the impact of diameter variation on Si-NW biosensors, we assume that the device design parameter D has a ±3σ variation (in Fig. 2-7). This 3σ value is estimated from the combination of process variations such as lithography variation, etch variation, and resist trim variation [2.20]. According to the 2008 ITRS [2.20], the value of 3σ is very close to 3nm. Therefore, the corresponding sensitivity variation in diameter can be calculated as:
∆S
D= | S
D_3σ– S
D_-3σ|
(2-7)
where SD_3σ / SD_-3σ represents the sensitivity of Si-NW biosenors with D+3σ/D-3σ,
and the sensitivity variation ∆SD is the difference between SD_3σ and SD_-3σ.
Fig. 2-8 shows our simulation results of the sensitivity variation in diameter for different channel doping concentrations. The figure clearly shows that the sensitivity variation increases reversely with the channel diameter. This is because the diameter is the critical dimension and its fraction of 3σ variation over diameter (3σ/D) increases with smaller diameter.Moreover, it can be seen that Si-NW biosensors have smaller sensitivity variation in diameter as the heavily-doped channel is employed. In summaries, Si-NW biosensors with higher channel doping density and larger diameter seem to have more advantages on the device design. To further our examination, we define the percentage change of sensitivity variation in diameter as below:
),
∆
%
(2-8)
In other words, we normalize the sensitivity variation with its self-sensitivity. This definition can help us more accuracy to determine the impact of the diameter variation.
Fig. 2-9 shows the PDiameter for different channel doping concentrations. The
figure indicates that the PDiameter decreases with reduced channel doping. This is
because the sensitivity, S, increases faster than the ∆SD. In other word, Si-NW
biosensors should be designed at lower doping concentrations for smaller percentage of sensitivity variation in diameter.
2-3.2 Impact of Channel Length Variation on The Sensitivity of
Si-NW Biosensors
To access the impact of channel length variation, we use the Gaussian autocorrelation function [2.21] in this study. The Gaussian autocorrelation function is based on the 1-D Fourier synthesis technique [2.21]:
√
/,
(2-9)
where ∆ is the rms amplitude of the channel length variation, Λ is the correlation length, and k is the index of sampling points defined as k=i (2π/Ndx) with dx, the space of sampling points.
A schematic sketch for Si-NW biosensor with channel length variation, ∆L, is shown is Fig. 2-10(a). In our simulation, ∆L is estimated by the Gaussian autocorrelation function. With appropriate choices of rms amplitude ∆=1.5 nm and correlation length Λ=20 nm [2-22], we generate a database with 500 samples for ∆L (Fig. 2-10(b)). Each simulated biosensor is randomly assigned a value of ∆L from the database.
We have performed Monte Carlo simulation with 100 samples to capture the stochastic behavior of channel length variation in Si-NW biosensors. In addition, we have defined the percentage change of sensitivity variation in channel length as:
The percentage change of sensitivity variation in channel length(PLenght)
where <SL> is the average of the sensitivity variation in channel length, and σSL is the
standard deviation of the sensitivity variation in channel length.
Fig. 2-11(a) shows the impact of channel length variation on the heavily-doped cases. It can be seen that <SL> and σSL increase with decreasing channel length. This
is because the sensitivity scales reversely with the channel length. Fig. 2-11(b) shows the impact of channel length variation on the lightly doped cases. It can be seen that <SL> slowly increases with decreasing channel length. However, the σSL decreases
with the channel length because the sensitivity in short-channel-length devices is saturated. In other words, the sensitivity in short channel length only has a small fluctuation of considering the channel length variation. Furthermore, our simulation indicates that PLength is negligible, no matter for lightly- or heavily-doped cases. Hence,
lightly-doped channel and short channel length should be employed for higher sensitivity.
2-3.3 Impact of Random Dopant Fluctuation on The Sensitivity of
Si-NW Biosensors
In this section, we investigate the impact of random dopant fluctuations (RDF) by performing 3-D atomistic simulation [2.23]. Fig. 2-12(a) shows a Si-NW biosensor with the traditional simulation approach. It can be seen that the dopants are continuously distributed in the Si-NW. However, a Si-NW biosensor is performed with 3-D atomistic simulation shown in Fig. 2-12(b). Each dopant is treated as individually distributed in the channel.
The simulation methodology of atomistic simulation approaches can be divided into three steps: In the first step: The dopant number fluctuations are governed by Poisson distribution function [2.24] expressed as:
,
·!
,
(2-11)
where N is the expected dopant number in Si-NW, x is the number of occurrences of the dopant number, and P is the probability of x occurrences. The dopant numbers in the channel can be randomly generated by equation (2-11). In the second step: We build a large matrix equivalent to the lattice structure in the Si-NW region and randomly place dopants in it. In the third step: Each dopant in the Si-NW region is assigned to the nearest grid of lattice structure with a corresponding doping concentration, VN
S _NW. Where N is the total number of grids, and VS _NW is the
volume of Si-NW.
We have performed Monte Carlo simulation with 100 samples to capture the stochastic behavior of random dopant fluctuations in Si-NW biosensors. Fig.2-13 shows the statistical fluctuations for 100 different Si-NW biosensors. It can be seen that the sensitivity of Si-NW biosensors shows large fluctuations from the mean value. The variations due to the ransom dopant fluctuations would be a severely problem for the detection of one biomolecule. As mentioned before [2.11], there exists a lower limit of channel doping concentration ND for Si-NW biosensors. When channel
doping density is below ND, the sensitivity will have unpredictable variations. For
further examination, we have defined the percentage change of sensitivity variation in RDF as:
The percentage change of sensitivity variation in RDF (PRDF)
%
,
(2-12)
where <SRDF> is the average of the sensitivity variation in RDF, and σSRDF is the
standard deviation of the sensitivity variation in RDF.
Fig. 2-14(a) shows the impact of random dopant fluctuations on the heavily-doped cases. It can be seen that <SRDF> and σSRDF increase inversely with the
channel length. However, the PRDF decreases with the channel length because <SRDF>
increases faster than σSRDF with decreasing channel length. When the channel length
is 1.75µm/0.1µm, the corresponding PRDF is 78.5%/28.6%, and the corresponding <SRDF>
is 0.004/0.424, respectively. For the heavily-doped cases, our simulation results indicate that the short-channel Si-NW biosensor has smaller percentage change of sensitivity variation in RDF and larger sensitivity than the long-channel case.
Fig. 2-14(b) shows the impact of random dopant fluctuations on the lightly-doped cases. It can be seen that <SRDF> is insensitive with the channel length
because the sensitivity in light doping is saturated. However, σSRDF decreases with the
channel length because the sensitivity in short channel length is saturated. In other words, the sensitivity in short channel length only has a small change with random dopant fluctuations. Moreover, the figure shows that PRDF decreases with the channel
length. When the channel length is 1.75µm/0.1µm, the corresponding PRDF is
19.85%/1.35%, and the corresponding <SRDF> is 1.71/1.85. For the lightly-doped cases,
our simulation results indicate that the short-channel Si-NW biosensors have smaller percentage change of sensitivity variation in RDF and larger sensitivity than the long-channel cases.
For comparison of the lightly- and heavily-doped cases, the Si-NW biosensors with light doping have larger <SRDF> and PRDF than that with heavy doping. The
conclusion is that Si-NW biosensors with shorter channel length and lower channel doping can suppress the RDF effects and improve the sensitivity. In other words, we believe that the lower limit ND does not exist. Our simulation results seem to conflict
with the Purdue’ simulation results [2.11]. This is because they only consider the standard deviation of the sensitivity variation σSRDF. However, sometimes, σSRDF
increases with the sensitivity. Hence, for the further examination of the impact of RDF on sensitivity, our criterion PRDF is more reasonable and fair.
2-4 Quantum Mechanical Effects on The Sensitivity of
Silicon Nanowire Biosensors
The quantum effects have been demonstrated to have an undeniable influence on the nanoscale devices [2.25]. However, the impact of quantum effects on the nanoscale biosensors has rarely been investigated. Therefore, we quantitatively investigate the quantum effects on small-diameter nanowire biosenors for lightly- and heavily-doped cases in this section.
In this work, we use the density gradient model [2.26]-[2.27] to approximate the quantum mechanical effect. The density gradient function is a partial different function with a parameter γ which is sensitive to the electron distribution. Therefore, how to accurately estimate the parameter γ is a crucial problem in this quantum-mechanical simulation. The full Schrodinger equation solver, Silvaco [2.28],
is used to be a criterion for determination of the parameter γ. In first step, we use Silvaco simulation tool to solve the Schrodinger equation and find the exact electron distribution in the biosensor. In second step, we use the density gradient model in ISE [2.15] and adjust the parameter γ to find the electron distribution in the biosensor. Finally, we compare the solutions from the first step and the second step, and set the discrepancy between the two solutions within 2%. The Fig. 2-15 shows that the density gradient model calibrates with the exact Poisson-Schrodinger solution well when the parameter γ=15. The discrepancy of the two solutions is about 1.94%.
Fig. 2-16(a) shows the sensitivity with and without considering the quantum effect for Si-NW biosensors with heavy doping. The figure shows that with diameter scaling from 10nm to 3nm, the sensitivity without considering the quantum effect has a ~1.37X enhancement because of the increased surface to volume ratio. When considering the quantum effect, the enhancement of sensitivity can reache ~1.42X. According to equation (2-2), the driving force of the sensitivity enhancements can be divided into the surface to volume ratio (d/4) part and the effective doping concentration (1/Neff) part. Compared with excluding the quantum effect, the
sensitivity of Si-NW biosensors with considering the quantum effect has more improvements because of the effective doping concentration limited by the quantum effects [2.29].
Fig. 2-16(b) shows the sensitivity with and without considering the quantum effects for Si-NW biosensors with light doping. The figure shows that with diameter scaling from 10nm to 3nm, the sensitivity without/with considering the quantum effect has a ~1.13X/~1.19X enhancement.
For the further examination, we define the percentage enhancements of considering the quantum effect as:
S
increase Swith‐SwithoutSwithout
·100%,
(2-13)
where S is the sensitivity of Si-NW biosensors with considering the quantum effect, S is the sensitivity of Si-NW biosensors without considering the quantum effect. The comparison of the Sincrease for lightly- and heavily-doped Si-NW
biosensors indicates that sensitivity in the heavily-doped case has more enhancements. Even though the sensitivity is enhanced more by the quantum effects in the heavily-doped case, the sensitivity for heavy doping concentration is far less than that for lightly doping concentration. Hence, even considering the quantum effect, the lightly-doped channel is still a better choice. Moreover, it can be seen that when the diameter near ~10nm, the Sincrease are 3.95% and 0.4% for heavily- and lightly-doped
cases, respectively. The quantum effects on the sensitivity do not seem to have significant enhancements, especially in lightly-doped cases. In other word, we can only consider the classical model when diameter beyond ~10nm.
2.5 Conclusion
Our conclusions for this chapter are summarized as follows:
(1) Our simulation flow for Si-NW biosensors has been demonstrated.
(2) The sensitivity of Si-NW biosensors increases with smaller diameter, shorter channel length, and lower channel doping concentration.
(3) The sensitivity variation in diameter increases with decreasing diameter. Hence, for suppression of the sensitivity variation in diameter, the Si-NW biosensors with should be design at lower doping.
(4) Because the normalized sensitivity variation in the channel length is negligible, shorter channel length and lower doping concentration should be employed for the Si-NW biosensor design.
(5) Considering the impact of RDF on the sensitivity variation, the short-channel Si-NW biosensors have larger <SRDF> and smaller PRDF than the long-channel
cases. Hence, shorter channel length and lower channel doping should be employed for smaller RDF effects and higher sensitivity of Si-NW biosensors. (6) Though the sensitivity is enhanced more by the quantum effect in the
heavily-doped case, the sensitivity in the heavily-doped case is far less than in the lightly-doped case. Hence, even considering the quantum effect, the lightly-doped channel is still a better choice.
References
[2.1] D. C. H. Burgess, J. Wasserman, and C. A. Dahl, “Global health diagnostics,” Nautre, vol. 444, pp. 1-2, 2006.
[2.2] D. V. Lim, M. M. Simpson, E. A. Kearns, “Current and developing technologies for monitoring agents of bioterrorism and biowarfare,” Clin. Microbiol. Rev., vol. 18, no.4, pp. 583-607, Oct. 2005.
[2.3] F. S. Ligier and J. S. Erickson, “Bioengineering: diagnosis on disc,” Nature, vol. 440, no. 7081, pp. 159-160m Nar, 2006.
[2.4] W. M. Siu and R. S. C. Cobbold, “Basic properties of the electrolyte-sio2-si system: physical and theoretical aspects,” IEEE Trans. Electron devices, vol. 26, no. 11, NOV. 1979.
[2.5] S. M. Sze, Physics of Semiconductor Devices, third edition 2007.
[2.6] P. R. Nair, and M. A. Alam, “Performance limits of nanobiosensors,” Applied Physics Letters, vol. 88, 2006.
[2.7] R. J. Lipschutz, S. P. A. Fodor et al, “High density synthetic oligonucleotide arrays,” Nat. Genet., vol. 21, pp.20-24, 1999.
[2.8] M. Curreli et. al, “Real-time, label-free detection of biological entities using nanowire-based FETs,” IEEE Trans. Nanotech., vol. 7, no.6, NOV. 2008.
[2.9] F. Patolsky, and C. M. Lieber, “Nanowire nanosernsors,” Materials Today, April, 2005.
[2.10] A. Asenov, S. Kaya, and A. R. Brown, “Intrinsic parameter fluctuations in decananomwter MOSFETs intruducd by Gage line edge roughness,” IEEE Trans. On Electron Devices, vol. 50, no.5, May 2003.
[2.11] P. R. Nair and A. M. Alam,” Design considerations of silicon nanowire biosensors,” IEEE TED, vol. 54, no. 12, December 2007.
[2.12] D. McQuarrie, Statistical Mechanics. New York: Harper & Row,1976.
[2.13] M. Holst, “The Poisson-Boltzmann equation: analysis and multilevel numerical solution,” in “Applied Mathematics and CRPC,” California inst. Technol., Pasadena, CA, 1994. Tech. Rep.
[2.14] http://www.comsol.com/
[2.15] http://www.synopsys.com/home.aspx
[2.16] G. Zheng et. al, “Multiplexed electrical detection of cancer markers with nanowire sensor arrays,” Nat. Biotechnol., vol. 23, no. 10, pp. 1294-1301, Oct. 2005.
[2.17] A. L. Carvalho, L. Sanz, D. Barettino, A. Romero, J. J. Calvete, and M. J. Romao, “Crystal structure of prostate kallikrein iolated from stallion seminal plasma: A homologue of human PSA,” J. Mol. Biol., vol. 322-337, Sep. 2002. [2.18] http://www.ncbi.nlm.nih.gov/protein/24158620?report=GenPept
[2.19] http://www.scripps.edu/~cdputnam/protcalc.html [2.20] http://www.itrs.net/
[2.21] A. Dixit, K. G. Anil, E. Baravelli, P. Roussel, A. Mercha, C. Gustin, M. Bamal, E. Grossar, R. Rooyachers, E. Augendre, M. Jurczak, S. Biesemans, and K. D. Meyer, “Impact of stochastic mismatch on measure SRAM performance of FinFETs with resist/ spacer-defined fins: role of line-edge-roughness,” in Proc. IEDM Tech. Dig., 2006.
[2.22] E. Baravelli, M. Jurczak, N. Speciale, K. D. Meyer, and A. Dixit, “Impact of ler and random dopant fluctuations on FinFET matching performance,” IEEE Transactions on nanotechnology, vol. 7, no. 3, MAY 2008.
[2.23] D. J. Frank, Y. Taur, M. Ieong, and H-S P. Wong, “Monte carlo modeling of threshold variation due to dopant fluctuations,” Symp. On VLSI Tech. Dig., pp.171-172, 1999.
[2.24] H. S. Wong and Y. Taur, “Three-Dimensional “atomistic” simulation of discrete random dopant distribution effects in sub-0.1µm MOSFETs,” IEDM Tech. Dig., pp. 705-708, 1993.
[2.25] A. Asenov, A. R. Brown, and J. R. Watling, “Quantum corrections in the simulation of decanano MOSFETs,” Solid-State Electronics, vol. 47, no. 7,
July 2003.
[2.26] M. G. Ancona and H. F. Tiersten, “Macroscopic physics of the silicon inversion layer,” Phys. Rev. B, vol. 35, no. 15, pp. 7959–7965, May, 1987. [2.27] M. G. Ancona and G. J. Iafrate, “Quantum correction to the equation of state
of an electron gas in a semiconductor,” Phys. Rev. B, vol. 39, no. 13, pp. 9536–9540, May, 1989.
[2.28] http://www.silvaco.com/
[2.29] S. Datta, Quantum Transport: Atom to Transistor, chapter 7.3, pp 170-176 (Cambridge University Press, New York, 2005).
Fig. 2-1. Schematic sketch of a Si-NW biosensor.
Thermal oxide
Fig. 2-2. (a) The biomolecules detecting system which can be separated to (b) the electrolyte region, and (c) the semiconductor region.
(c) The semiconductor region
(b) The electrolyte solution region
Fig. 2-3. Simulation procedure for a Si-NW biosensor. Calculate the sensitivity of
Si-NW biosensors
Input the source bias and drain bias Vary the design
parameters such as the diameter, channel length, channel doping
concentration
Investigate and analyse the sensitivity of various design parameters and systematically optimize the sensor design.
Si‐NW
Take surface charge density as boundary condition and use the ISE simulation tool [*] to solve the DD model & Poisson equation in channel
Categorize the simulation results and build the sensitivity table
of design parameters
Input characteristics of a biological molecule, including
charge quantity, position and the electrolyte concentration Input the design parameters
such as the diameter, channel length, channel doping concentration, and material
properties to construct the structure
Use COMSOL physical simulation tool [*] to solve the Poisson-Boltzmann equation and calculate charge density on the surface
(a)
Fig. 2-4. Simulation of the PSA molecule. (a) The net charge of a PSA molecule depends on the pH value of solution. (b) Comparison of simulation results with the Harvard experimental data [2.16].
(b)
4 5 6 7 8 9 -20 -15 -10 -5 0 5 10 15 20 25c
h
ar
ge (e
.u)
pH
sim
isoelectric point4
5
6
7
8
10
-810
-710
-6∆
G (S)
pH
sim
exp
Fig. 2-5. Sensitivity of Si-NW biosensors as a function of (a) channel length, and (b) diameter for various channel doping concentrations.
(b)
(a)
0.0 0.2 0.4 0.6 0.8 1.0 1.2 1.4 1.6 1.8 10-3 10-2 10-1 100 101 S e nsitivity channel length(
µm)
1e19 1e18 1e17 1e15 diameter=20nm 10 20 30 40 50 10-4 10-3 10-2 10-1 100 101 Sensitivity diameter (nm) 1e19 1e18 1e17 1e15 channel length=1.25µmFig. 2-6. In the Si-NW biosensors, the resistance change is insensitive to the channel length scaling.
0.0
0.5
1.0
1.5
2.0
10
110
210
310
410
510
6∆
R
(ohm)
channel length (µm)
diameter=20nm
Fig. 2-7. Schematic sketch of a Si-NW biosensors with ±3σ diameter variation.
D-3σ
D+3σ
10
15
20
25
30
35
40
10
-310
-210
-110
01e15
channel length=1.25
µ
m
1e17
1e18
∆
S
Ddiameter
(
nm
)
Fig. 2-8. Impact of diameter variation on the sensitivity of Si-NW biosensors for different channel doping concentrations.
Fig. 2-9. The percentage change of the sensitivity variation for various diameters and channel doping.
10
15
20
25
30
35
40
0
4
8
12
16
P
D
iamet
er
(%)
diameter (nm)
1e15
1e17
1e18
Fig. 2-10. (a) Schematic sketch of a Si-NW biosensors with channel length variation, ∆L. (b) Gaussian distribution of the channel length variation. The figure includes 500 ensembles.
(b)
(a)
channel length
variation
L
biosensor
ΔL
0 20 40 60 80 100 0 2 4 2 4fr
eq
ue
nc
y
channel length variation,
∆
L (nm)
(a)
(b)
Fig. 2-11. Sensitivity variation in channel length for (a) heavily doped cases, and (b) lightly doped cases.
0.00 0.25 0.50 0.75 1.00 1.25 1.50 1.75 2.00
10
-410
-310
-2channel length
(
µ
m
)
σ
S
L10
-110
010
1 0.14 0.16 0.11 0.10 0.06 0.04 0.03P
Length%
channel doping=1e15 cm-3
diameter=20nm
<S
L>
0.00 0.25 0.50 0.75 1.00 1.25 1.50 1.75 2.00
10
-510
-410
-310
-2 0.11 0.30 0.09 0.12channel length
(
µ
m
)
σ
S
LP
Length%
10
-310
-210
-1 0.15 0.64 2.14<S
L>
channel doping=1e18 cm-3
diameter=20nm
Fig. 2-12. Schematic sketch of a Si-NW device with (a) continuous doping, and (b) individually dopants distributed in the channel.
(b)
(a)
source
drain
channel
channel
source
drain
Fig. 2-13. Statistical fluctuations in sensitivity due to random dopant fluctuations.
0.00
0.01
0.02
0.03
0.04
0.05
5
10
15
20
25
30
35
prob
ab
ilit
y d
ist
ribu
tio
n
%
∆
G/G
0channel doping=1e18cm-3
channel length=1
µ
m
diameter =20nm
(a)
Fig. 2-14. Impact of the random dopant fluctuations for (a) heavily-doped, and (b) lightly-doped Si-NW biosensors for various channel length.
(b)
0.00 0.25 0.50 0.75 1.00 1.25 1.50 1.75 2.00 10-2 10-1 100 101channel length
(
µ
m
)
σ
S
RD F 1.35%3.06% 9.08% 13.65%14.99% 18.97% 19.85%channel doping=1e15/cm3
diameter=20nm
100 101<S
RD F>
P
RDF0.00 0.25 0.50 0.75 1.00 1.25 1.50 1.75 2.00
10
-410
-310
-210
-110
010
1channel length
(
µ
m
)
σ
S
RDF10
-410
-310
-210
-110
010
1<S
RDF>
P
RDF 28.6%39.0% 43.8% 63.2% 62.3% 61.9% 78.5%channel doping=1e18/cm
3diameter=20nm
Fig. 2-15. When the density gradient parameter =15, the exact solution of coupled Poisson-Schrodinger equations can be captured well by our ISE simulation.
16
17
18
19
-6
-4
-2
2
4
6
log
10
(electro
n con
c
en
tration
)
transverse cross section (nm)
schrodinger (silvaco)
density gradient,
γ
=15
diameter=10nm
channel doping=1e18 cm
-30
D
γ = 15
Schrodinger (silvaco)
density gradient,
(a)
S
increasS
increas(b)
Fig. 2-16. Impact of quantum effects on (a) heavily-doped, and (b) lightly-doped Si-NW biosensors
2
4
6
8
10
0.016
0.020
0.024
0.028
0.032
0.036
increacc of consider Q.M.channel doping=1x10
18
cm
-3
channel length=1
µm
consider Q.M.
w/o consider Q.M.
diameter (nm)
Sensitivity
7.13% 6.44% 5.28% 3.95%2
4
6
8
10
1.1
1.2
1.3
1.4
1.5
1.6
channel doping=1x1015cm-3
channel length=1
µm
consider Q.M.
w/o consider Q.M.
diameter (nm)
Se
ns
itiv
it
y
increasement of consider Q.M. 5.25% 2.98% 1.62% 0.4%Chapter3
Investigation of Si-NW Biosensors with
Electro-Diffusion Flow
3-1 Introduction
In recent years, biosensor based on silicon nanowire (Si-NW) is one of the widely research topics in bio-technology, and it has been demonstrated to serve as a highly sensitive label-free sensor for charged biological molecules, such as DNAs and proteins [3.1]-[3.3]. The biomolecules in the electrolyte diffuse to the surface of Si-NW and get captured by the receptors in the oxide layer surface. And then, the conductivity of the Si-NW is modulated by the Coulomb interaction between the biomolecules in electrolyte solution and carriers in semiconductor. Therefore how to increase the Coulomb interaction and suppress the screening effect due to the ions around the charged biomlecules is a crucial issue. In 2008 IEDM, the research group at Stanford [3.4] has proposed a method using the electro-diffusion flow to overcome the screening-induced performance limits of Si-NW biosensors. This method has significantly improved the Si-NW signal strength and pointed out a new direction to design the Si-NW biosensor.
However, the Stanford’s research only considers the performance of Si-NW biosensors operating in different electrolyte concentrations. The impacts of other design parameters, such as diameter and channel doping concentration, are short of discussion. Although it is generally accepted that the doping density determines the
sensitivity of Si-NW biosensors, not the doping type (n- or p-type) [3.5]-[3.6], whether it applies for Si-NW biosensors with electro-diffusion current flow remains unclear. Furthermore, in the past decade, the biosensors have been progressively miniaturized for the better performance [3.6]. With the device scaling, the quantum mechanical effects may play an important role in determining the performance of Si-NW biosensors. However, the impacts of quantum effects on the nanowire biosensors have rarely been investigated.
Therefore, in this chapter, we investigate the impacts of various design parameters and quantum effects on SI-NW biosensors. In Section 3-2, we develop a simulation flow considering the screening effect, and investigate the suppression of the screening effect by introducing electro-diffusion current flow in the electrolyte solution. In Section 3-3, we present our results for Si-NW biosensors operating in both accumulation mode and depletion mode with various channel diameters, channel doping concentrations, and ion concentrations in the electrolyte solution. Section 3-4 gives the details of quantum effects for small-diameter Si-NW biosensors with solution bias. In Section 3-5, we discuss and summarize the sensitivity of Si-NW biosensors associated with the design parameters.
3-2 Simulation Approach and Calibration
3-2.1 Equivalent Circuit Model
Fig. 3-1(a) is the proposed biomolecules detecting system [3.4] which consists of a Si-NW and two biased electrodes. The two biased electrode can generate the
electrical field and the mobile ions around the biomolecule is moved. The behavior of screening effect changed by the solution bias can be further illustrated as the Fig. 3-2. In the case (a): a biosensor without using solution bias (Fig. 3-2(a)). We assume there is a biomolecule with negative charge –Q in serum which is effectively shielded by counter-ions and it is captured by a 2nm receptor. According to the Debye-Huckel theory, the Debye length is 0.7nm for 180mM ion concentration [3.7] that is very close the concentration of serum. It dictates that the negative charge –Q cannot be detected when the detecting distance, from oxide surface to the biological charge (2nm), is beyond the Debye length (0.7nm).
We can use an equivalent circuit model to illustrate the behavior of screening effect with and without biased electrodes in Fig. 3-2(a) and Fig. 3-2(b), respectively. Where CSC is a various capacitance of screening effect in the electrolyte solution and
the CSi is a capacitance in the silicon. The total image charge QTOTAL equals to the
induced charge QSi in the silicon plus the induced charge QSC in the electrolyte
solution and QSC are determined by the screening capacitance CSC. In the case (b): a
biosensor with solution bias (Fig. 3-1(b)). When the electro-diffusion flow diminishes the accumulated ions in the vicinity of biomolecules, the Debye length is no longer limited by the screening effect and the screening capacitance CSC is dramatically
reduced, which leads to the increase of QSi in silicon.
3-2.2 Simulation Approach
The system of a Si-NW biosensor with solution bias can be divided into two sub-regions, as shown in Fig. 3-1(b) and Fig. 3-1(c). The first region, A, is the electrolyte solution that contains target biomolecules and courter-ions around the
charged biomolecules. The second region, B, is Si-NW and oxide. In the following paragraph, we sequentially discuss the physical models for the two regions.
1) Region A: the ion transport in the electrolyte solution is modeled by the Poisson-Nearst-Plank (PNP) equations [3.8].
,
(3-1)
·
,
(3-2)
·
,
(3-3)
where the subscripts +/- are corresponding to cation/anion, εω is the dielectric
constant in water, q is the elementary charge, C is the ion concentration, µ is the mobility, and Φ is the electrostatic potential. This continuum modeling approach has been firmly established in describing the transport of mobile ions in bulk condition [3.9]. It can be broadly applied to simulate ion transport in open ion channel when the pore radius is over two times of Debye length [3.10].
2) Region B: the carrier transport and the potential in Si-NW are modeled by the drift-diffusion equation and Poisson’s equation.
, , , , ,
,
(3-4)
·
),
(3-5)
where J is the current density, q is the elementary charge, µ is the mobility, n is the carrier density, D is the diffusion coefficient, and Ndop is the net impurity
concentration. Φ is the electrostatic potential which is determined by the potential applied at the electrodes. The subscripts “e,h” are corresponding to
electron / hole, respectively. We assume the dopants in silicon are completely ionized.
Equation (3-1)-(3-5) are the physical models for the Si-NW biosensor with solution bias. We separate the numerical method into following five main steps to solve the above equations.
In the first step: The PNP equation is solved self-consistently by a numerical solver, COMSOL physical simulation tool [3.11] in region A. We can categorize the numerical results, including the ion concentration and ionic flux, to build a parameter table “PCOMSOL”.
In the second step: We use the semiconductor simulation tool, ISE [3.12], to connect the “silicon region” and “electrolyte solution region”. Since the ISE simulation tool does not support the material of electrolyte solution, we have to create a new material Melectrolyte solution to represent the electrolyte solution in the
ISE simulation tool. The default parameter settings of Melectrolyte solution is
replaced by the parameter table “PCOMSOL”.
In the third step: We use the ISE simulation tool to solve those self-consistently coupled Equations (3-1)-(3-5), and the sensitivity of Si-NW biosensors can be calculated under specified operating bias.
In the fourth step: Vary the design parameters in the first, second, and third steps, sequentially. We collect and categorize the simulation results to build the sensitivity table for different design parameters.
In the fifth step: We investigate and analyze the sensitivity for various design parameters and systematically optimize the design parameters of Si-NW biosensors.
In summary, a scheme for the simulation procedure of Si-NW biosensors with the solution bias is shown in the Fig. 3-3.
3-2.3 Calibration
To confirm that our biosensors simulation results are robust and reliable, we demonstrate the behavior of “the induced charge Q’ over the Qdop” ratio1 in the Si-NW
biosensor (in this case, the biosensor without binding any biomolecules) with varied solution bias from 0V to 3V. The induced charge Q’ is defined as the integration of induced charge over the channel and the Qdop is defined as the integration of channel
doping concentration over the channel. Compared with the Stanford simulation results is shown in Fig. 3-4, we show our simulation results agree well with Stanford simulation results and the ratio of the induced charge Q’ to Qdop increases with the
solution bias because electric field in the electrolyte solution increases with solution bias and induces more charge in the biosensor.
We demonstrate the potential change with and without applying solution bias in Fig. 3-5(a) and Fig. 3-5(b). At 0V, the screening effect severely limits the potential change within the Debye length. At 1V, the screening effect is suppressed by the electro-diffusion flow. Therefore, the potential change spreads over a much broader space and penetrates more into the Si-NW.