Short Paper
_________________________________________________
Ranking Genes for Discriminability on Microarray Data
HAN-YU CHUANG, HUAI-KUANG TSAI, YUAN-FAN TSAI AND CHENG-YAN KAO
Department of Computer Science and Information Engineering National Taiwan University
Taipei, 106 Taiwan
E-mail: {r90002, d7526010, cykao}@csie.ntu.edu.tw
This paper proposes a new feature selection method, called weighted punishment on overlap (WEPO), for microarray data analysis. WEPO takes advantage of parametric and nonparametric estimations to rank genes sensitively despite the limited number of sam-ples. The proposed method was implemented and applied to three datasets. Based on in-formative testing, sensitivity testing, and significance testing, we analyzed the perform-ance of WEPO and five well-known feature selection methods. Analysis results indicate that genes selected using WEPO are more informative and sensitive than those selected using the other surveyed methods and are statistically significant. Biological results also show that WEPO is able to identify meaningful genes for test data sets. The analysis and ex-perimental results indicate that WEPO is a promising approach to select important genes in a microarray data.
Keywords: feature selection, microarray, weighted punishment on overlap, z-score,
sup-port vector machine, ranking-based
1. INTRODUCTION
Microarrays have provided a way to measure the expression levels of a large num-ber of genes simultaneously. Researchers have developed diagnostic tools by adapting this technique to profile the gene expression patterns of disease tissues [1-3]. Such pro-filing data may involve many thousands of genes and hundreds of tissue samples. The tissues are labeled according to certain classes, such as normal or tumor tissues. Genes that are differentially expressed in two classes are thought of as relevant genes. However, many genes in the profiling data may be irrelevant to the disease and result in incorrect clustering and misclassifications. To eliminate those “probable noise” genes, some fea-ture selection approaches have been proposed to select informative and discrimitive genes from the profiling data.
Feature selection methods, which have received much attention in the classification literature [4, 5], can be roughly divided into linear combination and ranking approaches
Received November 1, 2002; accepted June 5, 2003. Communicated by Chuen-Tsai Sun.
in microarray data analysis. Linear combination approaches simplify the complex data by finding some new variables which are linear combinations of the original variables. For instance, principal component analysis (PCA) [6], an exploratory multivariate statistical technique, finds some mutually uncorrelated and orthogonal principal components to reduce the dimensionality of the data matrix. However, this kind of method cannot dis-cover relevant genes individually.
Ranking methods, on the other hand, score the discriminability of each gene based only on its own expression patterns. Two major scoring metrics of discriminability, pa-rametric and non papa-rametric estimations, have been proposed for carrying out such analysis. Parametric estimation approaches assess the discriminability of genes by using different statistical criterions to estimate the degree of compactness within the same classes and the separation between two classes [3, 7, 8]. Parametric estimation ap-proaches rank genes apart apparently. However, many statistical criteria are based on the assumption that the data come from some kind of distribution. With thousands of genes and only a small number of samples, the information may be lost since it is reduced to just a few estimators, such as values of mean and standard deviation. Thus, the process of detecting irrelevant genes can suffer from statistical instability [9].
Nonparametricestimation approaches sort samples according to the expression lev-els a gene produces and make punishments on the disorder of ambiguous samples which damage a perfect split of different classes [9, 10]. Since these nonparametric estimation approaches use some ranking orders rather than actual expression levels, they are more robust to outliers but also lose information about the degree of compactness.As a result, this kind of method separates genes into only a limited number of ranks, which is less sensitive than parametric estimation.
In this paper, a new ranking approach, called weighted punishment on overlap (WEPO), is proposed. WEPO takes advantages of parametric and nonparametric estima-tions to rank genes sensitively despite the limited number of samples. For each gene, the expression levels of samples are first normalized by using the z-score to eliminate the scaling problem. Then, the samples are sorted according to the normalized expression levels. The punished score of each gene is calculated by estimating the overlapping re-gions of two classes. Genes with smaller punished scores are considered to be discrimi-native.
Our approach was tested on three microarray datasets. The support vector machine (LIBSVM) [11] was used to verify the discriminability of the selected genes. We show the robustness and sensitivity of the proposed approach by comparing five well-known feature selection approaches through informative testing, sensitive testing, and signifi-cance testing. The experiments show that our method is competitive with these surveyed parametric and nonparametric methods. Genes selected using WEPO are more informa-tive and sensiinforma-tive than those selected using the surveyed methods both in statistical tests and biological meanings.
The rest of this paper is organized as follows. Section 2 demonstrates the proposed approaches. Section 3 evaluates WEPO based on the results of informative, sensitive, and significance testing. Section 4 discusses the biological meanings by applying WEPO to colon adenocarcinoma data sets and gives conclusions.
2. METHODOLOGY
In this section, the details of the proposed approach, weighted punishment on over-lap (WEPO), for gene selection with microarray data are presented. WEPO is based on the assumption that if a gene is differentially expressed between two classes, the expres-sion value of this gene of different groups should come from two quite different distribu-tions. Hence, WEPO scores a gene by estimating the ambiguous region of the expression levels of the samples of two classes to measure the correspondence between the expres-sion levels of a gene and the group membership. For each gene, the expresexpres-sion levels of samples are first normalized by using the z-score to eliminate the problem of scaling. Then, the samples are sorted according to the normalized expression levels. The pun-ished score of each gene is calculated by estimating the overlapping regions of two classes. In the following subsections, the data scaling, sorting, estimating and scoring steps are described.
2.1 Scaling for Comparable Genes
Assume that there are n samples and k genes in the dataset. For gene Gi, 1 ≤ i ≤ k,
the corresponding gene expression levels in these samples are represented as (gi1, gi2,…,
gin). For each gene, we would like to get a score based on their expression levels. Since
the scale of gene expression profiles varies among genes, scaling adjustments are re-quired so that genes can be compared fairly. In this paper, the standardized measurement (z-score) is used to normalize the gene expression profiles:
i i ij ij m g z σ − = , 1 ≤ j ≤ n, 1 ≤ i ≤ k, (1) where σi, the mean absolute deviation, is defined as
(
| 1 | | 2 | | |)
1 i in i i i i n i = g −m + g −m +⋅ ⋅⋅+ g −m σ , (2) and mi is the mean value of (gi1, gi2, …, gin), that is,(
i i in)
n
i g g g
m = 1 1+ 2+⋅ ⋅⋅+ . (3) 2.2 Sorting, Estimating, and Scoring
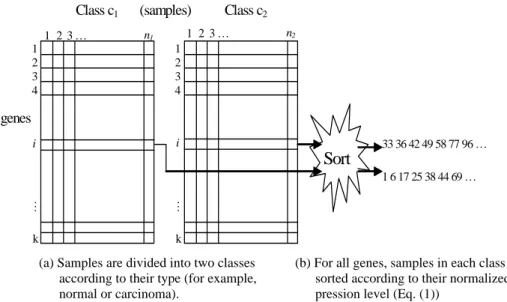
We assume that there are n samples in two classes, c1 and c2, with n1 samples in class c1 and n2 samples in class c2. After the data are normalized, WEPO works as fol-lows to score a gene Gi, 1 ≤ i ≤ k. Firstly, two classes of samples are separated (Fig. 1(a)).
Then samples in each class are sorted according to the normalized expression levels, Zij
(Fig. 1(b)). For classes c1 and c2, the sorted expression levels of their samples form two expression levels, vector1 and vector2. If a gene can be used to discriminate two classes exactly, then vector1 and vector2 are non-overlapping. The overlapping region between two vectors represents the ambiguous region between the distributions of two classes.
For example, there are two vectors in Fig. 1(b) for classes c1 and c2, (33, 36, 42, 49, 58, 77, 96) and (1, 6, 17, 25, 38, 44, 69), respectively. If we plot these points in one
di-mension as shown in Fig. 2, then some overlapping region will be found (the shadow part).
Class c1 (samples) Class c2
i i n2 1 2 3 … n1 1 2 k … 1 2 3 4 k … 1 2 3 4 3 … genes 1 6 17 25 38 44 69 … 33 36 42 49 58 77 96 …
Sort
(a). Samples are divided into two classes according to their type (for example, normal or carcinoma).
(b). For all genes, samples in each class are sorted according to their normalized expression level (Equation 1).
Fig. 1. The first step of WEPO. Samples are separated into two classes according to their labels, for example, normal or disease, as shown in (a). For each gene, samples in each class are sorted based on their normalized expression level (as shown in (b)).
0 10 20 30 40 50 60 70 80 90 100
Fig. 2. Two expression level vectors, (33,36,42,49,58,77,96) and (1,6,17,25,38,44,69), from two distributions. The overlap between these two distributions is illustrated by the gray rectan-gle.
For each point in the ambiguous region, punishment is required to move it to the side of its original group. This punishment is defined as
,
)
(
1 2∑ ∑
∈ ∈−
Ψ
class p p class p p i j i jz
z
( ) 0,, 00. > ≤ = Ψ z z zz (4) (a) Samples are divided into two classesaccording to their type (for example, normal or carcinoma).
(b) For all genes, samples in each class are sorted according to their normalized ex-pression level (Eq. (1))
This formulation, representing the degree of compactness of two distributions, cal-culates the weighted sum of the area by using the difference of normalized expression levels. WEPO defines the score of a gene in such way as to rank genes sensitively with-out losing the information abwith-out data distribution. Eq. (4) can be interpreted as swapping, for each element in the second group is exchanged with the elements in the first group that are larger, and the difference between them is summarized.
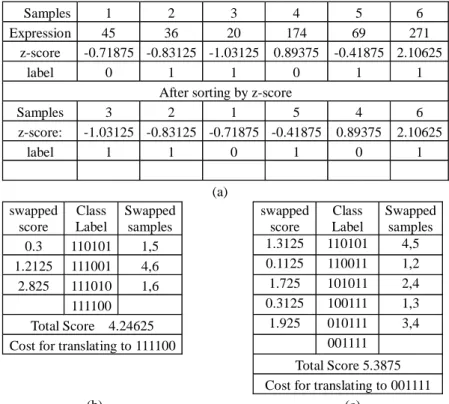
Fig. 3 shows an example of how WEPO scores a gene with six samples. Class label,
T = {t1, t2, …, tn}, represents the labels of samples, where ti represents the label of the
sample i, ti∈ {0, 1}. Samples are sorted using the z-score (zij), the normalized expression
levels. Base on the sorted class label T, we calculate a score for gene Gi as the minimum
swapping penalty of WEPO to arrive at a perfect split, with all the ones in the same cate-gory ti being consecutive in T (Fig. 3(b)(c)). Because genes with smaller scores are more
informative, the score for the gene is 4.24625 in this example.
Samples 1 2 3 4 5 6
Expression 45 36 20 174 69 271
z-score -0.71875 -0.83125 -1.03125 0.89375 -0.41875 2.10625 label 0 1 1 0 1 1
After sorting by z-score
Samples 3 2 1 5 4 6 z-score: -1.03125 -0.83125 -0.71875 -0.41875 0.89375 2.10625 label 1 1 0 1 0 1 (a) swapped score Class Label Swapped samples swapped score Class Label Swapped samples 0.3 110101 1,5 1.3125 110101 4,5 1.2125 111001 4,6 0.1125 110011 1,2 2.825 111010 1,6 1.725 101011 2,4 111100 0.3125 100111 1,3 Total Score 4.24625 1.925 010111 3,4
Cost for translating to 111100 001111
Total Score 5.3875 Cost for translating to 001111
(b) (c)
Fig. 3. An example to demonstrate how WEPO scores a gene. For this gene, there are six samples with their gene expression and label (class 0 or 1). (a) shows the results for the gene ex-pression levels of these samples normalized using the z-score and sorted in increasing order. (b) and (c) show the process of calculating a WEPO score. The calculation steps are se-quentially displayed in rows in these tables. The score is the difference between two swapped patients. The total score is the sum of the scores derived in the steps until a perfect split is obtained. There are two ways to arrive at a perfect split in this case. Because genes with smaller scores are more informative, the score for the gene is 4.24625 in this example.
3. EVALUATION
We tested WEPO on three publicly available microarray datasets of cancers (sum-marized in Table 1) selected from previous studies [1, 2, 12] to show some characteris-tics of WEPO and to compare WEPO with other methods [3, 7-10]. We will discuss WEPO based on informativeness, sensitivity, and significance. The support vector ma-chine (LIBSVM) [11] was used as a classifier to verify the performance. Firstly, WEPO was compared with five well-known gene selection approaches through the informative testing. Secondly, WEPO was compared with some nonparametric approaches to show its sensitivity. Finally, the statistical p-value was used to verify the significance of the results of WEPO. Experimental results indicate that through WEPO gene selection, SVM can achieve high prediction accuracy. The results of informative testing show that WEPO is comparable with other gene selection methods. WEPO is more sensitive than the sur-veyed approaches, and genes selected using WEPO are statistical significant.
Table 1. Summary of the three data sets used in the experiment.
Dataset Adenocarcinoma Lymphoma Colon
Publisher Notterman et al. [12] Alizadeh et al. [1] Alon et al. [2]
# of genes 7457 5635 2000
# of samples 18 paired samples (18 “tumor”/ 18 “normal”) 40 samples (19 ”GCB”/ 21 “AB”) 62 samples (40 “tumor”/ 22 “normal”) 3.1 Classification – SVM
In this work, a Support Vector Machine (SVM) was used as a classifier to verify the performance of the gene selection methods. SVM is a machine learning algorithm pro-posed by Vladimir Vapnik and his co-workers [13]. It is based on the Structural Risk Minimization principle from statistical learning theory. SVM can be applied to different tasks such as regression, classification, and density estimation. For a binary classification task, given a training set with n class-labeled samples, (x1, y1), (x2, y2), ..., (xn, yn), where xi is a vector consisting of feature values that represent the ith sample, and yi∈{−1,+1} indicates the class, a SVM classifier learns a linear decision rule, which is represented using a hyperplane RN. The label of a previously unmarked sample x is determined by which side of the hyperplane x lies on. That is, all the examples on the one side of the hyperplane are labeled positive and the remaining on the other side are labeled negative. The goal of training the SVM is to find a hyperplane that has the maximum margin to separate two classes, as depicted in Fig. 4. For more details on SVM, please see [14, 15]. In the experiment, we used a SVM software package, LIBSVM [11].
3.2 Informative Testing
Informative testing was used to test whether the selected genes were really discrimi-tive of the studied issues. It was difficult to perform “real” informadiscrimi-tive testing to evaluate
Fig. 4. The basic idea of SVM. + and – denote data of different categories. The solid line represents the hyperplane with the maximum margin for separable data. The examples closest to the hyperplane are called Support Vectors (marked with circles).
the gene selection methods since we didn’t know the true status of the genes. One rea-sonable way to approximate informative testing is to test the effect of the genes on clas-sification accuracy. In this study, SVM was used to perform informative testing. Due to the limited number of samples, leave one out cross validation (LOOCV) was used [9]. In each LOOCV trial with n samples, we sequentially picked up a sample as the test set. The other n − 1 samples were treated as the training set. A gene selection method was applied to the training set to provide some selected genes for the SVM classifier to gen-erate a predictor. This predictor was used to predict the class of the sample in the test set. After sequentially picking up n genes, we summarized n prediction results as the classi-fication accuracy of the gene selection method.
Table 2 shows the performance of WEPO when applied to three different cancer datasets. The column “top-ranked genes” lists the top ranking genes selected by WEPO and used in SVM. For example, “1-10” means that SVM used the top ten ranked genes identified by WEPO. Each entry represents the classification accuracy. Among these cancer datasets, the subsets of genes selected using WEPO with sizes smaller than 1000 achieved classification accuracy above 80%. In the Adenocarcinoma and Lymphoma datasets, over 90% of the samples could be correctly predicted.
Table 2. The classification accuracy of three cancer data sets with genes selected by WEPO. The classification accuracy was calculated using LOOCV cross valida-tion (see the text). The column “top-ranked genes” lists the top ranking genes selected by WEPO and used in SVM.
Top-ranked genes Adenocarcinoma Acc. Lymphoma Acc. Colon Acc.
1~10 1 0.925 0.822581 1~50 0.888889 0.95 0.822581 1~100 0.888889 0.95 0.83871 1~200 0.916667 0.95 0.854839 1~300 0.944444 0.95 0.870968 1~400 0.944444 0.925 0.870968 1~500 0.972222 0.925 0.887097 1~600 0.916667 0.925 0.870968 1~700 0.916667 0.925 0.870968 1~800 0.944444 0.925 0.870968 1~900 0.916667 0.925 0.854839 1~1000 0.916667 0.9 0.870968
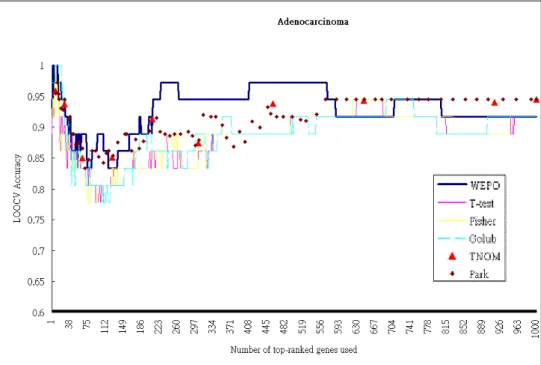
WEPO was compared with three parametric and two nonparametric feature selec-tion methods based on these datasets by using LOOCV and SVM. Each gene was as-signed a unique ranking by using statistical parametric methods, including t-test [7], Fisher [8] and Golub [3]. On the other hand, numbers of genes were appointed the same ranking in two well-known nonparametric methods TNoM [9] and Park [10]. To pre-cisely describe the characteristic features of the nonparametric methods, the average ac-curacy of the genes with the same nonparametric score were plotted as a dot at the end of their ranking range. Fig. 5 shows the results obtained using these selection methods and the Adenocarcinoma dataset. We got similar results for the other two datasets. As shown, although the behaviors of all the methods are similar, the results of WEPO were slightly better than those of the others. It is noted that WEPO outperformed the others on the points corresponding to fewer genes. This means that WEPO could give higher rankings for more informative genes. Comparing the parametric and the nonparametric approaches, the latter seem perform better than the former in classification accuracy.
Fig. 5. Comparison of LOOCV classification accuracy between WEPO and five gene selection methods. T-test, Fisher, and Golub are parametric methods. TNoM and Park are nonpara-metric methods.
3.3 Sensitive Testing
As mentioned above, there were several genes with the same score obtained using the nonparametric methods as shown in Fig. 5. However, we found that genes with the same nonparametric score had different influences on classification accuracy. To interpret
how this characteristic of nonparametric methods may cause slight confusion when se-lecting informative genes, we performed the following experiment. To calculate accuracy in specifying particular genes, all the samples in Adenocarcinoma dataset are partitioned into training and testing sets, instead of LOOCV. In Fig. 6(a), genes with three Park scores, 8, 18 and 38, are plotted, where the x-axis and y-axis are their WEPO and Park scores, respectively. It is easy to see that genes with the same Park score have different WEPO scores. One score curve, corresponding to one Park scores in Fig. 6(a), overlaps WEPO scores of the one with another Park score. These overlaps imply that the gene selection result for the Adenocarcinoma dataset obtained using Park methods may be quite different from that obtained using WEPO. Fig. 6(b) reveals the testing accuracy of these genes. We find that genes with the same Park score which correspond to a larger range of WEPO scores have greater variance in classification accuracy. Using the Park score in this case may reveal less idea about the goodness of genes within the same Park score class. In comparison, WEPO gives each gene a different score according to its ac-tual expression level. Similar results were obtained for different Park scores and datasets. We think that WEPO is more sensitive than Park in terms of gene ranking.
(a) (b)
Fig. 6. Some genes in the Adenocarcinoma dataset with Park scores of 8, 18 and 38 are plotted based on: (a) Park score v.s. WEPO score; (b) WEPO score v.s. corresponding classification accuracy. As can be seen, genes with the same Park score which correspond to a larger range of WEPO scores have greater variance in classification accuracy, which means that WEPO is more sensitive than Park in terms of gene ranking in this case.
3.4 Significance Testing
In this study, the significances of genes selected by WEPO were verified. First we examined whether low WEPO score were indicative of the classification of expression. Then a permutation test was performed to show that genes with low WEPO scores were really statistically significant, and that WEPO could select genes highly related to the studied issues.
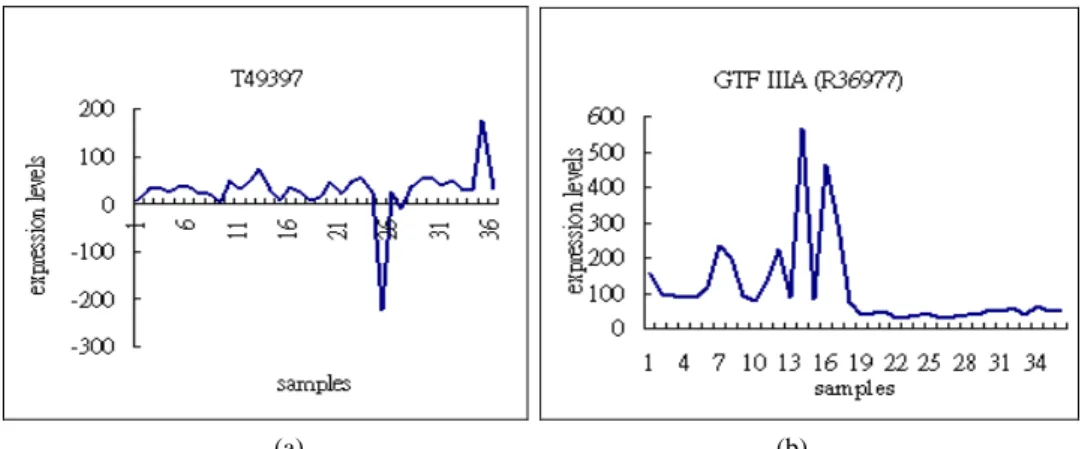
Observing the relationships between the WEPO scores and expression level of a gene, we found that in most cases, genes with low WEPO scores were indeed indicative of the classification of expression. For example, the two genes GTF IIIA and T49397 in the Adenocarcinoma dataset are plotted in Fig. 7, where the x-axis represents samples, and the y-axis represents expression levels. The first 18 samples on the x-axis are tumor
(a) (b)
Fig. 7. The expression levels for the two genes GTFIIIA and T49397 in the Adenocarcinoma data-set. There are 36 samples indicated on the x-axis, the first 18 of which are tumors and the remaining are normal. The WEPO scores of T49397 and GTFIIIA are 120 and 0, respec-tively. The expression level of GTFIIIA is uniformly higher for the first 18 samples than for the rest, while there is no difference in the expression levels of T49397 between the two groups.
tissues, and the remaining ones are normal tissues. The WEPO scores of T49397 and
GTF IIA are 120 and 0, respectively. Clearly, there is no difference in the expression
levels of T49397 between two groups. However, the expression profile of GTF IIIA has uniformly high expression levels for the first 18 samples and lower levels for the rest. In most cases, genes with lower WEPO scores tend to have different expression levels in the two groups.
To show the statistical significance of the scores obtained by scoring genes in the test dataset, we estimated the probability of getting such results from arbitrary data (p-value). Since there are no simple formulas for deriving null distributions of WEPO scores, a permutation test was adapted to judge whether the results of the Adenocarci-noma dataset were meaningful or accidental. The permutation test compared the distribu-tion of scores from the original cancer data with the null distribudistribu-tion obtained from ran-domly generated data where genes were independent of the cancer. Due to the biological knowledge that some genes are related in reaction, the correlation structure of the data should be preserved when calculating the null distribution. The simulated null distribu-tion is generated through the following three-steps.
Firstly, 10,000 random configurations of 18 0’s and 18 1’s representing tumor tis-sues and normal tistis-sues were generated. Secondly, by assigning 10,000 random configu-rations to data, we generated random permutations of the entire columns while keeping all the expression levels for each sample together. Finally, the null distribution of WEPO statistics from all genes of these permutations was calculated. By comparing the distribu-tion from the original data with the null distribudistribu-tion, a p-value, the probability of getting such scores from arbitrary data, could be computed.
In Fig. 8(a), we find that p-value increases as the rank of genes increases. The higher the rank of genes, the lower the WEPO score, which implies that lower WEPO score is significant. Fig. 8(b) shows a comparison of the p-values of the WEPO scores from the original data and from one column-permutated data. As observed, the p-values
(a) (b)
Fig. 8. (a) The p-value of the Adenocarcinoma data increases as an increasing number of top-genes peeled off. The p-values are compared with the 10000 random data. (b) Comparison of p-values between the original Adenoarcinoma data (Original) and the randomly generated data (No signal). The preceding fragment of the p-value curve of the original data is not visible due to the scale of p-value.
from the column-permutated data are much larger than those from the original data, and the p-value curve of the column-permutated data is nearly a horizontal line. Based on previous discussion, we conclude that WEPO can distinguish whether data have signals.
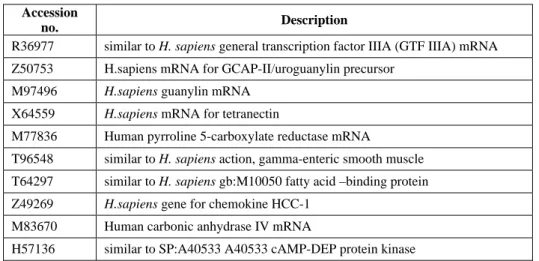
Table 3. Top 10 genes with lowest WEPO score in Adenocarcinoma data set.
Accession
no. Description
R36977 similar to H. sapiens general transcription factor IIIA (GTF IIIA) mRNA Z50753 H.sapiens mRNA for GCAP-II/uroguanylin precursor
M97496 H.sapiens guanylin mRNA
X64559 H.sapiens mRNA for tetranectin
M77836 Human pyrroline 5-carboxylate reductase mRNA
T96548 similar to H. sapiens action, gamma-enteric smooth muscle
T64297 similar to H. sapiens gb:M10050 fatty acid –binding protein
Z49269 H.sapiens gene for chemokine HCC-1
M83670 Human carbonic anhydrase IV mRNA
H57136 similar to SP:A40533 A40533 cAMP-DEP protein kinase
4. RESULTS AND CONCLUSIONS
We applied WEPO to the Adenocarcinoma dataset analyzed in [12]. Eighteen paired colon adenocarcinoma/normal tissue samples were used to select informative genes. The top 10 genes with the lowest scores are listed at Table 3. Most of these genes are highly related to this disease. As shown in Table 3, a substantial number of transcripts, such as
highly expressed in normal tissue than in paired cancer specimens. Consistent with [12], many of these transcripts simply represent smooth muscle or connective tissues layers more generously included with the normal than the neoplastic tissue samples. R36977 and M77836 were more highly expressed in colonic neoplasia than in normal tissue. Ac-cording to [12], R36977 is not associated with colon cancer in previous literature, but is linked to either some forms of neoplasia or to the regulation of the cell cycle. M77836 is related to altered levels of metabolism (rather than cancer growth per se).
This study has demonstrated that WEPO is a robust feature selection approach for microarray data. From our experience, we suggest that a good feature selection method for microarray data should have good mechanisms in order to be robust to outliers and to rank genes sensitively. In our approach, data are normalized using the z-score (sensitive), and genes are scored by estimating the overlapping region of two classes (robust to out-liers). Our experiments indicate that genes selected by WEPO are informative, sensitive, and significant.
Experiments conducted on three microarray data verify that the proposed approach is robust and is very competitive with surveyed methods. Specifically, genes selected by WEPO are biologically meaningful. We believe that the robustness of our approach makes it an effective tool for microarray data analysis and potential applications.
REFERENCES
1. A. A. Alizadeh, M. B. Eisen, and et al., “Distinct types of diffuse large B-cell lym-phoma identified by gene expression profiling,” Nature, Vol. 403, 2000, pp. 503- 511.
2. U. Alon, N. Barkai, and et al., “Broad patterns of gene expression revealed by clus-tering analysis of tumor and normal colon tissues probed by oligonucleotide arrays,” in Proceedings of the National Academy of Sciences, Vol. 96, 1999, pp. 6745-6750. 3. T. R. Golub, D. K. Slonim, and et al., “Molecular classification of cancer: Class
discovery and class prediction by gene expression monitoring,” Science, Vol. 286, 1999, pp. 531-537.
4. R. Kohavi and G. John, “Wrapper for feature subset selection,” Artificial
Intelli-gence, Vol. 97, 1979, pp. 273-324.
5. P. Langley, “Selection of relevant features in machine learning,” in Proceedings of
the AAAI Fall Symposium on Relevance, AAAI Press, 1994, pp. 140-144.
6. K. Y. Yeung and W. L. Ruzzo, “Principal component analysis for clustering gene expression data,” Bioinformatics, Vol. 17, 2001, pp. 763-774.
7. I. Hedenfalk, D. Duggan, Y. Chen, M. Radmacher, M. Bittner, R. Simon, P. Meltzer, B. Gusterson, M. Esteller, O.P. Kallioniemi, B. Wilfond, A. Borg, and J. Trent, “Gene-expression profiles in hereditary breast cancer,” New England J. Med., Vol. 8, 2001, pp. 344-539.
8. S. F. Terrence, D. Nigel, and et al., “Support vector machine classification and vali-dation of cancer tissue samples using microarray expression data,” Bioinformatics, Vol. 16, 2000, pp. 906-914.
9. A. Ben-Dor, L. Bruhn, and et al., “Tissue classification with gene expression pro-files,” Journal of Computational Biology, Vol. 7, 2000, pp. 559-583.
10. P. J. Park, M. Pagano, and M. Bonetti, “A nonparametric scoring algorithm for iden-tifying informative genes from microarray data,” Pacific Symposium on
Biocomput-ing, Vol. 6, 2001, pp. 52-63.
11. C. C. Chang and C. J. Lin, “LIBSVM: a library for support vector machines, 2001” Software available at http://www.csie.ntu.edu.tw/~cjlin/libsvm
12. D. A. Notterman, U. Alon, A. J. Sierk, and A. J. Levine, “Transcriptional gene ex-pression profiles of colorectal adenoma, adenocarcinoma, and normal tissue exam-ined by oligonucleotide arrays,” Cancer Research, Vol. 61, 2001, pp. 3124-3130. 13. C. Cartes and V. Vapnik, “Support vector machines,” Machine Learning, Vol. 20,
1995, pp. 273-297.
14. V. Vapnik, Statistical Learning Theory, John Wiley & Sons, New York, 1999. 15. C. J. C. Burges, “A tutorial on support vector machined for pattern recognition,”
Data Mining and Knowledge Discovery, Vol. 2, 1998, pp. 121-167.
Han-Yu Chuang (莊涵宇) received the B.S. degree and the M.S. degree from the Department of Computer Science and Information Engineering at National Taiwan Uni-versity, Taipei, Taiwan in 2001 and 2003, respectively. Her current research interests include feature selection, microarray data analysis, evolutionary computation, data min-ing and bioinformatics.
Huai-Kuang Tsai (蔡懷寬) received the B.S. degree, the M.S. degree, and the Ph.D. degree, from the Department of Computer Science and Information Engineering at Na-tional Taiwan University, Taipei, Taiwan in 1996, 1998, and 2003, respectively. His re-search interests include evolutionary computation, bioinformatics, combinatorial optimi-zation, and data mining.
Yuan-Fan Tsai (蔡元芳) received the B.S. degree, the M.S. degree, and the Ph.D. degree, from the Department of Hydraulics & Ocean Engineering, National Cheng Kung University in 1992, 1994, and 1999, respectively. He has been an Assistant Professor of Department of Information Management, Chung Yu Junior College of Business Admini-stration in Taiwan since 2002. He majors in hydraulics engineering, numerical simulation, bioinformatics, and evolutionary computation. He has published more than 30 technical papers in various journals and conference records.
Cheng-Yan Kao (高成炎) was born in Taipei, Taiwan, in 1948. He received the B.S. degree in mathematics from National Taiwan University, Taipei, Taiwan, in 1971 and the M.S. degree in computer science, the M.S. degree in statistics, and the Ph.D. de-gree in computer science, all from the University of Wisconsin-Madison, in 1976, 1978, and 1981, respectively.
He worked for Ford Aerospace and the Unisys Corporation and for General Electric from 1980 to 1989 at the Johns on Space Center, NASA, Houston, TX. He has been a Professor with the Department of Computer Science and Information Engineering,
Na-tional Taiwan University, since 1990. He has published more than 40 technical papers in various journals and conference records. His research interests include evolutionary computation, bioinformatics, optimization, and artificial intelligence.