Photodissociation at 248 nm shows that there is only one dissociation channel, i.e., C6H5NO f C6H5+ NO, regardless of the fact that the other channel, C6H5NO f C6H4+ HNO, is energetically accessible in agreement with theoretically predicted results. Photodissociation at 193 nm also shows the same dissociation channel. However, about 10% of the C6H5radicals produced at this wavelength further decomposed into benzyne and H atom, and the dissociation rates of phenyl radical as a function of internal energies were measured. The averaged photofragment translational energies released from the dissociation of nitrosobenzene at 193 and 248 nm are 10.2 and 6.9 kcal/mol, respectively, and fragment distributions are almost isotropic at both wavelengths. In addition, the thermal rate constant for dissociation of C6H5NO has been computed and compared with experimental data; the agreement between theory and experiment is excellent, confirming the most recently reported unusually high A-factor (>1017s-1).
I. Introduction
Nitrosobenzene has been popularly employed photolytically as the precursor of phenyl radicals in many kinetic and spectroscopic studies because of its large extinction coefficient in the UV region.1-8 The molecule has a large energy gap between the S1 and S2 states.9,10 Hence, the possibility of fluorescence from the S2state has been discussed.11However, no fluorescence has been observed.12-14The existence of a fast decay channel in the S2state is therefore expected. Indeed, it was found that the dissociation of nitrosobenzene in argon matrices at 12 K is very efficient upon irradiation of UV photons.15
The dynamics of photodissociation of nitrosobenzene in the gas phase have been studied recently.16-22However, conclusions are very different from these studies. Dick and co-workers17 measured the absorption spectrum of the S0- S2transition of the ultracold nitrosobenzene in a supersonic jet. A lifetime of the S2state determined directly by the homogeneous line width of the absorption spectrum was found to be 60 ( 3 fs. They also measured the alignment, velocity distribution, and popula-tions of the rotational and vibrational states of the NO fragments via laser-induced fluorescence and ion imaging technique at various UV wavelengths.18-20 Fragments have an isotropic velocity distribution and no alignment was observed. In addition, the NO rotational population has a statistical distribution and only 10% of the NO fragments are produced in vibrational
excited states. They concluded that the primarily populated Sn state (n g 2) decays rapidly through internal conversion to the S1or S0state, and the dissociation occurs through a statistical mechanism on the potential surface of the lower state on a time scale much slower than rotation of the parent molecule. On the other hand, Han and co-workers21,22 also have studied the photodissociation of nitrosobenzene at 266 nm recently. The anisotropy parameterβ ) -0.64 was found from the time-of-flight spectra of NO and C6H5 photofragments. Their laser-induced fluorescence study also demonstrated that more than 60% of the NO fragments are populated in the vibrational excited state and the NO fragment rotational temperature is much higher than that measured by Dick et al.
In all existing studies, including those kinetic and spectro-scopic papers cited above, only one dissociation channel, C6H5 -NO f C6H5+ NO, has been assumed and/or detected in the photodissociation of nitrosobenzene in the UV region, despite the fact that the C6H4+ HNO product channel is accessible at 248 nm while the C6H4+ H + NO product channel becomes energetically accessible at 193 nm.
In this report, photodissociation of nitrosobenzene at 193 and 248 nm was studied by multimass ion imaging techniques. Particular attention has been focused on the search for the other possible dissociation channel and the fragment anisotropy measurement. In addition, the decomposition of the phenyl radical produced from the photodissociation reaction and the thermal decomposition of nitrosobenzene were also studied; the data will be discussed in reference to the ab initio MO and statistical theory results.
II. Experimental Section
Experimental Setup. The experimental techniques have been described in detail in our previous reports on other aromatic molecules,23-26 and only a brief description is given here.
†Part of the special issue “Richard Bersohn Memorial Issue”. * To whom correspondence may be addressed. E-mail: ckni@ po.iams.sinica.edu.tw (C.-K.N.); [email protected] (M.C.L.).
‡Academia Sinica. §Emory University.
|Present address: Department of Applied Chemistry, National Chiayi University, Chiayi, Taiwan.
⊥National Taiwan University. ∇National Chiao Tung University.
10.1021/jp049425o CCC: $27.50 © 2004 American Chemical Society Published on Web 04/29/2004
Nitrosobenzene vapor was formed by flowing ultrapure He at pressures of 500 Torr through a reservoir filled with sample at 293 K. The nitrosobenzene/He mixture was then expanded through a 500µm pulsed nozzle to form the molecular beam. Molecules in the molecular beam were photodissociated by an UV laser pulse. Due to the recoil velocity and center-of-mass velocity, the fragments were expanded to a larger sphere on their flight to the ionization region and then ionized by a VUV laser pulse. The distance and time delay between the VUV laser pulse and the UV photolysis laser pulse were set such that the VUV laser beam passed through the center-of-mass of the dissociation products and generated a line segment of photo-fragment ions by photoionization. The length of the segment was proportional to the fragment recoil velocity in the center-of-mass frame multiplied by the delay time between the photolysis and the ionization laser pulses. To separate the different masses within the ion segment, a pulsed electric field was used to extract the ions into a mass spectrometer after ionization. While the mass analysis was being executed in the mass spectrometer, the length of each fragment ion segment continued to expand in the original direction according to its recoil velocity. At the exit port of the mass spectrometer, a two-dimensional ion detector was used to detect the ion positions and intensity distribution. In this two-dimensional detector, one direction was the recoil velocity axis and the other was the mass axis. The schematic diagram of the experimental setup is shown in Figure 1.
Computational Method. The hybrid density functional B3LYP27-29 with three split valence basis sets, 6-31G(d), 6-31+G(d), and 6-31G(2df,p), has been applied to optimize the geometries of the reactant, intermediate, transition state, and products with tight convergence criteria. All the stationary points were identified by the number of imaginary frequencies (NIMG) with NIMG ) 0 for stable species and NIMG ) 1 for transition states, as well as by the normal-mode analysis. To continue to study the unimolecular reaction of C6H5NO based on our earlier work30at the G2M(rcc, MP2) and G2M(RCC, MP2) levels,31 in this report we also performed quantum-chemical calculations with the G2M(RCC, MP2) scheme. A series of single-point energy calculations for the G2M(RCC, MP2) composite scheme using the geometries and zero-point energy (ZPE) corrections from the B3LYP/6-31G(d) and B3LYP/6-31+G(d) levels of
theory have been carried out to obtain more reliable information on energetics for the potential energy surface (PES) and the rate constant prediction by
The empirical ∆HLC is given by -5.3nβ - 0.19nR in
milli-hartrees, where nRand nβare the numbers of R andβ valence electrons, respectively. Some of the energies have also been calculated by the G3SX composite method32with the geometries optimized at the B3LYP/6-31G(2df,p) level. Since the method does not include any empirical correction, this method has been proposed to apply for the system whose number of spins is changed like the present system. Therefore, we can compare the two composite schemes for the issue on the spin change. In addition, time-dependent density functional theory (TD-DFT)33-35 at the B3LYP/6-31+G(d) level has been used to calculate the vertical excitation energies and oscillator strengths for the S1and S2states of C6H5NO. The electronic structure calculations were carried out with the Gaussian 9836 and MOLPRO 9837programs.
III. Results and Discussion
Dissociation of Nitrosobenzene at 248 nm. Ions of m/e ) 30, 77, and 78 were the only fragments we observed from the photodissociation of nitrosobenzene at this wavelength. m/e ) 78 is the corresponding 13C isotope of fragment m/e ) 77. Photofragment ion images are shown in Figure 2a,b. Photolysis laser intensity in the region between 2.5 and 30 mJ/cm2was used. They showed the same shapes of image. It suggests that one-photon absorption is the dominant process in this laser intensity region. Since there was no HNO and C6H4detected, we can conclude that there is only one dissociation channel at 248 nm, i.e., C6H5NO f C6H5 + NO, although the other channel, C6H5NO f C6H4 + HNO, is also energetically accessible (vide infra). As a result, nitrosobenzene is a “clean” precursor to generate phenyl radical at this wavelength.
The photofragment translational energy distribution obtained from the images is illustrated in Figure 2c. It shows that the probability monotonically decreases with increasing translational energy. The average released translational energy is about 6.9 kcal/mol, and it is about 11% of the total available energy.
Figure 1. Schematic diagram of the multimass ion imaging detection
system: (1) nozzle; (2) molecular beam; (3) photolysis laser beam; (4) VUV laser beam, which is perpendicular to the plane of the paper; (5) ion extraction plates; (6) energy analyzer; (7-9) simulation ion trajectories of m/e ) 16, 14, and 12; (10) two-dimensional detector, where the y-axis is the mass axis, and the x-axis (perpendicular to the plane of the paper) is the velocity axis.
Figure 2. Photofragment ion image of (a) m/e ) 30, (b) m/e ) 77
and 78, and (c) photofragment translational energy distribution at 248 nm. Arrow indicates the maximum available energy.
E0[G2M] ) RCCSD(T)/6-311G(d,p) +
MP2/6-311+G(3df,2p) - MP2/6-311G(d,p) + ∆HLC + ZPE
Compared to the average translational energy measured in previous studies, our value is much smaller than 29% of the fragment translational spectroscopy measurement at photolysis wavelength 266 nm,22and it is very close to 7.3% and 6∼11% of velocity map ion imaging measurements at 290.5 and 225.96 nm, respectively.20
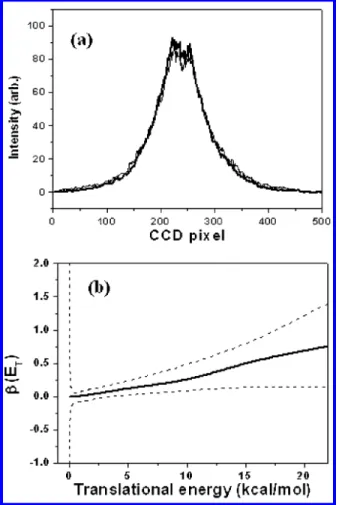
The C6H5photofragment ion image profiles at two different photolysis laser polarizations are presented in Figure 3a. The shapes and the intensities of the profiles at the polarization directions parallel and perpendicular to the VUV probe laser beam are very close to each other. The anisotropy parameterβ for the fragments with different translational energy is illustrated in Figure 3b. In the low translational energy region where most of the fragments are produced, the values ofβ are very close to zero, indicating the isotropic distribution of the fragments. In the high translational energy region, the values ofβ fluctuate between 0 and 1. The poor S/N ratios are due to the small amount of high translational energy fragments produced in the high translational energy region. We can conclude that most of the fragments are isotropically distributed. If there is any anisotropic distribution, it must be from the fragments with large translational energy. However, the amount of those fragments is very small, and the value ofβ is positive.
The anisotropy parameterβ we measured at 248 nm is very close to the value of 0.05 from the single line measurement at 225.96 nm.20It is also very close to the value of 0.03∼-0.05 from the measurement of several rotational states of NO V ) 0 at photolysis wavelength 290.5 nm.20 However, it is very
different from the value of -0.64 obtained from the photo-fragment translational energy measurement at 266 nm.22Both the translational energy distribution and anisotropy parameter β measurement suggest that our results are similar to those of Dick and co-workers, but they are different from those of Han and co-workers.
Dissociation of Nitrosobenzene at 193 nm. Fragment ions of m/e ) 30, 76, 77, and 78 were observed from the photodissociation of C6H5NO at 193 nm. Photolysis laser intensity in the region between 0.2 and 1.7 mJ/cm2were used, and all of these fragment intensities showed linear dependence on the laser intensity. The images are shown in Figure 4. As the delay time between pump and probe laser pulses increased, the relative intensity between m/e ) 76 and 77 also changed, as shown in Figure 5. Since no HNO fragment was detected, fragments of m/e ) 76 must result from the slow dissociation of the energetic fragments m/e ) 77. Consequently, we can conclude that there is still only one dissociation channel of nitrosobenzene at 193 nm, even though the photon energy is much higher than the dissociation barrier of C6H5NO f C6H4 + HNO. This observation is consistent with the significantly smaller decay rate predicted for this product channel, as will be presented later. The photofragment translational energy distribution obtained at this wavelength is shown in Figure 4c. The average energy released is 10.2 kcal/mol, which is slightly larger than that at 248 nm.
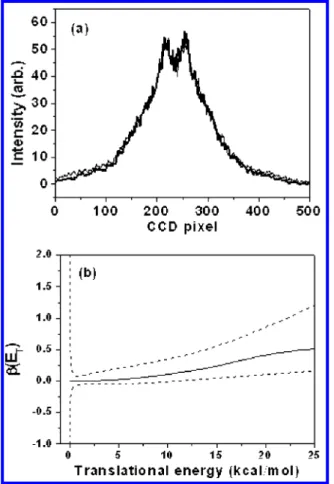
The anisotropy parameterβ at 193 nm was found to be very similar to that at 248 nm. The C6H5photofragment ion image intensity profiles at two different photolysis laser polarizations were found to be very close to each other, as presented in Figure 6a. The values ofβ as a function of translational energy are shown in Figure 6b. It suggests that most of the fragments are isotropically distributed, and only a small amount of fragments with large translational energy have a positive value ofβ. The dissociation mechanism at 193 nm must be similar to that at 248 nm.
Decomposition of Phenyl Radical. The phenyl radical plays a very important role in the combustion of small aromatic hydrocarbons.38-40There has been considerable interest in its reactions with combustion species as well as its decomposition kinetics and mechanism. The ab initio calculation of a previous study41 showed that the decomposition of phenyl radical
Figure 3. (a) Photofragment ion image intensity profiles of m/e ) 77
from two different photolysis laser polarizations at 248 nm. Thick and thin lines represent the polarization of UV laser perpendicular and parallel to the VUV laser beam, respectively. (b) Anisotropy parameter β as a function of fragment translational energy. The dotted lines represent the upper and lower limits of the uncertainty.
Figure 4. Photofragment ion image of (a) m/e ) 30, (b) m/e ) 76,
77, and 78, and (c) photofragment translational energy distribution at 193 nm. Arrow indicates the maximum available energy.
producing benzyne + H was endothermic by 76.0 kcal/mol, and the reaction was reported to occur without a distinct transition state based on geometry optimization with the B3LYP method. This loose structure, also confirmed by MP2 and CCSD optimizations with the 6-31+G(d,p) basis set, however, over-estimated the high-temperature thermal decomposition rate
constant determined by Braun-Unkoff et al.,42as was also shown by Wang et al.43The new optimization carried out in this work by the G96LYP/6-31+G(d,p) method located a low-energy transition state. A G2M calculation based on this structure gives the barrier for the decomposition reaction at 79.4 kcal/mol above C6H5. For phenyl radicals produced from the photodissociation of nitrosobenzene at 193 nm, the maximum internal energy for phenyl radical is 93.8 kcal/mol (experimental value from NIST chemistry webbook). The decomposition into benzyne + H therefore is energetically allowed, as shown in Figure 7.
The decomposition of phenyl radical into benzyne and H atom can be clearly seen from the image intensity changes of m/e ) 77 and 76 at various delay times, as shown in Figure 5. The central part of the fragment images in the velocity axis corresponds to small translational energy released, i.e., most of the available energy is distributed in the fragments’ internal degrees of freedom. For the phenyl radicals located at the central part of the image, they contain a lot of internal energy and quickly decompose into benzyne and H atom. Since the mass ratio between benzyne and H atom is large and the available energy for the decomposition process is small, benzyne produced from this part of phenyl radicals is still located at the same position in the velocity axis. The fast decomposition of this part
Figure 5. Fragment ion image intensity profiles at various delay times. The thin and thick lines represent m/e ) 77 and 76, respectively. (a) t )
5µs, (b) t ) 9 µs, (c) t ) 15 µs, (d) t ) 18 µs.
Figure 6. (a) Photofragment ion image intensity profiles of m/e ) 77
from two different photolysis laser polarizations at 193 nm. Thick and thin lines represent the polarization of UV laser perpendicular and parallel to the VUV laser beam, respectively.(b) Anisotropy parameter β as a function of fragment translational energy. The dotted lines represent the upper and lower limits of the uncertainty.
Figure 7. Energy level scheme from the TD-DFT calculations at the
B3LYP/6-31+G(d) level and schematic energy diagram for the isomerization and dissociation reactions of C6H5NO calculated at the G2M(RCC, MP2)//B3LYP/6-31+G(d) level in kilocalories per mole. Note that the energy of the1A′′ state, 35.3 kcal/mol, includes ZPE correction. The energy levels in parentheses are from ref 18.
axis at various delay times. The internal energy of phenyl radical can be calculated from
The photon energy hν is 148 kcal/mol, the dissociation energy D0 is 54 kcal/mol,30 and the amount of translational energy released, E(tran), can be calculated directly by use of the fragment velocity obtained from the image. The only uncertainty in this equation is the internal energy of fragment NO. However, a proper estimation of the NO fragment internal energy could be made according to the previous studies and our measurement. Previous studies showed that the rotational and vibrational state distributions of NO fragments are statistical, and most of the energy is located in phenyl radical vibrational degrees of freedom. For example, the average vibrational energy of NO fragment is only 1.3% of the total available energy at photolysis laser wavelength 255 nm, and the rotational energies of both phenyl radical and NO are only 0.2% and 3.7%, respectively due to the transition-state geometry. For nitrosobenzene pho-todissociation at 193 nm, both the value of anisotropy parameter β and the translational energy distribution suggest that the dissociation mechanism is similar to that at 255 nm, i.e., the dissociation occurs after internal conversion to the lower electronic state. Energy must be redistributed among various vibrational degrees of freedom before dissociation occurs and the energy distribution is statistical. Therefore, we estimated that about 95% of the available energy (total available energy after the subtraction of translational energy) is distributed in phenyl radical vibrational degrees of freedom.
For a given internal energy, the decomposition of phenyl radical into benzyne and H atom can be described by m77(T1) ) exp(-kT1) and the growth of the corresponding benzyne can be described by m76(T1) ) 1 - exp(-kT1). m77(T) is the phenyl radical concentration for a given internal energy at delay time T. m76(T) is the benzyne concentration produced from the corresponding phenyl radical. k is the dissociation rate of phenyl radical. The ion intensity of m/e ) 77 and 76 thus can be described by
A and B are the ionization cross sections of fragment mass 77 and 76, respectively. γ is the branching ratio of benzyne produced from the dissociative ionization of phenyl radical, described by
The dissociation rate can be calculated from the ion intensity ratios of fragment m/e ) 77 and 76 at two different delay times by use of
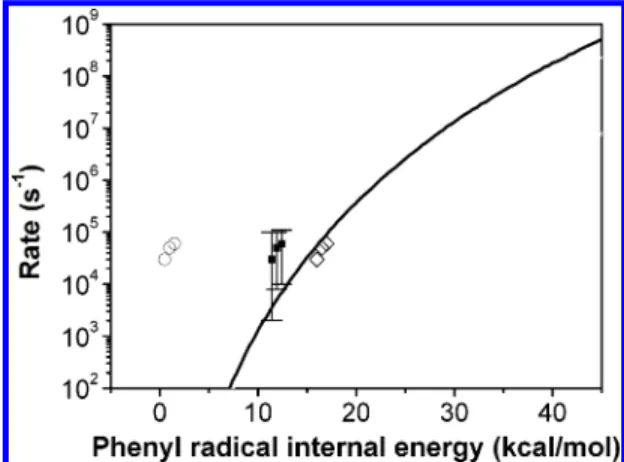
At short delay time when no benzyne is produced from the decomposition of phenyl radical, ion intensity ratio between I76 and I77is close to the value ofγ/(1 - γ). The upper limit of γ/(1 - γ) was obtained from the image at the available shortest delay time (5µs), and the final result of the decomposition rate k was calculated from the numerical solution of eq 4. The phenyl radical dissociation rates as a function of internal energy obtained from this equation are shown in Figure 8. It shows that if the translational energy released in the photodissociation of nitrosobenzene is less than 1 kcal/mol, the decomposition rate of corresponding phenyl radical is in the region between 105and 104s-1. However, if the translational energy release is more than 2 kcal/mol, the decomposition rate is too slow (<104 s-1) to be measured in our apparatus. The comparison of absolute ion image intensities of m/e ) 77 between short and long delay times indicates that about 10% of phenyl radicals decompose into benzyne and H atom within the time scale (<25 µs) of our experiment. Compared to the decomposition rate obtained from G2M(RCC, MP2)//G96LYP/6-31+G(d) ab initio MO and statistical-theory calculations, the agreement between theory and experiment is satisfactory.
Theoretical Prediction of C6H5NO Decomposition Rates:
(1) PES of the System. As described in the preceding section, the potential energy surface of the C6H5NO system has been calculated with the G2M method31 based on the geometry optimized at the B3LYP/6-31+G(d,p) level of theory. The optimized structures of the reactant, transition state, and intermediate are presented in Figure 9. All the geometries of the C6H5NO (S0, X1A′), C6H5NO (T1,3A′′), and C6H5NO (S1, 1A′′) are planar with C
Ssymmetry. The equilibrium C-N bond E(int)phenyl) hν - D0- E(tran) - E(int)NO
I77(T1) ) A(1 -γ) exp(-kT1) (1)
I76(T1) ) B[1 - exp(- kT1)] + Aγ exp(-kT1) (2)
C6H5+ hνVUVf C6H4
++ H(3)
(3)
Figure 8. Phenyl radical dissociation rate as a function of internal
energy. Shown are the experimental values assuming (O) 18%, (9) 5%, and (]) 0% of the available energy (93 kcal/mol) distributed in NO internal degrees of freedom. The solid line is the prediction at the G2M(RCC, MP2)//G96LYP/6-31+G(d) level in this work.
Im76(T1) Im77(T1) Im76(T2) Im77(T2) ) B(1 - e-kT1) + Aγe-kT1 A(1 -γ)e-kT1 B(1 - e-kT2) + Aγe-kT2 A(1 -γ)e-kT2 ) B A(1 -γ)(e kT1- 1) + γ 1 -γ B A(1 -γ)(e kT2- 1) + γ 1 -γ (4)
lengths of T1and S1states are shorter than that of the S0state as shown in Figure 9. The predicted energetics and potential energy diagram for the formation of products accessible to 193 nm photon energy are presented in Table 1 and Figure 7, respectively. At the G2M level, the four-centered transition state leading to C6H4+ HNO was predicted to locate at 67 kcal/mol above C6H5NO, about 19 kcal/mol below the dissociated products. This suggests that a stable molecular complex must exist between C6H5NO and C6H4 + HNO. A detailed IRC calculation indeed confirms the presence of a benzyne-HNO complex, C6H4N(H)O, lying 60 kcal/mol above C6H5NO (see Figure 9 for its structure). Further decomposition of the C6H4 N-(H)O complex was found to take place without a well-defined intrinsic barrier, similar to the fragmentation of C6H5NO to C6H5 and NO.
As shown in Table 1, the energetics predicted by both G2M and G3SX agree very closely. The latter, which does not include “high-level corrections”, is believed to be more reliable for applications to reactions with spin changes. In Table 2, the result of our TD-DFT calculations at the B3LYP/6-31+G(d) level for the S1 and S2states confirms the energy gap between them, 54.5 kcal/mol, which compares closely with the experimental value, 56.4 kcal/mol.18
(2) Decomposition of Photoexcited C6H5NO. Assuming that the internal conversion is fast comparing with fragmentation lifetimes, we can predict the fragmentation rates of C6H5NO following the excitation at 248 and 193 nm on the basis of the RRKM theory. As both product channels giving NO and HNO occur barrierlessly, the energy-dependent specific constants (kE) were evaluated with the flexible transition state approach44-47
by use of the Variflex code.48The minimum energy paths (MEP) representing the dissociation processes were approximated with the Varshni potential,49V(r) ) De{-a exp[-b(R2- R02)]} -De, where R is the reaction coordinate, R0is the equilibrium value of R, a ) R0/R, and Deis the bond energy excluding the zero-point energy correction. Along the reaction coordinate, we stretched the bond length of C-N with a step size of 0.2 Å along the path from the equilibrium value to 5 Å. Each geometry was fully optimized at the B3LYP/6-31+G(d) level of theory and its energy was then scaled by the G2M(RCC, MP2) value for the Varshni potential. The approximated bond energy and b for the ground state with 1A′ are 60.4 kcal/mol and 0.522 Å-2, respectively, for R0) 1.439Å. Similar calculations for the dissociation of C6H4N(H)O, C6H5NO (T1,3A′′) and C6H5NO (S1,1A′′) gave rise to De) 30.3, 36.0, and 20.0 kcal/mol; b ) 0.863, 0.834, and 0.991 Å-2; and R0) 1.365, 1.381, and 1.371 Å, respectively.
By use of the molecular parameters given above, the specific rate constants for the dissociation of C6H5NO at 248 and 193 nm (approximately 115 and 148 kcal/mol, respectively) provide the lifetimes of the excited molecule along various pathways as summarized in Table 3.
The lifetimes of C6H5NO are predicted to be about 40 ps following the excitation at 248 nm and 33 ps for excitation at 193 nm, producing exclusively C6H5+ NO as was observed experimentally. The formation of HNO, slower by 105at 248 nm and 103at 193 nm, is experimentally undetectable. As the formation of HNO occurs via both the tight four-centered TS1 and the variational TS near the dissociation threshold, with the latter being slightly slower due to its higher energy (see Table 3), we have examined the effect of multiple reflections between the two TSs; the effect was found to be negligible because of the high photon energies. The predicted lifetimes are much longer than that derived from the line width measurement, suggesting that internal conversion is considerably faster than the fragmentation process.
(3) Thermal Decomposition Rate Constant. The high-pressure, first-order rate constant for the decomposition of C6H5NO producing C6H5 + NO, k∞ ) (1.42 ( 0.13) × 1017 exp[-(55 060 ( 1080)/RT] s-1,30is seen to have an unusually large A-factor. The extrapolated rate constants in the temperature range of 800-1000 K from the equation lie between the result of Horn et al.50 (after high-pressure-limit correction by the RRKM theory) and that of Choo et al.51determined by the very-low-pressure pyrolysis method. Theoretically, the rate constant can be computed with the Varshni potential evaluated for the
TABLE 1: Relative Energiesafor the Isomerization and Decomposition Reactions of C6H5NO
species or reaction B3LYP/6-31G(d) G2Mb B3LYP/6-31+G(d) G2Mc B3LYP/6-31G(2df,p) G3SXd
C6H5NO 0.0 0.0 0.0 0.0 0.0 0.0 C6H5+ NO 53.3 56.5 52.2 56.6 53.0 55.6 TS 66.1 66.7 65.6 66.6 63.3 66.0 C6H4N(H)O 60.5 60.2 57.8 60.3 58.4 59.6 C6H4+ HNO 96.2 86.2 93.2 86.2 94.8 86.3 C6H4+ H + NO 140.4 134.0 138.4 134.0 140.2 134.1
aRelative energies are ZPE-corrected in kilocalories per mole.b-dBased on the optimized geometries calculated at B3LYP/6-31G(d), B3LYP/ 6-31+G(d), and B3LYP/6-31G(2df,p), respectively.
Figure 9. Optimized structures of the reactant, transition state, and
intermediate at the B3LYP/6-31+G(d) level of theory.
TABLE 2: Vertical Energies and Oscillator Strengths (f) for C6H5NO, Estimated by TD-DFT at the B3LYP/6-31+(d) Levela
state sym B3LYP/6-31+G(d) experimentalb
S1 1A 35.9 (0.0003) 32.9
S2 1A 90.4 (0.0183) 89.3
aVertical energies are given in kilocalories per mole; oscillator
strengths are shown in parentheses.bFrom ref 18.
TABLE 3: Decay Rate of C6H5NO via Different Pathways
pathway 248 nm 193 nm
C6H5NO f C6H5+ NO 2.5× 10¹⁰ 3.2× 10¹⁰ C6H5NO f C6H4+ HNOa 1.0× 10⁴ 1.3× 10⁷ C6H5NO f C6H4N(H)O 2.9× 10⁵ 1.8× 10⁷
aThe rate constant for C
6H5NO f VTS f C6H4+ HNO with VTS as the limiting step.
three MEPs producing NO. The thermal unimolecular dissocia-tion rate constant defined by
where [C6H5NO]0, [X], [A], and [B] are, respectively, the initial concentration of nitrosobenzene entirely at its ground electronic state and those at the ground electronic, 3A′′, and1A′′states under thermal equilibrium, and the ki∞are the first-order rate constants for the dissociation from these states. Assuming KA and KBto be the equilibrium constants for X T A and X T B, respectively, eq 5 leads to the total unimolecular rate constant:
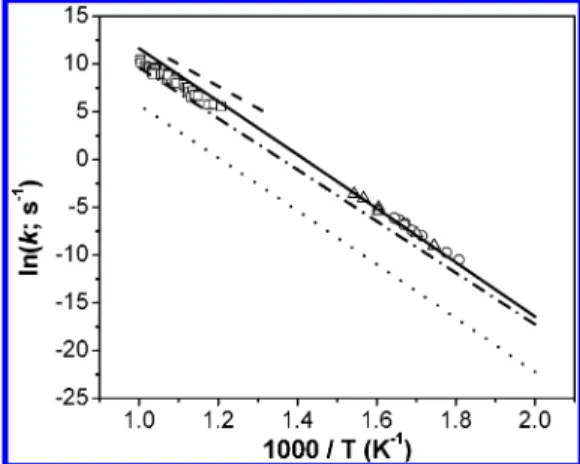
The predicted individual rate constants presented in Figure 10 gave k∞ ) 1.52 × 10¹⁷ exp[-55 200/RT] s-1, which is in excellent agreement with the result obtained by Park et al.,30 k∞ ) (1.42 ( 0.13) × 1017exp[-(55 060 ( 1080)/RT] s-1, confirming the unusually high A-factor. Notably, the result presented in Figure 10 indicates that the contributions from both T1and S1states are insignificant in the present system. For the decomposition of SO2at high temperatures in shock waves, we have recently shown that contributions from three excited states to its second-order rate constants are significant.52
IV. Conclusions
We demonstrate that there is only one dissociation channel of nitrosobenzene at both 248 and 193 nm. No products corresponding to the dissociation channel of C6H5NO f C6H4 + HNO were observed, in full agreement with theoretical prediction. The dissociation rate of nitrosobenzene is on a time scale much longer than the rotation of molecule, and the fragment distribution is almost isotropic. The results at 248 nm are close to the measurement of Dick and co-workers. In addition, about 10% of phenyl radical produced at 193 nm further decompose into benzyne and H atom, and the dissocia-tion rates of phenyl radical as a funcdissocia-tion of internal energies were measured. The results for the dissociation of the excited C6H5NO and the C6H5 radical agree well with theoretically predicted values. In addition, the rate constant for the thermal decomposition of nitrosobenzene has been calculated with variational RRKM theory by including the small contributions
support from the National Science Council for a Distinguished Visiting Professorship at National Chiao Tung University in Hsichu, Taiwan.
References and Notes
(1) Yu, T.; Lin, M. C. J. Am. Chem. Soc. 1993, 115, 4371. (2) Lin, M. C.; Yu, T. Int. J. Chem. Kinet. 1993, 25, 875. (3) Yu, T.; Lin, M. C. J. Phys. Chem. 1994, 98, 2105. (4) Yu, T.; Lin, M. C. Int. J. Chem. Kinet. 1994, 26, 771.
(5) Yu, T.; Lin, M. C.; Melius, C. F. Int. J. Chem. Kinet. 1994, 26, 1095.
(6) Yu, T.; Lin, M. C. J. Am. Chem. Soc. 1994, 116, 9571. (7) Yu, T.; Lin, M. C. J. Phys. Chem. 1995, 99, 8599.
(8) Tonokura, K.; Norikane, Y.; Koshi, M.; Nakano, Y.; Nakamichi, S.; Goto, M.; Hashimoto, S.; Kawasaki, M.; Andersen Sulbaek, M. P.; Hurley, M. D.; Wallington, T. J. J. Phys. Chem. A 2002, 106, 5908.
(9) McCoustra, M. R. S.; Pfab, J. Chem. Phys. Lett. 1985, 122, 395. (10) Engert, J. M.; Slenczka, A.; Kensy, U.; Dick, B. J. Phys. Chem. 1996, 100, 11883.
(11) Bhujle, V.; Wild, U. P.; Baumann, H.; Wagniere, G. Tetrahedron 1976, 32, 467.
(12) Bhujle, V. V. Spectrosc. Lett. 1997, 10, 587.
(13) Chernoff, D. A.; Hochstrasser, R. M. Chem. Phys. Lett. 1980, 70, 213.
(14) Condirston, D. A.; Knight, A. R.; Steer, R. P. J. Photochem. 1980,
14, 257.
(15) Hatton, W. G.; Hacker, N. P.; Kasai, P. H. J. Chem. Soc., Chem.
Commun. 1990, 227.
(16) Niles, S.; Wight, C. A. Chem. Phys. Lett. 1989, 154, 458. (17) Kessler, A.; Kensy, U.; Dick, B. Chem. Phys. Lett. 1998, 289, 516. (18) Kessler, A.; Slenczka, A.; Seiler, R.; Dick, B. Phys. Chem. Chem.
Phys. 2001, 3, 2819.
(19) Seiler, R.; Dick, B. Chem. Phys. 2003, 288, 43.
(20) Obernhuber, T. J.; Kensy, U.; Dick, B. Phys. Chem. Chem. Phys. 2003, 5, 2799.
(21) Li, Y. M.; Sun, J. L.; Han, K. L.; He, G. Z. Chem. Phys. Lett. 2001, 338, 297.
(22) Huang, J. H.; Wang, G. J.; Gu, X. B.; Han, K. L.; He, G. H. J.
Phys. Chem. A 2000, 104, 10079.
(23) Tsai, S. T.; Lin, C. K.; Lee, Y. T.; Ni, C. K. ReV. Sci. Instrum. 2001, 72, 1963.
(24) Tsai, S. T.; Lee, Y. T.; Ni, C. K. J. Phys. Chem. A. 2000, 104, 10125.
(25) Tsai, S. T.; Lin, C. K.; Lee, Y. T.; Ni, C. K. J. Chem. Phys. 2000,
113, 67.
(26) Tsai, S. T.; Huang, C. L.; Lee, Y. T.; Ni, C. K. J. Chem. Phys. 2001, 115, 2449.
(27) Becke, A. D. J. Chem. Phys. 1992, 96, 2155. (28) Becke, A. D. J. Chem. Phys. 1992, 97, 9173. (29) Becke, A. D. J. Chem. Phys. 1993, 98, 5648.
(30) Park, J.; Dyakov, I. V.; Mebel, A. M.; Lin, M. C. J. Phys. Chem. 1997, 101, 6043.
(31) Mebel, A. M.; Morokuma, K.; Lin, M. C. J. Chem. Phys. 1995,
103, 7414.
(32) Curtiss, L. A.; Redfern, P. C.; Raghavachari, K.; Pople, J. A. J.
Chem. Phys. 2001, 114, 108.
(33) Bauernschmitt, R.; Ahlrichs, R. Chem. Phys. Lett. 1996, 256, 454. (34) Stratmann, R. E.; Scuseria, G. E.; Frisch, M. J. J. Chem. Phys. 1998, 109, 8218.
(35) Casida, M. E.; Jamorski, C.; Casida, K. C.; Salahub, D. R. J. Chem.
Phys. 1998, 108, 4439.
Figure 10. Experimental and predicted thermal rate constants for the
dissociation of C6H5NO at the high-pressure limit: (0) from ref 50; (4) with NO added and (O) without NO added, from ref 30; (- - -) from ref 51. Also shown are predictions for the states of X (s)1A′, (- ‚ -)1A′′, and (‚‚‚)3A′′, respectively. Their sum gives k∞) 1.52 × 10¹⁷exp[-55200/RT] s-1.
d[C6H5]/dt ) k∞[C6H5NO]0) Σki∞Xi)
kX∞[X] + kA∞[A] + kB∞[B] (5)
(36) Frisch, M. J.; Trucks, G. W.; Schlegel, H. B.; Scuseria, G. E.; Robb, M. A.; Cheeseman, J. R.; Zakrzewski, V. G.; Montgomery, J. A., Jr.; Stratmann, R. E.; Burant, J. C.; Dapprich, S.; Millam, J. M.; Daniels, A. D.; Kudin, K. N.; Strain, M. C.; Farkas, O.; Tomasi, J.; Barone, V.; Cossi, M.; Cammi, R.; Mennucci, B.; Pomelli, C.; Adamo, C.; Clifford, S.; Ochterski, J.; Petersson, G. A.; Ayala, P. Y.; Cui, Q.; Morokuma, K.; Malick, D. K.; Rabuck, A. D.; Raghavachari, K.; Foresman, J. B.; Cioslowski, J.; Ortiz, J. V.; Baboul, A. G.; Stefanov, B. B.; Liu, G.; Liashenko, A.; Piskorz, P.; Komaromi, I.; Gomperts, R.; Martin, R. L.; Fox, D. J.; Keith, T.; Al-Laham, M. A.; Peng, C. Y.; Nanayakkara, A.; Gonzalez, C.; Challacombe, M.; Gill, P. M. W.; Johnson, B.; Chen, W.; Wong, M. W.; Andres, J. L.; Gonzalez, C.; Head-Gordon, M.; Replogle, E. S.; Pople, J. A. Gaussian
98, Revision A.7; Gaussian, Inc.: Pittsburgh, PA, 1998.
(37) Amos, R. D.; Bernhardsson, A.; Berning, A.; Celani, P.; Cooper, D. L.; Deegan, M. J. O.; Dobbyn, A. J.; Eckert, F.; Hampel, C.; Hetzer, G.; Knowles, P. J.; Korona, T.; Lindh, R.; Lloyd, A. W.; McNicholas, S. J.; Manby, F. R.; Meyer, W.; Mura, M. E.; Nicklass, A.; Palmieri, P.; Pitzer, R.; Rauhut, G.; Schutz, M.; Schumann, U.; Stoll, H.; Stone, A. J.; Tarroni, R.; Thorsteinsson, T.; Werner, H.-J. MOLPRO, version 98.1; University of Birmingham: Birmingham, U.K., 1998.
(38) Glassman, I. Combustion, 2nd ed.; Academic Press: New York, 1986.
(39) Haynes, D. S. Fossil Fuel Combustion; Wiley-Interscience: New York, 1991.
(40) Bockhorn, H. Soot Formation in Combustion; Springer-Verlag: New York, 1993.
(41) Madden, L. K.; Moskaleva, L. V.; Kristyan, S.; Lin, M. C. J. Phys.
Chem. A. 1997, 101, 6790.
(42) Braun-Unkoff, M.; Frank, P.; Just, T. 22nd Symp. (Int.) Combust. 1988, 1053.
(43) Wang, H.; Laskin, A.; Moriaty, N. W.; Frenklach, M. Proc.
Combust. Inst. 2000, 28, 1545.
(44) (a) Wardlaw, D. M.; Marcus, R. A. Chem. Phys. Lett. 1984, 110, 230. (b) Wardlaw, D. M.; Marcus, R. A. J. Chem. Phys. 1985, 83, 3462. (45) (a) Klippenstein, S. J. Chem. Phys. Lett. 1990, 170, 71. (b) Klippenstein, S. J. J. Chem. Phys. 1991, 94, 6469.
(46) Klippenstein, S. J. J. Chem. Phys. 1992, 96, 367.
(47) Robertson, S. H.; Wagner, A. F.; Wardlaw, D. M. J. Chem. Phys. 1995, 103, 2917.
(48) Klippenstein, S. J.; Wagner, A. F.; Dunbar, R. C.; Wardlaw, D. M.; Robertson, S. H. Variflex, version 1.00, July 16, 1999.
(49) Varshni, Y. P. ReV. Mod. Phys. 1957, 29, 664.
(50) Horn, C.; Frank, P.; Tranter, R. S.; Schaugg, J.; Grotheer, H.-H.; Just, T. 26th Symp. (Int.) Combust. 1996.
(51) Choo, K.-L.; Golden, D. M.; Benson, S. W. Int. J. Chem. Kinet. 1975, 7, 713.
(52) Lu, C.-W.; Wu, Y.-J.; Lee, Y.-P.; Zhu, R. S.; Lin, M. C. J. Phys.