ORIGINAL ARTICLE
Caseload volume-outcome relation for pulmonary embolism
treatment: association between physician and hospital caseload
volume and 30-day mortality
H . - C . L I N , * and H . - C . L E E à
*School of Health Care Administration; Cancer Research Center, Taipei Medical University Hospital, Taipei; and àDepartment of Psychiatry & Sleep Center, Taipei Medical University Hospital, Taipei, Taiwan
To cite this article: Lin H-C, Lee H-C. Caseload volume-outcome relation for pulmonary embolism treatment: association between physician and hospital caseload volume and 30-day mortality. J Thromb Haemost 2008; 6: 1707–12.
Summary. Objective: This study sets out to examine the association between physician and hospital pulmonary embo-lism (PE) caseload volume and subsequent patient outcomes using 3-year nationwide population-based data in Taiwan. Method: This study used claims data from the 2002–2004 National Health Insurance Research Database. The sample of 2761 PE inpatients was divided into three physician caseload volume groups, <3 cases (low volume), 3–6 cases (medium volume) and‡7 cases (high volume), while the three hospital volume groups were <42 cases (low volume), 42–110 cases (medium volume) and‡111 cases (high volume). A conditional logistic regression model was performed to evaluate the effects of caseload volume on 30-day mortality for PE treatment. Results:Patients treated by low case volume physicians had significantly higher mortality rates than those treated by medium case volume (19.0% vs. 13.3%, P < 0.001) or high case volume physicians (19.0% vs. 8.4%, P < 0.001). How-ever, no significant relationship was observed between 30-day morality and hospital caseload volume (P = 0.697). The regression shows that the adjusted odds of 30-day mortality among patients of low case volume physicians were over twice the mortality odds among patients of high case volume physicians (OR = 2.164, P < 0.001), and odds ratios were 1.401 relative to medium case volume physiciansÕ patients (P < 0.05). Conclusion: We conclude that an inverse PE volume-outcome relationship does exist for physicians, but not for hospitals. The skill or experience of an individual physician is a more critical factor than hospital equipment, infrastructure or staffing team in determining PE patient outcomes.
Keywords: 30-day mortality, pulmonary embolism, volume-outcome.
Introduction
Pulmonary embolism (PE) is a highly lethal condition. In the US, the estimated case fatality rate remained as high as 7.7 deaths per 100 patients in 1998 [1] and accounts for 60 000 deaths annually [2], although mortality from PE has decreased significantly during the past two decades [3–6]. PE treatment usually involves anticoagulant medication (such as heparin, low-molecular-weight heparin, and warfarin), and rarely (in severe cases) thrombolysis or surgery. While anticoagulant therapy is considered the mainstay of PE treatment, the treatment prognosis from all methods combined may still depend on a providerÕs experience, prompt diagnosis and treatment and the size and location of the clot [7,8].
Numerous volume-outcome studies have been conducted on various surgical procedures or medical conditions since the first such study reported by Luft et al. in 1979 [9]. The overwhelm-ing majority of these reported that patients treated by providers with higher caseloads had superior treatment outcomes [10]. To our best knowledge, only one study by Aujesky et al. has focused on patient outcomes and the number of PE patients treated by particular hospitals, using discharge records from Pennsylvania hospitals [7]. So far no study has sought to examine the simultaneous contribution to patient outcomes of both hospital and physician caseload levels.
Therefore, this study sets out to examine the association between physician and hospital PE caseload volume and subsequent patient outcomes in Taiwan using a 3-year nationwide population-based data set.
Research methods Data base
This study used claims data from the 2002–2004 National Health Insurance Research Database (NHIRD) published in
Correspondence: Herng-Ching Lin, School of Health Care Administration, Taipei Medical University, 250 Wu-Hsing St., Taipei 110, Taiwan.
Tel.: +886 2 2736 1661 ext. 3613; fax: +886 2 2378 9788. E-mail: [email protected]
Taiwan by the National Health Research Institute. The NHIRD includes data on every inpatient admission for NHI beneficiaries, over 21 million people (96% of TaiwanÕs population). TaiwanÕs NHI provides universal coverage to all citizens, a single plan with generous benefits, low co-payments, and free choice of a widely-dispersed network of healthcare providers. Although there are no documented sensitivity and specificity studies for coding accuracy, it is generally believed that the NHIÕs checks and balances foster accurate coding. Hundreds of studies have been published based on this data set.
The NHIRD was then linked to the Ôcause of deathÕ data file with the assistance of the Department of Health (DOH) in Taiwan in order to determine 30-day mortality after PE presentation.
Study sample
Each claim record in the NHIRD provides ICD-9CM codes for one principal procedure, one principal diagnosis, and up to four secondary diagnoses. First, we selected patients hospitalized with a principal diagnosis of pulmonary embo-lism (ICD-9-CM codes 415.1, 415.11, 415.19 and 673.20– 673.24). In order to be sure to include all cases hospitalized for pulmonary embolism treatment, we also selected those with a secondary diagnosis of pulmonary embolism and one of the following principal diagnoses, in accordance with prior studies [7]: respiratory failure (518.81), cardiogenic shock (785.51), cardiac arrest (427.5), secondary pulmonary hyper-tension (416.8), syncope (780.2), thrombolysis (99.10), and intubation or mechanical ventilation (96.04, 96.05, 96.70– 96.72). As those conditions might be related to or even immediate complications of treatment procedures for pulmo-nary embolism, they may appear as the principal diagnosis in the claim record, with a secondary diagnosis of pulmonary embolism being recorded at discharge. Furthermore, we excluded readmissions in order to limit our study sample to first-time admissions. Ultimately, a total of 2761 patients were included in this study.
Classification of patients by their physicianÕs and hospitalÕs case volume
Using attending physician and hospital identifiers in the claims, we identified when the same physician or hospital admitted one or more patients for pulmonary embolism treatment during our 3-year study period. Physicians were sorted in ascending order of volume, and volume cut-off points were determined such that the sampled patients were classified into three, approximately equal-sized groups, according to standard practise [11,12]. The sample of 2761 patients was divided into three physician volume groups: <3 cases (hereafter referred to as low volume), 3–6 cases (medium volume) and‡7 cases (high volume), while the three hospital volume groups were <42 cases (low volume), 42–110 cases (medium volume) and‡111 cases (high volume).
Statistical analysis
The SAS package (Version 9.1; SAS Institute Inc., Cary, NC, USA) was used. The key independent variable of interest was physician caseload volume, while the key dependent variable was Ô30-day mortalityÕ, with ÔpatientÕ as the unit of analysis. The outcome measure was dichotomous, irrespective of whether or not pulmonary embolism treatment resulted in 30-day mortality.
We carried out a conditional (fixed-effect) logistic regression model in which observations are conditional on hospitals, in order to partition out systematic hospital-specific variation. This model essentially evaluates the effects of physician-volume on patient-outcomes within each hospital and then averages these effects across hospitals, an approach that eliminates the possibility of confounding by hospital. In addition, this conditional model also uses a clustered method for variance estimation to account for the possibility that patients of each physician have more similar outcomes than patients viewed across physicians.
We adjusted for physicianÕs gender, age, practise location (urban vs. rural), the hospitalÕs accreditation level, patient demographics (age and gender) and patient comorbidities. The hospital accreditation level variable, used as a proxy for both hospital size and clinical service capabilities, classified each hospital as a medical center (with a minimum of 500 beds), a regional hospital (minimum 250 beds) or a district hospital (minimum 20 beds). We adjusted for patientsÕ comorbidites using the Elixhauser Comorbidity Index, which was created in 1997 and has been widely used for risk adjustment in administrative data sets [13–15]. The Elixhauser method of comorbidity measurement uses 30 binary (1 = present and 0 = absent) comorbidity measures to account for inpatient morbidity and mortality. Finally, only those covariates that had significant relationships with 30-day mortality were entered into the regression model. A two-sided P value of 0.05 was used.
Results
Table 1 describes the distribution of the 30-day mortality rate and patient and physician characteristics across physi-cian pulmonary embolism case volume groups. Patients treated by low case volume physicians had significantly higher mortality rates than those treated by medium case volume (19.0% vs. 13.3%, P < 0.001) or high volume physicians (19.0% vs. 8.4%, P < 0.001). However, no significant relationship was observed between 30-day mor-tality and hospital caseload volume (P = 0.697). Of the total of 2761 first-time pulmonary embolism hospitalizations during the 3-year study period, 1271 (46.0%) were male, and 1263 (45.7%) were <65 years old. The mean age of the patients was 62.5 years, while that of the attending physi-cians was 42.5 years. Global chi-squared tests show that patients treated by physicians with high caseload volumes were more likely to be older (P < 0.001) and female
(P = 0.008). No significant relationships were found in the physician distributions in terms of age and practise location across caseload volume groups.
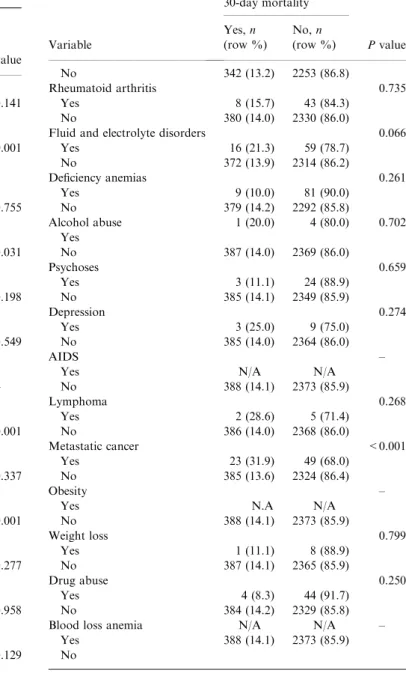
Table 2 presents the distributions of 30-day mortality after treatment for pulmonary embolism according to patient gender, age and comorbidites. Global chi-squared analyses showed that there were significant differences in 30-day mortality associated with age (P < 0.001), congestive heart failure (P = 0.031), hypertension (P < 0.001), coagulopathy (P < 0.001), renal failure (P = 0.009), solid tumors without metastasis (P < 0.001) and metastatic cancer (P < 0.001).
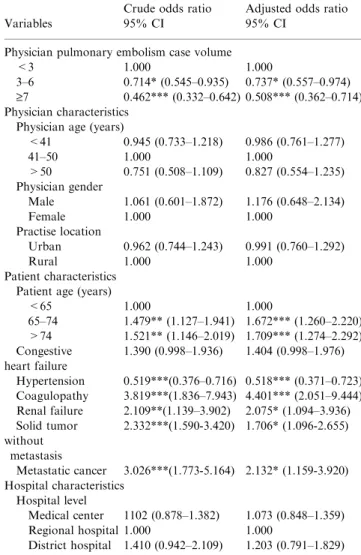
Table 3 also presents the regression results of conditional logistic regression modeling, showing that the adjusted odds of 30-day mortality among patients of low case volume physicians were over twice the mortality odds among patients of high case volume physicians, (OR = 2.164, reciprocal of 0.462, P< 0.001), and odds ratios were 1.401 relative to patients of medium case volume physicians (P < 0.05). These results support an independent effect of physicianÕs experience on mortality, regardless of the hospital in which they practise. In
addition, as expected, the odds of 30-day mortality increased with physiciansÕ age and with patientsÕ comorbidities.
Discussion
We used a 3-year nationwide population-based data set to study caseload volumes and outcomes for PE treatment. We found a significant inverse relationship between physician caseload volume and 30-day mortality, after adjusting for characteristics of physicians, patients and hospitals and the clustering effect among physicians. Patients treated by low case volume physicians have twice the 30-day mortality odds of those treated by high case volume physicians. However, hospital PE caseload volume was not a significant predictor of 30-day mortality. That is consistent with the conclusions of some prior studies which reported that physician caseload volume is a more significant factor than hospital caseload volume in predicting patient outcomes for specific treatment procedures, and that hospital volume is only marginally or not at all related to outcomes [16–19].
Table 1 30-day mortality rate and patient and physician characteristics across physician pulmonary embolism caseload volume groups (n = 2761)
Variable All
Hospital pulmonary embolism volume
Pvalue Low (<42) Medium (42–110) High (‡111)
No. (%) patients 2761 919 (33.3) 948 (34.3) 894 (32.4)
30-day mortality rate (%) 14.1 14.7 14.1 13.3 0.697 Patient characteristics Gender, n (%) 0.342 Male 1271 (46.0) 441 (48.0) 519 (54.8) 493 (55.2) Female 1490 (54.0) 478 (52.0) 429 (45.2) 401 (44.8) Age (years), n (%) 0.237 <65 1263 (45.7) 431 (46.9) 423 (44.6) 409 (45.7) 65–74 665 (24.1) 199 (21.7) 249 (26.3) 217 (24.3) >74 833 (30.2) 289 (31.5) 276 (29.1) 268 (30.0)
Physician pulmonary embolism case volume
Low (<3) Medium (3–6) High (‡6)
30-day mortality rate (%) 14.1 19.0 13.3 8.4 <0.001 Patient characteristics
No. (%) patients 2761 1066 (38.6) 875 (31.7) 820 (29.7)
Age, mean (SD), years 62.5 (18.2) 60.2 (19.3) 62.8 (18.3) 65.2 (16.2) < 0.001 No. (%) female 54.0 50.3 56.0 56.6 0.008 Age (years), n (%) < 0.001 <65 1263 (45.7) 539 (50.6) 388 (44.3) 336 (41.0) 65–74 665 (24.1) 246 (23.1) 218 (24.9) 201 (24.5) >74 833 (30.2) 281 (26.4) 269 (30.7) 283 (34.5) Physician characteristics No. (%) physicians 1229 880 (71.6) 258 (21.0) 91 (7.4)
Age, mean (SD), years 42.5 (7.1) 42.6 (7.5) 42.4 (6.2) 42.1 (6.0) 0.762
No. (%) female 5.8 7.1 2.7 2.2 0.010
Age (years), n (%) 0.053
£40 880 (71.6) 400 (45.5) 109 (42.3) 44 (48.4) 41–50 258 (21.0) 345 (39.2) 124 (48.1) 34 (37.4) ‡51 91 (7.4) 135 (15.3) 25 (9.7) 13 (14.3)
No. (%) practise location 0.117
Urban 816 (66.4) 571 (64.9) 177 (68.6) 68 (74.7) Rural 413 (41.3) 309 (35.1) 81 (31.4) 23 (25.3)
Our finding does not concur with the conclusions drawn in an earlier study by Aujesky et al. [7]. Using discharge records from Pennsylvania hospitals between 2000 and 2002, they found that the odds of 30-day mortality were marginally but significantly lower at the hospitals with higher caseload volumes than at the very low caseload volume hospitals (P = 0.049), although they did not observe any significant difference in the unadjusted odds of 30-day mortality by hospital volume (P = 0.100).
One likely reason for the departure of our findings on PE treatment outcomes is the potential confounding effect of the health insurance system in the US, which has a tendency to limit a patientÕs choice to certain providers, using a gatekeeper or referral system. Primary care physicians acting as gatekeep-ers are likely to send patients to hospitals with established
Table 2 Distributions of 30-day mortality after pulmonary embolism by patient characteristics and comorbidities (n = 12 369)
Variable 30-day mortality Pvalue Yes, n (row %) No, n (row %) Overall 308 (14.1) 2373 (85.9) Gender 0.141 Male 192 (15.1) 1079 (84.9) Female 196 (13.2) 1294 (86.8) Age (years) <0.001 <65 143 (11.3) 1120 (88.7) 65–74 107 (16.1) 558 (83.9) >74 138 (16.6) 695 (83.4) Cardiac arrhythmias 0.755 Yes 28 (14.8) 161 (85.2) No 360 (14.0) 2212 (86.0)
Congestive heart failure 0.031 Yes 59 (17.9) 270 (82.1)
No 329 (13.5) 2103 (86.5)
Valvular disease 0.198 Yes 8 (9.3) 78 (90.7)
No 380 (14.2) 2295 (85.8)
Pulmonary circulation disorders 0.549 Yes 33 (15.4) 181 (84.6)
No 355 (13.9) 2192 (86.1) Peripheral vascular disorders –
Yes N/A 10 (100.0) No 388 (14.1) 2363 (85.9) Hypertension <0.001 Yes 54 (8.9) 550 (91.1) No 334 (15.5) 1823 (84.5) Paralysis 0.337 Yes 5 (20.8) 19 (79.2) No 383 (14.0) 2354 (86.0) Coagulopathy <0.001 Yes 13 (38.2) 21 (61.7) No 375 (13.8) 2352 (86.3)
Other neurological disorders 0.277 Yes 11 (19.0) 47 (81.0)
No 377 (14.0) 2326 (86.0)
Chronic pulmonary disease 0.958 Yes 42 (14.0) 259 (86.0) No 346 (14.1) 2114 (85.9) Diabetes, uncomplicated 0.129 Yes 52 (16.9) 256 (83.1) No 336 (13.7) 2117 (86.3) Diabetes, complicated 0.568 Yes 16 (16.0) 84 (84.0) No 372 (14.0) 2289 (86.0) Hypothyroidism 0.558 Yes 7 (11.5) 54 (88.5) No 381 (14.1) 2319 (85.9) Renal failure 0.009 Yes 16 (25.4) 47 (74.6) No 372 (13.8) 2326 (86.2) Liver disease 0.493 Yes 17 (16.4) 87 (83.6) No 371 (14.0) 2286 (86.0)
Peptic ulcer disease excluding 0.117 Bleeding
Yes 6 (7.9) 70 (92.1) No 382 (14.2) 2303 (85.8)
Solid tumor without metastasis <0.001 Yes 46 (27.7) 120 (72.3) Table 2 (Continued) Variable 30-day mortality Pvalue Yes, n (row %) No, n (row %) No 342 (13.2) 2253 (86.8) Rheumatoid arthritis 0.735 Yes 8 (15.7) 43 (84.3) No 380 (14.0) 2330 (86.0)
Fluid and electrolyte disorders 0.066 Yes 16 (21.3) 59 (78.7) No 372 (13.9) 2314 (86.2) Deficiency anemias 0.261 Yes 9 (10.0) 81 (90.0) No 379 (14.2) 2292 (85.8) Alcohol abuse 1 (20.0) 4 (80.0) 0.702 Yes No 387 (14.0) 2369 (86.0) Psychoses 0.659 Yes 3 (11.1) 24 (88.9) No 385 (14.1) 2349 (85.9) Depression 0.274 Yes 3 (25.0) 9 (75.0) No 385 (14.0) 2364 (86.0) AIDS –
Yes N/A N/A
No 388 (14.1) 2373 (85.9) Lymphoma 0.268 Yes 2 (28.6) 5 (71.4) No 386 (14.0) 2368 (86.0) Metastatic cancer <0.001 Yes 23 (31.9) 49 (68.0) No 385 (13.6) 2324 (86.4) Obesity –
Yes N.A N/A
No 388 (14.1) 2373 (85.9) Weight loss 0.799 Yes 1 (11.1) 8 (88.9) No 387 (14.1) 2365 (85.9) Drug abuse 0.250 Yes 4 (8.3) 44 (91.7) No 384 (14.2) 2329 (85.8) Blood loss anemia N/A N/A –
Yes 388 (14.1) 2373 (85.9) No
reputations for better outcomes. Furthermore, the HMO system in the US not only limits patientsÕ choice of doctors, but also doctorsÕ choice of hospitals, further confounding volume-outcome results. Aujesky et al.Õs study focused only on hospital caseload volume, rather than physician caseload volume [7], a study design that does not reflect the fact that patient outcomes for PE have been optimized through the development of physician-level strategies.
Conditional logistic regression analysis was used to eliminate potential confounding by unmeasured hospital variables. It essentially evaluates the volume-outcome association among physicians within each hospital and then averages these effects across hospitals. Therefore, our finding suggests that there is truly an independent effect of physiciansÕ experience on outcomes, regardless of the hospital in which they practise. Even within the same department, physicians may be employ-ing a variety of skills or procedures to treat PE, which could well lead to very different patient outcomes by physician.
The underlying mechanisms contributing to the volume-outcome association in PE treatment found in our study remain unclear. Prior literature proposes the hypotheses of
Ôpractise makes perfectÕ and Ôself-referralÕ to explain such results [20]. According to the Ôpractise makes perfectÕ hypothesis, a larger volume of PE patients allows physicians to develop better skills for managing PE. These skills could include earlier diagnosis through CT pulmonary angiography (CTPA), earlier treatment (such as early anticoagulation therapy or rapid fibrinolytic therapy for patients with massive or unstable PE), closer monitoring of hemodynamic stability to prevent PE recurrence, better patient education, and so on. Besides, high caseload volume physicians may benefit from greater resources in their practise, such as housestaff, nurses and pharmacists working with them to deliver expertise. Although we believe that Ôpractise makes perfectÕ plays an important role in our results, we are unable to demonstrate through our cross-sectional study whether the volume-outcome relationship can be fully explained by this hypothesis.
The second hypothesis, Ôselective-referralÕ, suggests that patients are inclined to selectively gravitate towards physicians with superior outcomes; thus these physicians develop a high volume of PE patients. However, PE occurs very suddenly and demands immediate medical attention. Although patient self-referral implies that those with less severe disease can plausibly Ôshop forÕ a physician with a Ôgood reputationÕ regardless of distance, or can opt for a geographically distant hospital with a Ôgood reputationÕ, in reality, patients facing acute life-threaten-ing situations generally settle for the nearest hospital. There-fore, selective referral may not be one of the major factors explaining the inverse relationship between patient outcomes and physician PE caseload volumes observed in Taiwan.
This study has a couple of caveats. First of all, some information, such as the interval between onset and diagnosis, Wells scores, blood pressure, pulse and respiratory rates, is not available through the NHIRD. Secondly, although this study has adjusted for patient comorbidities using the Elixhauser Comorbidity Index, the administrative data base we used is extremely limited in its ability to account for differences in PE severity among patients. Further studies using more sophisti-cated risk-adjusted methods (such as the severity classifications proposed by Aujesky et al. [21]) will be necessary to adequately confirm physician volume-outcome results found by this study. Despite these limitations, we found that after adjusting for patient, physician and hospital characteristics and for clustering effects among physicians, an inverse PE volume-outcome relationship does exist for physicians in Taiwan, but not for hospitals. There are several policy implications. First, we ought to regionalize care so more patients are cared for by the most experienced practitioners, anywhere they may be. Second, payers should consider reimbursing for consultations that include a second experienced attending physician, until each physician completes a threshold critical number of PE cases. Third, future research should be initiated to identify differences in clinical approaches and techniques that distinguish high case volume physicians with superior outcomes from low case volume physicians with inferior outcomes; the results of such studies could help the latter improve the quality of their PE patient care.
Table 3 Crude and adjusted odds ratios for 30-day mortalities, by physician pulmonary embolism case volume
Variables
Crude odds ratio 95% CI
Adjusted odds ratio 95% CI
Physician pulmonary embolism case volume <3 1.000 1.000
3–6 0.714* (0.545–0.935) 0.737* (0.557–0.974) ‡7 0.462*** (0.332–0.642) 0.508*** (0.362–0.714) Physician characteristics
Physician age (years)
<41 0.945 (0.733–1.218) 0.986 (0.761–1.277) 41–50 1.000 1.000 >50 0.751 (0.508–1.109) 0.827 (0.554–1.235) Physician gender Male 1.061 (0.601–1.872) 1.176 (0.648–2.134) Female 1.000 1.000 Practise location Urban 0.962 (0.744–1.243) 0.991 (0.760–1.292) Rural 1.000 1.000 Patient characteristics Patient age (years)
<65 1.000 1.000 65–74 1.479** (1.127–1.941) 1.672*** (1.260–2.220) >74 1.521** (1.146–2.019) 1.709*** (1.274–2.292) Congestive heart failure 1.390 (0.998–1.936) 1.404 (0.998–1.976) Hypertension 0.519***(0.376–0.716) 0.518*** (0.371–0.723) Coagulopathy 3.819***(1.836–7.943) 4.401*** (2.051–9.444) Renal failure 2.109**(1.139–3.902) 2.075* (1.094–3.936) Solid tumor without metastasis 2.332***(1.590-3.420) 1.706* (1.096-2.655) Metastatic cancer 3.026***(1.773-5.164) 2.132* (1.159-3.920) Hospital characteristics Hospital level Medical center 1102 (0.878–1.382) 1.073 (0.848–1.359) Regional hospital 1.000 1.000 District hospital 1.410 (0.942–2.109) 1.203 (0.791–1.829) *P < 0.05; **P < 0.01;***P < 0.001.
Disclosure of Conflict of Interests
The authors state that they have no conflict of interest.
References
1 Stein PD, Kayali F, Olson RE. Estimated case fatality rate of pul-monary embolism, 1979 to 1998. Am J Cardiol 2004; 93: 1197–9. 2 Hirsh J, Hoak J. Management of deep vein thrombosis and pulmonary
embolism. A statement for healthcare professionals. Council on Thrombosis. Circulation 1996; 93: 2212–45.
3 Horlander KT, Mannino DM, Leeper KV. Pulmonary embolism mortality in the United States, 1979–1998. Arch Intern Med 2003; 163: 1711–7.
4 Lilienfeld DE. Decreasing mortality from pulmonary embolism in the United States, 1979–1996. Int J Epidemiol 2000; 29: 465–9.
5 Lilienfeld DE, Godbold JH, Burke GL, Sprafka JM, Pham DL, Baxter J. Hospitalization and case fatality for pulmonary embolism in the twin cities: 1979–1984. Am Heart J 1990; 120: 392–5.
6 Stein PD, Henry JW. Untreated patients with pulmonary embolism: outcome, clinical and laboratory assessment. Chest 1995; 107: 931–5. 7 Aujesky D, Mor MK, Geng M, Fine MJ, Renaud B, Ibrahim SA.
Hospital volume and patient outcomes in pulmonary embolism. CMAJ2008; 178: 27–33.
8 Chiquette E, Amato MG, Bussey HI. Comparison of an anticoagu-lation clinic with usual medical care: anticoaguanticoagu-lation control, patient outcomes, and health care costs. Arch Intern Med 1998; 158: 1641–7. 9 Luft HS, Bunker JP, Enthoven AC. Should operations be
regional-ized? The empirical relation between surgical volume and mortality. N Engl J Med1979; 301: 1364–9.
10 Halm EA, Lee C, Chassin MR. Is volume related to outcome in health care? A systematic review and methodologic critique of the literature. Ann Intern Med2002; 137: 511–20.
11 Nallamothu BK, Saint S, Hofer TP, Vijan S, Eagle KA, Bernstein SJ. Impact of patient risk on the hospital volume-outcome relationship in coronary artery bypass grafting. Arch Intern Med 2005; 165: 333–7. 12 Birkmeyer JD, Siewers AE, Finlayson EV, Stukel TA, Lucas FL,
Batista I, Welch HG, Wennberg DE. Hospital volume and surgical mortality in the United States. N Engl J Med 2002; 346: 1128–37. 13 Elixhauser A, Steiner C, Harris DR, Coffey RM. Comorbidity
mea-sures for use with administrative data. Med Care 1998; 36: 8–27. 14 Kurichi JE, Stineman MG, Kwong PL, Bates BE, Reker DM.
Assessing and using comorbidity measures in elderly veterans with lower extremity amputations. Gerontology 2007; 53: 255–9.
15 Thombs BD, Singh VA, Halonen J, Diallo A, Milner SM. The effects of preexisting medical comorbidities on mortality and length of hos-pital stay in acute burn injury: evidence from a national sample of 31,338 adult patients. Ann Surg 2007; 245: 629–34.
16 Hannan EL, Siu AL, Kumar D, Kilburn H Jr, Chassin MR. The decline in coronary artery bypass graft surgery mortality in New York State. The role of surgeon volume. JAMA 1995; 273: 209–13. 17 Hannan EL, Kilburn H Jr, Racz M, Shields E, Chassin MR.
Improving the outcomes of coronary artery bypass surgery in New York State. JAMA 1994; 271: 761–6.
18 Lien YC, Huang MT, Lin HC. Association between surgeon and hospital volume and in-hospital fatalities after lung cancer resections: the experience of an Asian country. Ann Thorac Surg 2007; 83: 1837– 43.
19 Lin HC, Xirasagar S, Chen CH, Hwang YT. PhysicianÕs case volume of intensive care unit pneumonia admissions and in-hospital mortality. Am J Respir Crit Care Med2008; 177: 989–94.
20 Luft HS, Hunt SS, Maerki SC. The volume-outcome relationship: practice-makes-perfect or selective-referral patterns? Health Serv Res 1987; 22: 157–82.
21 Aujesky D, Obrosky DS, Stone RA, Auble TE, Perrier A, Cornuz J, Roy PM, Fine MJ. Derivation and validation of a prognostic model for pulmonary embolism. Am J Respir Crit Care Med 2005; 172: 1041–6.