行政院國家科學委員會補助專題研究計畫
□期中進度報告
期末報告
公路路網之脆弱度、回復力及減輕對策之資源配置
計畫類別:
個別型計畫 □整合型計畫
計畫編號:NSC 99-2410-H-009-062-MY3
執行期間:99 年 08 月 01 日至 102 年 10 月 31 日
執行機構及系所:國立交通大學交通運輸研究所
計畫主持人:馮正民
共同主持人:
計畫參與人員:謝承憲、邱展煜、許紋綺、李政儀、賴怡心、謝慧婷
林君恬、施羽霖
本計畫除繳交成果報告外,另須繳交以下
出國
報告:
□移地研究心得報告
出席國際學術會議心得報告
□國際合作研究計畫國外研究報告
處理方式:
除列管計畫及下列情形者外,得立即公開查詢
□涉及專利或其他智慧財產權,□一年□二年後可公開查詢
中
華
民
國
一
0
二
年
十
月
三
十
日
1
一、 中、英文摘要
摘要
全球氣候變遷使得極端氣候型態發生頻繁,而臺灣地區的天然災害發生次數與強度皆與日俱增,對 於生命、財產、生活安全造成可觀的損失。關鍵基礎設施如運輸、供電及健康照護系統的損壞,將影 響社會日常運作並導致其他系統的失效。其中,運輸系統除於災害預防與整備階段扮演資源調度及預 疏散功能外,救災物流與孤島效應更顯其關鍵,若運輸系統功能因毀壞而失效,不僅直接影響當地居 民移動需求,並負面衝擊疏散、醫療及救災功能。據此,本研究透過文獻評析探討影響路網脆弱度之 因素,並考量脆弱因子間之相互依存性,進而擬定影響都會區路網回復力之關鍵因素,根據文獻回顧 結果,本研究選取 11 項因子進行評估,且以臺北都會區為實例分析區域驗證可行性,利用地理資訊系 統圖層繪製與套疊,分析結果顯示鄰近道路服務水準、連結性、與急救責任醫院的可及性,為影響都 會區路網回復力最劇之指標。本研究所提方法得協助規劃者了解路網脆弱度與回復力分析架構與工具 外,並供決策者利用脆弱度衝擊強度以分析各道路單元之脆弱度,據而研擬改善策略並決定資源配置 之程序,優先防護高脆弱之關鍵設施,最終降低災害風險。 關鍵字:路網脆弱度、相依性、回復力、地理資訊系統Abstract
Global environmental changes have led to frequent occurrences of extreme climatic changes. The frequency and magnitude of natural hazards in Taiwan have increased in recent years, causing remarkable losses in mortality, injury, and property. Disruptions to critical infrastructures, including transportation systems, electrical power suppliers, and health care systems, impair the ability to ensure sustainable daily operations and cause failures in other systems. Along with resource allocation and pre-evacuation, road networks profoundly impact disaster response and recovery, particularly emergent disaster logistics and islanding rescues. This study examines the resilience of road network failures from the perspectives of vulnerability and interdependency. Based on 11 fragile factors developed in the literature, road network vulnerability is determined by geographic information systems illustrating overlapped layers. Analytical results demonstrate that the level of service on adjacent links, connectivity, and accessibility to hospital emergency facilities significantly impact the resilience of metropolitan road networks. The method developed in this study can assist planners in understanding the assessment tools of road network resilience and help decision makers prioritize resource allocation to improve road network serviceability under hazardous conditions.
Keywords: Road network vulnerability, interdependency, resilience, geographic information system (GIS)
二、報告內容
1. Introduction
2
rhythm of social life, and creating barriers to economic development. Specifically, the interaction between climate and environmental changes has gradually increased the magnitude, duration, and threat of disasters. The absence of disaster prevention, mitigation, preparedness, and relief heightens the adverse impacts on social mechanisms, lives, properties, and economic development. The Yokohama Strategy, initiated at the World Conference on Natural Disaster Reduction held in May 1994, provided guidelines for shielding humans, infrastructures, social operations, and economic systems from natural disasters. In recent years, disaster research has shifted from disaster science to the relationship among disaster, environmental systems, and socioeconomic systems. In 2004, the International Strategy for Disaster Reduction (UN/ISDR) defined disaster as the effects and consequences of hazards on vulnerable socioeconomic systems in which vulnerability limits the capability for coping with the influence of the hazard. In addition, the Hyogo Declaration suggested that suffering in hazards could be mitigated by reducing vulnerability. Furthermore, people must increase their resilience to disasters through early warning systems, risk assessments, education, and integrated approaches (UN/ISDR, 2005).
For infrastructure, transportation systems are critical because of their importance to the daily life of commuters, logistics, and business travelers. A failed transportation system leads to significantly higher travel time and monetary loss in reorganizing travel plans. In addition to resource deployment and pre-evacuation during disaster prevention and preparation, transportation systems simultaneously impact relief logistics, emergent medical treatment, as well as accessibility to, and the recovery of, disaster areas. However, damages to transportation systems are unavoidable For example, the 2004 Indian Ocean Tsunami in Asia, the 2005 London Underground bombings, and the 2011 Great East Japan Earthquake destroyed transportation infrastructures, further complicating rescue efforts and material distribution, as well as increasing the risks of secondary disasters. Transportation system management prioritizes critical infrastructure maintenance and repair, contingency planning, the assessment of regional disparities and vulnerability.
A reliable road network depends on how efficiently infrastructures and services cope with hazards, and how successfully operations are restored after a disaster. The vulnerability and resilience of road networks have therefore received increasing attention in recent years. Numerous studies have suggested the need for analysis methods to identify critical road links by evaluating the consequences of severe disruptions in transport systems based on travel time and cost (Taylor et al., 2006; Jenelius et al., 2006; Scott et al., 2006; Jenelius, 2009). However, road network failures resulting from infrastructure system interactions have seldom been considered. Therefore, this study proposes a prototype model for determining the critical vulnerable factors influencing the resilience of metropolitan road networks, based on interdependency analyses to support decision makers in disaster prevention, mitigation, and preparedness. The rest of this paper is organized as follows. Section 2 defines vulnerability and resilience. Section 3 presents a detailed introduction to the research methodology, and Section 4 discusses the empirical resilience of road networks in the Taipei Metropolitan area. Lastly, Section 5 offers a conclusion, along with suggestions for future research.
2. Vulnerability and resilience 2.1 Vulnerability
3
damages incurred by a hazard, and it is divided into various dimensions, including physical, social, economic, and environmental factors. Vulnerability thus refers to a negative indicator of system performance during disaster management. A system with a high vulnerability implies that it possesses low resistance to external influences. Additionally, the vulnerability factors of a system vary because of spatiotemporal and hazard characteristics. Chambers (2006) indicated that vulnerability exists in systems with an inferior resistance to, and coping capacities for, insecure conditions. Furthermore, a system is vulnerable when exposed without contingency capability to risks, impacts, and pressures from disasters. Vulnerability refers to the state of susceptibility to damage without adaptation, resulting from the exposure to negative influences caused by environmental and societal changes (Adger, 2006).
Vulnerability analysis at the national level includes infrastructure (Cutter et al., 2003; Schmidt-Thomé et al., 2006), land management and development, and disaster mitigation plans (Schmidt-Thomé et al., 2006). Moreover, Turner II et al. (2003) posited that global climatic and environmental changes make vulnerable areas, along with factor-related determinations, should be a priority concern. Potential damages from a threat, including fatalities, health, the destruction of assets, and the degradation of natural environments, are normally indicators for assessing vulnerability, and they can lead to complex causal relationships among vulnerable factors. Risk perceptions of people implementing vulnerability mitigation policies can be strengthened by providing infrastructural support and identifying individual and societal characteristics (Wolf et al., 2010). Apostolakis and Lemon (2005) identified candidate vulnerable scenarios by using interconnected digraphs. Methodologies that identify systematic interactions in specific spatiotemporal scopes have been suggested as an effective means for analyzing vulnerability with interdependency among vulnerability factors. The potential damage from a threat, including fatalities, health, destruction of assets and degradation of the natural environment, is usually used as an indicator for assessing vulnerability. This brings up the complicated causal relationships between vulnerable factors. Methodologies identifying systematic interactions in specific spatiotemporal scopes are suggested to successfully analyze the vulnerability with interdependency between vulnerable factors (Deutsche Gesellschaft für Technische Zusammenarbeit, GTZ, 2004). However, a generalized universal methodology for measuring vulnerability is unavailable due to the complex vulnerable factors that depend on spatiotemporal attributes of hazards composed of social, economic, political and cultural constructs.
Although vulnerability is common in the risk assessment of transportation systems, defining a meaning for transport vulnerability that meets the consensus is difficult. Jenelius et al. (2006) examined road network vulnerability by using link importance and the site exposure index, which represents how failure link impacts general travel costs. Bana e Costa et al. (2008) analyzed the vulnerability of bridges and tunnels in Lisbon, which was caused by an earthquake, to identify critical infrastructures. By extending road network vulnerability from link importance to regional importance and exposure, Jenelius (2009) demonstrated that a longer substitution distance and an increase in derived temporal costs imply less accessibility and more vulnerability. Examining bridge failure vulnerability based on 11 interacting vulnerability factors, Hsieh et al. (2011) found that accessibility and redundancy affected vulnerability and risk significantly. Moreover, an “impact area” vulnerability analysis approach, in which the consequences of a link closure within an impacted area (instead of the entire network) are evaluated, significantly increased the efficiency in determining the most critical links in large-scale and congested road networks with demand uncertainty (Chen et al., 2012).
4
Miller-Hooks et al. (2012) proposed procedures that markedly increased the ability to assist in pre-disruption network vulnerability assessment and make pre-disaster vulnerability-reduction investment decisions.
2.2 Resilience
Resilience represents the ability of exposure individuals to resist and recover from damages caused by external threats (Clark et al., 2000). UN/ISDR (2009) defined resilience as the ability to resist, absorb, accommodate, and recover from the effects of a hazard in a timely and efficient manner, such as preserving and restoring basic functions. The sensitivity and resilience of a system should be considered a part of vulnerability, in addition to the exposure of vulnerable individuals and its various effects resulting from hazards (Ford & Smit, 2004; O’Brien et al., 2004). Resilience allows scholars to understand natural hazards based on social perspectives (Berkes, 2007; Zhuo et al., 2010). Because of the complexities of, and the mismatched scales in, societal and natural systems, as well as the dependences among scales, resilience examines multiple configurations of dynamic human-environment interactions (McGill, 2010).
Turner II (2010) discussed the similarities and differences between vulnerability and resilience with respect to sustainability, environmental services, along with the tradeoffs in the performance of services calculated by human outcomes. Resilience represents an identifiable property whenever systems cope with demands (Nemeth, 2008), and it emphasizes the individual’s ability to determine crucial system functions and establish robust and flexible processes (Dekker et al., 2008). Flexible strategies make systems more resilient to disturbances (Carvalho et al., 2012). Moreover, resilience assessment is based on dimensionless analytical functions in relation to variations in functionality (e.g., disaster losses and recovery paths), depending on available resources, societal preparedness, and public policies (Cimellaro et al., 2010). Wang et al. (2012) constructed a framework to evaluate resilience by analyzing the resistance of social-ecological systems in Taiwan to changes caused by frequent, intense typhoons and found that land use changes from forests to agricultural or urban uses led to a degradation of ecosystem resilience.
Cox et al. (2011) constructed operational metrics, ranging from specific travels to more holistic measures such as the contribution of travel to economic activities, according to vulnerability, flexibility, and resource availability. The metrics were based on both supply and demand perspectives to determine the resilience of a passenger transportation system in relation to terrorism. Resilience represents the ability to react from stresses that impact performance, for example, the ability to absorb effects from disturbances and ensure operational continuity based on transportation perspective (Tamvakis & Xenidis, 2012). Furthermore, individual risk perceptions affect the implementation of vulnerability mitigation policies (Wolf et al., 2010) and influence transportation system resilience (Cox et al., 2011) because changing risk perceptions following a hazard leads to behavioral responses such as modal choice alteration (Prager et al., 2011). Moreover, decision makers affected by disasters may be unable to devise defensible mitigation strategies or allocate risk-management resources because of an inaccurate perception of risk (Posner, 2004). Heuristics are useful to making daily decisions, but they are hardly used in disaster-risk assessment (Slovic, 2007). Decision makers should be able to formulate strategies to reduce vulnerability to uncertainty based on risk scenarios and develop institutive capability to rapidly adapt to emerging hazards (Department of Homeland Security, 2006).
5
capability to maintain function, and dynamic resilience refers to the individual’s capability to transition rapidly from disturbance to stability. Numerous strategies for enhancing transportation resilience have been developed, including infrastructure/service conservation, redundancy, relocation, technological improvements, and logistics refinement for static resilience, operational impediment elimination, effective management, and accelerating the restoration of dynamic resilience, along with input substitution, import substitution, and inventories for both static and dynamic resilience (Ekern & Crossett, 2010; Meyer, 2010). Accordingly, static and dynamic resilience refer to vulnerability and resilience, respectively, in this study.
Sustainability integrating vulnerability and resilience increasingly share appreciation for the complexity of dynamic human-environment interactions, requires vulnerability research to focus on environmental services, while resilience research focuses on human outcomes beyond the proximate kind (Turner II, 2010). Therefore, assessments in vulnerability and resilience are inseparable in developing robust and reliable methods for measuring vulnerability, along with facilitating the adaptation and resilience of mechanisms of governance.
3. Research Approach 3.1 Factor determination
The impacts of road network failure refer to insufficient daily resources, traffic interruption, and various other issues. Previous studies considered vulnerability a spatial condition, and infrastructure and exposure from a physical perspective (UN/ISDR, 2009). Bercht and Wehrhahn (2010) proposed a vulnerability assessment approach that incorporated geography and cognitive psychology, schematizing personal and environmental factors, and evaluating the capacity to cope with changes in socioeconomics, as well as spatial structures and processes. Because of the mesoscopic assessment, structural vulnerability based on the perspective of engineering is excluded from physical vulnerability. Therefore, this study determines the fragile factors of hazards at metropolitan road networks based on the failure elements proposed by Hsieh and Feng (2014), which include delay time in substitution, the average degenerated level of service (LOS), the number of substitutive links, connectivity, residents, the dependency ratio, the ratio of disabled residents, distance to hospital emergency rooms, the amount of wholesaling and retailing, and employment and household income.
The delay time between the substitutive and original shortest paths and the generated degree in LOS of each link satisfy the user’s need for mobility, that is, the individual’s ease of movement (Levinson 2003), which is equivalent to overcoming spatial resistance. Jenelius (2009) evaluated the effect of link closure by using delay and the difference between the new and original shortest route. Moreover, a failed metropolitan road link without substitutions limits area accessibility and causes islanding areas within interrupted surface transportation. Accessibility is used to evaluate network developments in transportation planning and to measure the potential of regional economic performance in urban planning. The amount of substitutions and connectivity calculated by the gamma index, which considers the ratio between observed links and all possible links, contributes to the definition of accessibility as the ease of interaction between network nodes (Levine & Garb, 2002).
The number of residents is used as the exposure of road network failure. The resident population perceives in daily life the direct negative impact caused by road network failure, including increased travel time, a lack of access to a health care system, and a reduced quality of life. A larger number of residents implies a greater
6
number of potentially affected individuals, and thus, more vulnerability. The ratio of disadvantaged groups with limited self-protection capacity is proportional to vulnerability, in which the criteria consist of older and disabled people (Messner & Meyer, 2005). An aging population and low fertility rates have significantly influenced demographics globally, and increased the dependency ratio. A higher dependency ratio representing a higher loading of each working age population implies greater vulnerability. Disabled residents are a socially vulnerable group because of deficient self-protection and response capacities (Rygel et al., 2006).
The resilience function, exemplified by hospital networks, captures the effects of hazards as well as the strategies for preparedness, response, and recovery (Cimellaro et al., 2010). The Transportation Demand Management Encyclopedia (2010) suggested that transportation resilience was influenced by emergency response actions, public services, and food supplies. Regional response and health care during hazards were evaluated using the distance to an authorized hospital emergency center, to analyze how road network failure affected access to adequate health care (Hsieh et al., 2011). Although inaccessibility heavily affected older and chronically ill patients, the losses incurred from adjusted hospitalized practices could not be estimated because of a lack of data. The redundant use of daily resources such as electricity generators, water storage facilities, and life necessities deteriorates the quality of life. Because of unserviceable electrical and water facilities, redundant resources in wholesaling and retailing become the most important indicator in island areas waiting for rescue. Despite much time wasted commuting to work, a higher number of the employed population implies a more resilient industry. Furthermore, higher household disposable income can mitigate hazard-related impacts.
Wang et al. (2008) suggested that classifying factor values requires specific decision rules of thresholds. Rather than precise quantitative information, the rating scale assists stakeholders without professional knowledge in perceiving risk and communicating with authorities. This study adopts the thresholds and standardized classifications according to open participatory meetings that emphasize communication, cooperation, and compromise among various participants. The objective is to build a consensus for system behavior, along with weight of each factor determined by the analytic network process proposed by Hsieh and Feng (2014), in which rating 0 indicates that a road network can operate normally, and ratings of 1 to 4 indicate slightly affected roads, medially affected roads, strongly affected roads, and road network failure, respectively.
3.2 Interdependency analysis
Because of the interconnected nature of infrastructures, once a natural hazard damages a system, other systems can also malfunction. The interactions among vulnerable factors for natural disasters can create feedback loops, rather than a unidirectional chain. Neglecting feedback loop effects can underestimate system vulnerability. McDaniels et al. (2007) developed an analytical framework with empirical applications in electrical power outages to understand how extreme hazards can lead to infrastructure failure interdependencies, based on media reports and official ex-post assessment data. According to their results, failed electrical power supplies significantly impact heating, ventilation, and air conditioning in buildings, water systems, hospitals, public health facilities, and transportation systems. Adachi and Ellingwood (2008) demonstrated the importance of considering interactions when evaluating seismic vulnerability and the risks
7
to a networked system, as well as the utility of back-up power systems in electrical power facilities.
The interaction among system elements is crucial to understanding and managing system behaviors. Lee et al. (2007) asserted that exploring and controlling system behaviors are difficult and prohibitively expensive. To overcome the limitations of conventional methods, including the inability to explain compounding effects and to handle uncertainty, feedback loops, and iterative processes (Nguyen & Ogunlana, 2005), system approaches have been introduced to simulate the complex and uncertain behavior of systems by determining the causal relationships among items (Alberts et al., 2004). However, the precise relationship among factors may be unclear because of the complexity of the systems (Stylios & Groumpos, 2000). Cognitive maps were introduced to solve the problems of qualitative factors and linkages, implying that decision makers make sense of reality and decide what they should do to forecast future trends more accurately, resolve conflicts, establish brainstorming sessions, and assist in negotiations (Eden & Ackermann, 2004). Moreover, fuzzy cognitive maps (FCMs), which fuse the advances of fuzzy logic and cognitive map theories, are an alternative qualitative approach to dynamic systems, where the approximate behavior of a system can be observed efficiently and without the presence of an operations research expert. Kwahk and Kim (1999) identified the characteristics of FCMs as understanding causal relationships, promoting the identification of opportunities and threats, and facilitating system thinking.
FCMs often comprise variables, and their causal relations are represented as fuzzy implications. A link Lij from variable Ci to variable Cj determines to what extent Ci impacts Cj. The link Lij can assume values in the fuzzy causal interval [-1, 1], allowing degrees of causality, in which Lij>0 denotes a positive causality between Ci and Cj, whereas Lij<0 indicates that an increased Ci leads to a diminished Cj. Equation 1 represents the causal impact matrix in an FCM system.
n n ij L L L L M 21 12 11 (1)
Moreover, input vector A in Eq. 2 is composed of value of variable Ct i at the iteration t, a . The it
activation level At1 is calculated by Eq. 3, in which the unipolar sigmoid threshold function ) 1 /( 1 ) (x e 5x
f . This process continues until a convergence or circulation system. This is the resulting equilibrium vector providing the answer to the what-if question.
n t i t t t a a a A 1 2 1 (2)
A M
f At1 t (3)A major difficulty of FCMs lies in determining relationship intensity with a qualitative feature reflecting the cognitive condition of individuals, something which cannot be directly measured. Some researchers indicated relationships using weighted connections, i.e. simple additive weighting and AHP (Georgopoulos et al., 2003). A collective map representing the consensus of all the stakeholders should be created by analyzing
8
the maps of participants in a decision-making group (Carbonara and Scozzi, 2006). Besides, the relationships could be derived via a statistical approach. Aguilar (2005) reviewed lots of application of FCMs in different domains and concluded that notion of time is crucial for dynamic system. Büyüközkan et al. (2009) proposed a systematic way of analyzing collaborative planning, forecasting and replenishment supporting factors using FCMs and proved that FCMs is particularly useful for solving problems in which a number of decision variables and uncontrollable variables are causally interrelated. Feng and Hsieh (2009) analyzed transport diversity via a hybrid model integrating system dynamics, FCMs, and sensitivity model to tackle the uncertainty, feedback interaction, and complexity of system relationships.
Furthermore, the sensitivity model developed by Vester and von Hesler (1982) was used to identify the systematic role of each fragile factor. Based on the 11 factors selected in the previous phase, magnitudes of causality among the variables were examined to identify their functional roles in metropolitan road network operations. The impact matrix representing the magnitudes of causal effects of each variable pair was evaluated by joint discussion at open participatory meetings to obtain a consensus, with reference to data compiled in advance. The various functional roles of the vulnerable factors were recognized by distinct values of causality, summed by rows and columns in the impact matrix with their influence on the system. This characterizes the system behavior accordingly (Chan & Huang, 2004). Additionally, each variable can be categorized as active, passive, critical or buffering, according to the value derived from the impact matrix. The results can assist planners in identifying the patterns of system behavior and the critical vulnerable factors in metropolitan road networks, and they are useful for developing strategies. This study constructs the impact matrix through FCMs.
4. Empirical Results
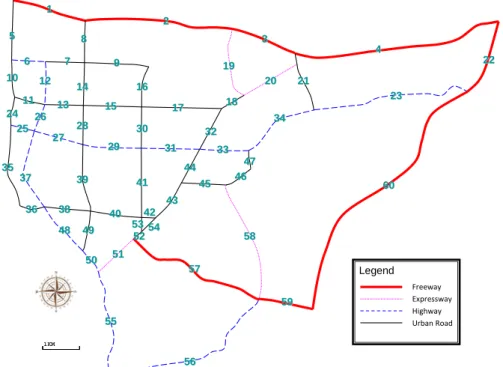
This study uses the Taipei Metropolitan road network as an empirical case study to analyze road network vulnerability and to verify the feasibility of systematic interdependency assessments. Because of a mesoscopic viewpoint, this study simplified the metropolitan road network into 60 links with four levels: freeway, expressway, highway, and urban road. Moreover, the advantages of a geographic information system (GIS) of spatial information helped decision makers determine visually and systematically the location of different objects. A GIS integrates, analyzes, and displays spatial information for disaster prevention and mitigation planning. Furthermore, analytical instruments based on GIS-aided satellite/aerial images assist stakeholders in risk perception and communication because results from instruments with a high degree of accuracy are relatively easy to interpret and useful for analyzing causal-impact relationships (GTZ, 2004).
The GIS provides new information by combining multiple layers in a compatible spatial reference area to resolve difficulties associated with integrating numerous spatial variables in vulnerability assessments (Wang et al., 2008). The complex nature of vulnerability leads to the development of a theoretical framework for quantitative vulnerability assessment, using a composite index in a GIS environment (de Andrade et al., 2010). This study therefore analyzes the spatial-functional vulnerability maps generated by the GIS and considers the interdependencies among fragile variables in road networks. Figure 1 shows the digitized spatial location of vulnerable links in the Taipei Metropolitan area.
9
form of GIS maps. The residents, dependency ratio, and ratio of disabled residents in each link were sourced from the city’s annual statistical overview. Employment and the amount of wholesaling and retailing were referenced from the national industry, commerce, and service census. The average annual household consolidated income tax representing household disposable income was referenced from Lu et al. (2010), and the delay time in substitutions, number of substitutive links, and distances to hospital emergency facilities were measured from GIS maps. Moreover, the average degenerated LOS was calculated by redistributing trips on serviceable links. 1KM 1KM Legend Freeway Expressway Highway Urban Road 1 1 2 2 3 3 4 4 5 5 6 6 77 8 8 9 9 10 10 11 11 12 12 13 13 14 14 15 15 16 16 17 17 1818 19 19 20 20 2121 22 22 23 23 24 24 25 25 26 26 27 27 28 28 29 29 30 30 31 31 32 32 33 33 34 34 35 35 36 36 37 37 38 38 39 39 40 40 41 41 42 42 43 43 44 44 45 45 4646 47 47 48 48 4949 50 50 5151 52 52 53 535454 55 55 56 56 57 57 58 58 59 59 60 60
Note: Number on each link refers to link code from 1 to 60.
Figure 1 Empirical road network
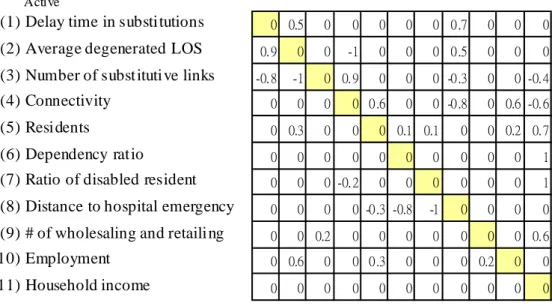
Table 1 indicates a 11 causal impact matrix M as Eq. 1, in which the systematic relationship of each 11 variable is identified. Each cell in the impact matrix reveals the direct influence of the vertical variable on the horizontal variable, e.g. the cell corresponding to the second column and first row shows the influence of the delay time in substitutions on average degenerated LOS. The process of creating the impact matrix involves group discussion. Three different groups, consisting of government officials, experts, and planning faculty, are asked each to discuss and complete the matrix. After having completed their separate matrices, the three groups work together to create a consensual matrix. At the same time, the description of the variables is partly revised and redefined in such a manner that each group can agree on the assessment.
10
Passive (1) (2) (3) (4) (5) (6) (7) (8) (9) (10) (11) Active
(1) Delay time in substitutions 0 0.5 0 0 0 0 0 0.7 0 0 0
(2) Average degenerated LOS 0. 9 0 0 -1 0 0 0 0.5 0 0 0
(3) Number of subst itutive links -0. 8 -1 0 0. 9 0 0 0 -0.3 0 0 -0. 4
(4) Connectivity 0 0 0 0 0.6 0 0 -0.8 0 0.6 -0. 6
(5) Residents 0 0.3 0 0 0 0.1 0.1 0 0 0.2 0. 7
(6) Dependency ratio 0 0 0 0 0 0 0 0 0 0 1
(7) Ratio of disabled resident 0 0 0 -0. 2 0 0 0 0 0 0 1
(8) Distance to hospital emergency 0 0 0 0 -0.3 -0.8 -1 0 0 0 0
(9) # of wholesaling and retailing 0 0 0.2 0 0 0 0 0 0 0 0. 6
(10) Employment 0 0.6 0 0 0.3 0 0 0 0.2 0 0
(11) Household income 0 0 0 0 0 0 0 0 0 0 0
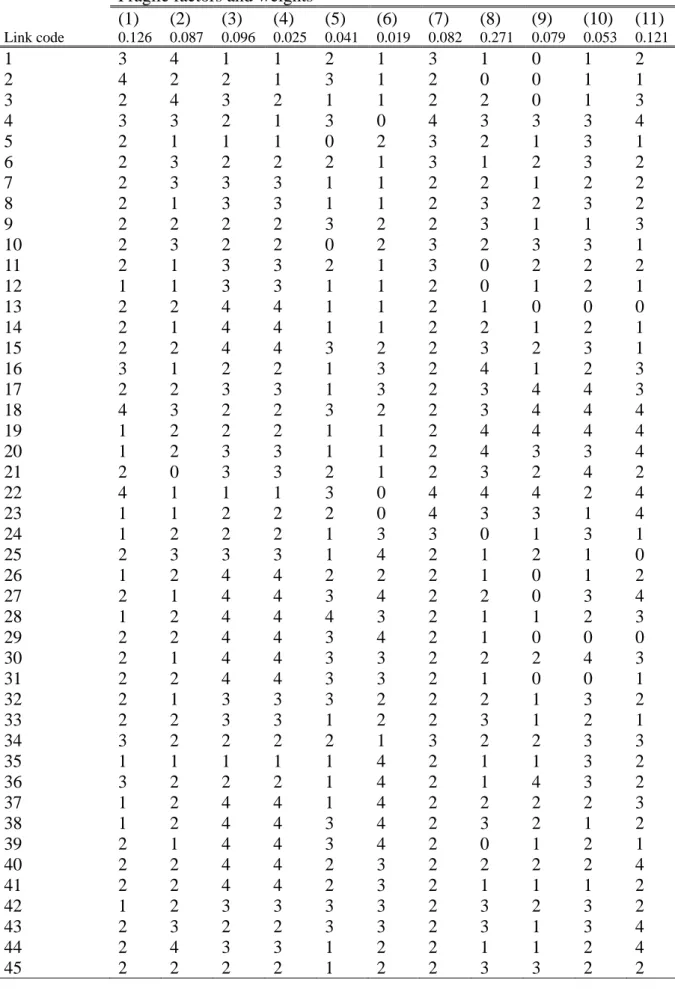
Table A-1 reveals shows the raw network vulnerability of each link and the weight of each fragile factor. The raw vulnerability of each link was used as an input vector in Equation 2, and the causalities in Table 1 are substituted as At and M, respectively, in Equation 3 to assess vulnerability considering interdependency through FCMs. The systematic role of each variable was identified based on the information presented in Table 1. The active sum, ASi, calculated by the sum of row i, shows how strongly the variable affects other
variables of the system. Conversely, the passive sum, PSj, calculated by the sum of column j, illustrates the
extent to which the variable was influenced by other variables. Variations in variables with a high AS would impact the system significantly even with a small change, whereas a high PS variable would be impacted dramatically as soon as some activity is within the system. Additionally, a variable occupying a high AS and PS simultaneously expresses a dominant role in the system.
11
Figure 2 Systematic roles of variables
All variables are plotted in Fig. 2, based on the AS and PS, creating a field of tension between active, critical, reactive, and buffering. Figure 2 shows the first strategic indications by expressing the roles in a conceptual manner, where the vulnerable factors of average degenerated LOS, connectivity, and distance to hospital emergency facilities are critical variables in metropolitan road network operations, meriting further investigation. The average degenerated LOS and connectivity representing mobility and accessibility, respectively, from the aggregate viewpoint are more critical than delay time and the number of substitutions from an individual perspective. The distance to hospital emergency facilities, which is critical to the rescue of injured people, particularly disadvantaged groups, has a major resilience function in urban road networks. Moreover, the three vulnerable factors can be affected significantly by many other variables, implying that development policies should focus more on preventing negative impacts on average degenerated LOS, connectivity, and distance to hospital emergency facilities.
The crucial factors determined by ANP (shown in the second row in Table A-1), including the number of substitutive links and the number of wholesaling and retailing, are located in the active and reactive regions, respectively, rather than in the critical quadrant. Figure 3 shows the vulnerability of the Taipei Metropolitan road network involving spatial-functional interdependency among vulnerable factors. Based on Fig. 3, all links converge to three vulnerability categories (i.e., A, B, and C) after 15 iterations using FCMs. According to Hsieh and Feng (2014), vulnerabilities of the road network in Category A converge to a vulnerable level of approximately 3.4, whereas links in Category C converge to approximately 2.05. Moreover, links belonging to Category B vibrate between 2.05 and 3.43 cyclically (shown in Fig. 4-A). Metropolitan road network vulnerability would be underestimated if causal loops were absent from the analyses. In the interdependency assessment, fragile factors such as the number of substitutive links, the amount of wholesaling and retailing, employment, and household income, performance the most vulnerable in all categories, whereas vulnerable residents slightly affects road network operations in Categories B and C.
12 1KM 1KM Legend Category A Category B Category C
Figure 3 Taipei Metropolitan road network vulnerability considering interdependency
Based on Fig. 2, a priority concern should be the improvement of connectivity by constructing backup physical infrastructures for mitigating the impact on LOS of adjacent links, as well as inaccessibility to hospital emergency facilities. Authorities should develop the resistance of the metropolitan road network to reduce the probability of failure based on a cost—benefit analysis, including making redundant substitutive links for increasing network resilience and investing in hospital emergency facilities to maintain functioning emergency health care systems. A scenario is created wherein the coping capacity of each link is strengthened to resist the negative impacts of hazards, and hospital emergency facilities are spread densely throughout, protecting critical vulnerable factors from disturbances. Impact causality is thus re-determined by participants, following the scenario. Figure 4-B shows the simulation results considering the policies adopted to protect the critical vulnerable factors.
Category C, which is the least vulnerable, is almost the same in Figs. 4-A and 4-B; however, the coping capacities in Categories A and B improve because of protection or redundant construction in critical infrastructures. Vulnerabilities in the road network in Category A decrease from approximately 3.4 to 2.8, whereas the links in Category B converge to a vibration between 2.1 and 2.6 cyclically, showing a more resilient metropolitan road network. Moreover, this study alters causality between other vulnerable factors, including the number of wholesaling and retailing, employment, and residents to validate the robust simulation of adopted strategies. The three alterations lead to insignificant differences from the simulation results without policy adoption, as shown in Fig. 4-A, verifying the critical roles of average degenerated LOS, connectivity, and the distance to hospital emergency facilities.
13 1 2 3 4 0 3 6 9 12 15 iteration Vulnerability A B C 1 2 3 4 0 3 6 9 12 15 iteration Vulnerability A B C
(A) Without resilience policies (B) Resilience policy interventions Figure 4 Interdependent vulnerable categories
5. Conclusions
This study presents a prototype model to assist decision makers in determining the resilience of road networks based on the perspectives of vulnerability and interdependency. Based on a literature review and the results from workshops and interviews with experts, this study used 11 vulnerable factors in road network failure proposed by Hsieh and Feng (2014). The Taipei Metropolitan road network was used as the empirical case study. The inclusion of disaster mitigation, preparedness, and recovery for determining critical vulnerable factors impacting road network resilience provides an extra level of decision support; however, it also increases the complexity of the issue. Moreover, interdependence analysis was performed to help decision makers understand how vulnerable factors affect system resilience and subsequently adopt appropriate strategies for disaster prevention, preparedness, and mitigation. The causal impact matrix is helpful for determining which infrastructures to protect superiorly.
In addition to underestimating the vulnerability of road networks caused by neglecting causality, a failure to consider resilience misleads resource allocation for reducing road network vulnerability. An impact matrix in the sensitivity model was used to determine the interdependence between infrastructures and identify critical resilience factors. The analytical results show that the LOS of adjacent links and connectivity, as well as the inaccessibility of hospital emergency facilities are critical vulnerable factors influencing road network resilience. The proposed method can assist planners in understanding the assessment tools of road network resilience and help decision makers prioritize resource allocation to improve road network serviceability during hazards. However, the delay time on the shortest substitution, which is considered a significant vulnerable factor because of the weight of participant consensus, is located in the buffering region rather than in critical quadrant. This results in different road network vulnerability in relation to spatial-functional interdependence.
Creating redundant substitutive links to increase network resilience and investing in hospital emergency facilities to maintain functioning, emerging health care systems are recommended strategies for improving the connectivity of the metropolitan road network. The impact causality alterations are re-examined based on a developed scenario, wherein the coping capacity of each link is strengthened to resist negative impacts of hazards and hospital emergency facilities are densely spread throughout. Because of the protection and
14
redundant construction of critical infrastructures, the Taipei Metropolitan road network becomes more resilient. Accordingly, determining the appropriate fragile factors of preparedness and recovery assists decision makers in achieving a suitable level of resilience for metropolitan road networks for budget and service constraints.
Future research should consider the criteria of each road network for physical vulnerability, validate the performance with actual data, and enhance the weighting mechanism to reduce subjectivity in the assessments. Moreover, road network resilience is crucial for economic production and personal well-being, which is absent from this study. Future disaster management studies on metropolitan road networks should also develop a framework for overlapping specific hazard scenarios with the developed road network vulnerability map to construct risk maps and calculate road network serviceability. Considerations of the explicit estimation of transportation as a direct and indirect input to the economy and an evaluation of resilience in broader contexts enable the allocation of resources to promote transportation system resilience, compared to other disaster mitigation strategies in a risk management framework.
References
Adachi T, Ellingwood B R, (2008), “Serviceability of earthquake-damaged water systems: effects of electrical power availability and power backup systems on system vulnerability” Reliability Engineering and System Safety 93(1) 78–88
Adger, W.N. (2006), “Vulnerability,” Global Environmental Change, 16(3), 268–281.
Aguilar, J. (2005) “A survey about fuzzy cognitive maps papers.” International Journal of Computational Cognition 3(2): 27-33.
Alberts, H.C., R.M. Alberts, M.F. Bloom, A.D. LaFlamme, and S. Teerikangas. (2004) “The three Gorges dam project from a systems viewpoint.” System Research and Behavioral Science 21(6), 585-602.
Apostolakis G. E. and Lemon, D. M. (2005), “A screening methodology for the identification and ranking of infrastructure vulnerabilities due to terrorism,” Risk Analysis, 25(2), 361–376.
Bana e Costa C A, Oliveira C S, Vieira V, 2008, “Prioritization of bridges and tunnels in earthquake risk mitigation using multicriteria decision analysis: application to Lisbon” Omega 36(3), 442–450
Bercht A L, Wehrhahn R, (2010) “A psychological–geographical approach to vulnerability: the example of a Chinese urban development project from the perspective of the transactional stress model” Environment and Planning A 42(7) 1705–1722
Berkes, F. (2007). “Understanding uncertainty and reducing vulnerability: lessons from resilience thinking.” Natural Hazards 41(2), 285–295.
Büyüközkan, G., O. Feyzioglu, and Z. Vardaloglu. (2009) “Analyzing CPFR supporting factors with fuzzy cognitive map approach.” World Academy of Science, Engineering and Technology 55: 416-421.
Carbonara, N. and B. Scozzi. (2006) “Cognitive maps to analyze new product development processes: a case study.” Technovation 26(11), 1233-1243.
Carvalho, H., Barroso, A.P., Machado, V.H., Azevedo, S. and Cruz-Machado, V. (2012) “Supply chain redesign for resilience using simulation.” Computers & Industrial Engineering 62(1), 329-341.
Chambers R, 2006, “Vulnerability, coping and policy,” IDS Bulletin 37(4), 33–40
15
the application of the sensitivity model (SM).” Journal of Environmental Management 72(3), 133-147. Chen B Y, Lam W H K, Sumalee A, Li Q, Li Z-C, 2012, “Vulnerability analysis for large-scale and congested
road networks with demand uncertainty” Transportation Research Part A: Policy and Practice 46(3), 501–516
Cimellaro, G.P., Reinhorn, A.M. and Bruneau, M. (2010) “Framework for analytical quantification of disaster resilience.” Engineering Structures 32(11), 3639-3649.
Clark, W.C., Jaeger, J., Corell, R., Kasperson, R., McCarthy, J.J., Cash, D., Cohen, S.J., Desanker, P., Dickson, N.M., Epstein, P., Guston, D.H., Hall, J.M., Jaeger, C., Janetos, A., Leary, N., Levy, M.A., Luers, A., MacCracken, M., Melillo, J., Moss, R., Nigg, J.M., Parry, M.L., Parson, E.A., Ribot, J.C., Schellnhuber, H.J., Schrag, D.P., Seielstad, G.A., Shea, E., Vogel, C., and Wilbanks, T.J. (2000), Assessing vulnerability to global environmental risks, Environment and Natural Resources Program, Belfer Center for Science and International Affairs (BCSIA), Kennedy School of Government, Harvard University, Cambridge, MA.
Cox A, Prager F., Rose A (2011), “Transportation security and the role of resilience: a foundation for operational metrics” Transport Policy 18(2), 307-317
Cutter, S.L., B.J. Boruff, and W.L. Shirley. (2003). “Social vulnerability to environmental hazards.” Social Science Quarterly 84(2), 242-261.
de Andrade, M.M.N., C.F. Szlafsztein, P.W.M. Souza-Filho, A.d.R. Araújo, and M.K.T. Gomes. (2010) “A socioeconomic and natural vulnerability index for oil spills in an Amazonian harbor: a case study using GIS and remote sensing.” Journal of Environmental Management 91(10): 1972-1980.
Dekker, S. Hollnagel, E., Woods, D., and Cook, R. (2008) Resilience engineering: new directions for measuring and maintaining safety in complex systems, Final report, Lund University, Sweden.
Department of Homeland Security (DHS) (2006) National Infrastructure Protection Program
http://www.dhs.gov/xprevprot/programs/editorial_0827.shtm#0
Deutsche Gesellschaft für Technische Zusammenarbeit (GTZ) (2004) Guidelines: Risk Analysis – a Basis for Disaster Risk Management, Eschborn: GTZ.
Eden, C. and Ackermann, F. (2004) “Cognitive mapping expert views for policy analysis in the public sector,” European Journal of Operational Research, 152(3), 615–30.
Ekern, D. and Crossett, J. (2010) “Roles and implications of transportation systems in homeland security.” In: Voeller, J.G. (Ed.), Handbook of Science and Technology for Homeland Security. Wiley, Hoboken, New Jersey.
Feng, C.M. and C.H. Hsieh. (2009) “Effect of resource allocation policies for urban transport diversity.” Computer-Aided Civil & Infrastructure Engineering 24(7): 525-533.
Ford J D, Smit B, (2004) “A framework for assessing the vulnerability of communities in the Canadian Arctic to risks associated with climate change” Arctic 57(4), 389–400
Georgopoulos, V.C., G.A. Malandraki, and C.D. Stylios. (2003) “A fuzzy cognitive map approach to differential diagnosis of specific language impairment.” Artificial Intelligence in Medicine 29(3), 261-278.
Hsieh, C.H. and Feng, C.M. (2014). “Road network vulnerability assessment based on fragile factor interdependencies in spatial-functional perspectives.” Environment and Planning A (forthcoming).
16
perspective.” Journal of the Eastern Asia Society for Transportation Studies 9, 1-15.
Jenelius, E. (2009) “Network structure and travel patterns: explaining the geographical disparities of road network vulnerability.” Journal of Transport Geography 17(3), 234-244.
Jenelius, E., Petersen, T. and Mattsson, L-G. (2006) “Importance and exposure in road network vulnerability analysis.” Transportation Research Part A 40(7), 537-560.
Kwahk, K.Y. and Y.G. Kim. (1999) “Supporting business process redesign using cognitive maps.” Decision Support Systems 25(2), 155-178.
Lee, Z.W., D.N. Ford, and N. Joglekar. (2007). “Effects of resource allocation policies for reducing project durations: a systems modeling approach.” Systems Research and Behavioral Science 24(6), 551-566. Levine J, Garb Y, (2002) “Congestion pricing conditional promise: promotion of accessibility or mobility?”
Transport Policy 9(3) 178–188
Levinson D, (2003) “Perspectives on efficiency in transportation” International Journal of Transport Management 1(3), 145–155
Lu J C, Chen Y M, Chang C H, Kuo Y L, (2010) “Evaluation of inundation risk under climate and environmental changes – An analytical framework for township level evaluation in Taiwan”, paper presented at the Annul Workshop on Research of Disaster Reduction Program for Enhancing Innovation and Implementation of Disaster Reduction, 5 May, http://www.ncdr.nat.gov.tw/conf98/seaaion.html (in Chinese).
McGill, B.J. (2010) “Matters of scale.” Science 328(5978), 575–576.
McDaniels T, Chang S, Peterson K, Mikawoz J, Reed D, (2007), “Empirical framework for characterizing infrastructure failure interdependencies” Journal of Infrastructure Systems 13(3) 175–184
Messner F and Meyer V, (2005) “Flood damage, vulnerability and risk perception – Challenges for flood damage research”, Umweltforschungszentrum Leipzig– Halle, http://www.fokus-umwelt.ufz.de/data/Disk_ Papiere_2005-132647.pdf
Meyer, M.D. (2010) “Transportation system as a security challenge.” In: Voeller, J.G. (Ed.), Handbook of Science and Technology for Homeland Security. Wiley, Hoboken, New Jersey.
Miller-Hooks E, Zhang X, Faturechi R (2012) “Measuring and maximizing resilience of freight transportation networks” Computers & Operations Research 39(7), 1633–1643
Nemeth, C.P. (2008) "Resilience engineering: the birth of a notion." In E. Hollnagel, C. Nemeth, and S. Dekker (Eds.), Resilience engineering perspectives, volume 1: remaining sensitive to the possibility of failure (pp. 3-9). Ashgate, England.
Nguyen, L.D. and S.O. Ogunlana. (2005). “Modeling the dynamics of an infrastructure project.” Computer-Aided Civil and Infrastructure Engineering 20(4): 265-279.
O’Brien K L, Leichenko R, Kelkarc U, Venemad H, Aandahl G, Tompkins H, Javed A, Bhadwal S, Barg S, Nygaard L, West J, (2004) “Mapping vulnerability to multiple stressors: climate change and globalization in India” Global Environmental Change 14(4), 303–313
Posner, R.A. (2004) Catastrophe: Risk and Response. Oxford University Press, New York.
Prager, F., Beeler Asay, G.R., Lee, B. and von Winterfeldt, D. (2011) “Exploring reductions in London Underground passenger journeys following the July 2005 bombings.” Risk Analysis 31(5), 773-786. Rose, A. (2007) “Economic resilience to natural and man-made disasters: multi-disciplinary origins and
17
Rygel L, O’Sullivan D and Yarnal B (2006) “A method for constructing a social vulnerability index: an application to hurricane storm surges in a developed country.” Mitigation and Adaptation Strategies for Global Change 11(3) 741–764
Schmidt-Thomé, P., S. Greiving, H. Kallio, M. Fleischhauer, and J. Jarva. (2006) “Economic risk maps of floods and earthquakes for European regions.” Quaternary International 150(1), 103-112.
Scott D M, Novak D C, Aultman-Hall L, Guo F, (2006) “Network robustness index: a new method for identifying critical links and evaluating the performance of transportation networks” Journal of Transport Geography 14(3), 215–227
Slovic, P. (2007) Risk Perception. Earthscan, London.
Stylios, C.D. and P.P. Groumpos. (2000) “Fuzzy cognitive naps in modeling supervisory control systems.” Journal of Intelligent and Fuzzy Systems 8(1): 83-98.
Tamvakis, P. and Xenidis, Y. (2012) “Resilience in transportation systems.” Procedia – Social and Behavioral Sciences 48, pp. 3441-3450.
Taylor, M.A.P., Sekhar, S.V.C. and D’Este, G.M. (2006) “Application of accessibility based methods for vulnerability analysis of strategic road networks.” Networks and Spatial Economics 6(3-4), 267-291. Transportation Demand Management Encyclopedia (2010) Evaluating transportation resilience: Evaluating
the transportation system's ability to accommodate diverse, variable, and unexpected demands with minimal risk. Victoria Transport Policy Institute.
Turner II B L, (2010), “Vulnerability and resilience: coalescing or paralleling approaches for sustainability science?” Global Environmental Change 20(4), 570–576
Turner II, B.L., Kasperson, R.E., Matson, P.A., McCarthy, J.J., Corell, R.W., Christensen, L., Eckley, N., Kasperson, J.X., Luers, A., Martello, M. L., Polsky, C., Pulsipher, A. and Schiller, A. (2003), “A framework for vulnerability analysis in sustainability science,” Proceedings of the National Academy of Sciences of the United States of America, 100(14), 8074–8079.
United Nations, International Strategy for Disaster Reduction (UN/ISDR) (2004), Living with Risk: A Global Review of Disaster Reduction Initiatives, Geneva: United Nations Publication.
United Nations, International Strategy for Disaster Reduction (UN/ISDR) (2005) Hyogo Declaration. United Nations Publication, Geneva.
United Nations, International Strategy for Disaster Reduction (UN/ISDR) (2009) 2009 UNISDR Terminology on Disaster Risk Reduction. United Nations Publication, Geneva.
Vester, F and A. von Hesler (1982) Sensitivity Model. Frankfurt: Umlandverband Frankfurt am Main.
Wang, S. H., Huang, S. L. and Budd, W. W. (2012) “Resilience analysis of the interaction between typhoons and land use change.” Landscape and Urban Planning, 106(4), 303-315.
Wang, X.D., Zhong, X.H., Liu, S.Z., Liu, J.G., Wang, Z.Y. and Li, M.H. (2008), “Regional assessment of environmental vulnerability in the Tibetan Plateau: development and application of a new method.” Journal of Arid Environments, 72(10), 1929–1939.
Wolf J, Adger W N, Lorenzoni I (2010), “Heat waves and cold spells: an analysis of policy response and perceptions of vulnerable populations in the UK” Environment and Planning A 42(11), 2721–2734
Zhuo, H., Wang, J., Wan, J., Jia, H. (2010). “Resilience to natural hazards: a geographic perspective.” Natural Hazards 53(1), 21–41.
18
Appendix
Table A-1 Raw vulnerability of each link in the Taipei Metropolitan road network
Link code
Fragile factors and weights
(1) (2) (3) (4) (5) (6) (7) (8) (9) (10) (11) 0.126 0.087 0.096 0.025 0.041 0.019 0.082 0.271 0.079 0.053 0.121 1 3 4 1 1 2 1 3 1 0 1 2 2 4 2 2 1 3 1 2 0 0 1 1 3 2 4 3 2 1 1 2 2 0 1 3 4 3 3 2 1 3 0 4 3 3 3 4 5 2 1 1 1 0 2 3 2 1 3 1 6 2 3 2 2 2 1 3 1 2 3 2 7 2 3 3 3 1 1 2 2 1 2 2 8 2 1 3 3 1 1 2 3 2 3 2 9 2 2 2 2 3 2 2 3 1 1 3 10 2 3 2 2 0 2 3 2 3 3 1 11 2 1 3 3 2 1 3 0 2 2 2 12 1 1 3 3 1 1 2 0 1 2 1 13 2 2 4 4 1 1 2 1 0 0 0 14 2 1 4 4 1 1 2 2 1 2 1 15 2 2 4 4 3 2 2 3 2 3 1 16 3 1 2 2 1 3 2 4 1 2 3 17 2 2 3 3 1 3 2 3 4 4 3 18 4 3 2 2 3 2 2 3 4 4 4 19 1 2 2 2 1 1 2 4 4 4 4 20 1 2 3 3 1 1 2 4 3 3 4 21 2 0 3 3 2 1 2 3 2 4 2 22 4 1 1 1 3 0 4 4 4 2 4 23 1 1 2 2 2 0 4 3 3 1 4 24 1 2 2 2 1 3 3 0 1 3 1 25 2 3 3 3 1 4 2 1 2 1 0 26 1 2 4 4 2 2 2 1 0 1 2 27 2 1 4 4 3 4 2 2 0 3 4 28 1 2 4 4 4 3 2 1 1 2 3 29 2 2 4 4 3 4 2 1 0 0 0 30 2 1 4 4 3 3 2 2 2 4 3 31 2 2 4 4 3 3 2 1 0 0 1 32 2 1 3 3 3 2 2 2 1 3 2 33 2 2 3 3 1 2 2 3 1 2 1 34 3 2 2 2 2 1 3 2 2 3 3 35 1 1 1 1 1 4 2 1 1 3 2 36 3 2 2 2 1 4 2 1 4 3 2 37 1 2 4 4 1 4 2 2 2 2 3 38 1 2 4 4 3 4 2 3 2 1 2 39 2 1 4 4 3 4 2 0 1 2 1 40 2 2 4 4 2 3 2 2 2 2 4 41 2 2 4 4 2 3 2 1 1 1 2 42 1 2 3 3 3 3 2 3 2 3 2 43 2 3 2 2 3 3 2 3 1 3 4 44 2 4 3 3 1 2 2 1 1 2 4 45 2 2 2 2 1 2 2 3 3 2 2
19 Link code
Fragile factors and weights
(1) (2) (3) (4) (5) (6) (7) (8) (9) (10) (11) 0.126 0.087 0.096 0.025 0.041 0.019 0.082 0.271 0.079 0.053 0.121 46 2 0 1 1 1 2 2 3 4 2 1 47 2 1 1 1 1 2 2 3 3 4 2 48 2 2 3 2 3 4 2 2 2 3 2 49 1 1 3 3 3 4 2 3 1 4 3 50 3 4 2 2 3 4 2 4 2 2 2 51 2 3 2 2 3 4 2 3 4 3 3 52 3 4 2 2 2 3 2 2 3 2 1 53 1 3 3 3 2 3 2 2 2 3 2 54 1 3 2 2 3 3 2 3 3 4 3 55 3 2 1 1 4 3 2 4 4 4 3 56 1 1 2 2 1 2 3 4 4 3 2 57 2 1 3 3 4 3 2 4 4 4 4 58 2 1 3 3 3 2 3 3 3 4 2 59 4 2 2 2 1 2 3 4 3 3 2 60 4 2 3 1 3 1 4 4 4 4 3
20
國科會補助專題研究計畫成果報告自評表
請就研究內容與原計畫相符程度、達成預期目標情況、研究成果之學術或應用價
值(簡要敘述成果所代表之意義、價值、影響或進一步發展之可能性)
、是否適
合在學術期刊發表或申請專利、主要發現或其他有關價值等,作一綜合評估。
1. 請就研究內容與原計畫相符程度、達成預期目標情況作一綜合評估
達成目標
□ 未達成目標(請說明,以 100 字為限)
□ 實驗失敗
□ 因故實驗中斷
□ 其他原因
說明:
2. 研究成果在學術期刊發表或申請專利等情形:
論文:
已發表
未發表之文稿 □撰寫中 □無
專利:□已獲得 □申請中 無
技轉:□已技轉 □洽談中 無
其他:(以 100 字為限)
Hsieh, C.H. and Feng, C.M. (forthcoming on Feb. 2014). “Road network vulnerability
assessment based on fragile factor interdependencies in spatial-functional perspectives.”
Environment and Planning A (SSCI, 2012 IF=1.630, Rank: 22/72 in Geography).
Hsieh, C.H. and Feng, C.M. (under review). “Resilience of road networks in Taiwan based on vulnerability analyses.” Transport Policy (SSCI).
謝承憲、馮正民、柯旻嬋 (第二次修正),「建構都會區路網脆弱度評量模式」,運輸學刊。(TSSCI)
3. 請依學術成就、技術創新、社會影響等方面,評估研究成果之學術或應用價
值(簡要敘述成果所代表之意義、價值、影響或進一步發展之可能性)(以
500 字為限)
本研究內容與原計畫相符,主要係回顧脆弱度定義及衡量之相關文獻,並進行運輸路網脆 弱度之界定,進而彙整出評估路網脆弱度所應分析之重要因素,並探究其影響以及可能因 應之情況,且根據前述重要結論,構建路網脆弱度與回復力評估之概念架構。並探討系統 中各路段與脆弱度因子間之因果關係。以系統動態學、模糊認知圖及感受性模型等系統方 法進行系統模擬,以界定路網脆弱度因子間之相依性,並將藉由情境分析、敏感度分析及 政策模擬,評估運輸資源配置對於路網脆弱度與回復力之影響。有助於釐清路網脆弱度與 回復力分析架構與工具外,並供決策者利用脆弱度衝擊強度以分析各道路單元之脆弱度, 據而研擬改善策略並決定資源配置之程序,優先防護高脆弱之關鍵設施,最終降低災害風 險。本研究已達成預期之目標,相關成果除發表於 INFORMS、香港運輸年會及日本 Annual Asian Conference on Sustainability, Energy, and the Environment 等國際研討會外,並獲 Environment and Planning A (SSCI 期刊) 接受付印中,另有二篇期刊論文修正審查中。21 國科會補助專題研究計畫項下出席國際學術會議心得報告 日期: 102 年 6 月 15 日 計畫編號 NSC 99-2410-H-009-062-MY3 計畫名稱 公路路網之脆弱度、回復力及減輕對策之資源配置 出國人員 姓名 馮正民 服務機構及 職稱 交通大學交通運輸研究所教授 會議時間 102 年 6 月 6 日 至 102 年 6 月 9 日 會議地點 日本大阪 會議名稱 (中文)2013 ACSEE(亞洲永續、能源與環境)國際會議
(英文)2013 ACSEE International Conference 發表論文
題目
(中文) 改善都會道路網脆弱度之關鍵恢復力因素
(英文) Critical Resilience Factors Improving Vulnerability of Metropolitan Road Networks
一、參加會議經過 參與國家與人數: 據大會報告,參與國家主要來自歐洲、美洲、亞洲等各國,參與人數達 300 人。 (一)會議議程與主題
1.
6 月 6 日主要的會議活動:下午註冊2.
6 月 7 日主要的會議主題9:00-12:00 Welcome, Keynote and Featured Speaker Session (1) Welcome & Introductory Address
(2) ACSS/ACSEE Keynoted Speaker: Eric Uslaner (3) ACSS/ACSEE Featured Speaker: Thomas W Simon (4) Taiko Drum Performance: Bati-holic
(5) Governance and Sustainability Spotlight Presentation and Discussion (6) Parallel Session 1
(7) Parallel Session 2
3.
6 月 8 日主要的會議主題(1) Parallel Session 1 (2) Parallel Session 2
22 (3) ACSS/ACSEE Spotlight Speaker Session (4) Parallel Session 3 (5) Parallel Session 4
4.
6 月 9 日主要的會議主題 (1) Parallel Session 1 (2) Parallel Session 2 (3) Parallel Session 3 (4) Parallel Session 4(5) ACSS/ACSEE 2013 Closing Session
(6) ACSS/ACSEE Conference Closing: Jerry Platt
本次 ACSEE 之會議主題除了在永續(sustainability)方面的議題外,在能源(energy)與環境 (environment)方面也有很多之論文發表,表示能源與環境分析已成未來重視的課題。
(二)本人主持及論文報告之場次
本人論文報告之場次為 6 月 9 日 Interdisciplinary 之場次,主要為 Sustainable Development in Transportation 論文。本人除了擔任該場次之主持人外,也發表論文,報告主題為 Critical Resilience Factors Improving Vulnerability of Metropolitan Road Networks。
二、與會心得 1. 參加此次在日本大阪舉辦的第三屆 ACSEE 國際會議,發現大陸與東南亞的年輕學者參加國際 會議的人數增加很多,相對台灣的學者參與度逐年降低。此點令人擔憂,未來希望鼓勵年輕 學者參與國際會議,增加國際的曝光率。 2. 此次 ACSEE 大會於 6 月 7 日及 6 月 8 日兩天之早上與下午,分別邀請國際知名的學者或專家 給予專題演講,獲得很大的迴響。 三、發表論文大會接受函及論文摘要 (一)論文摘要:
Critical Resilience Factors Improving Vulnerability of Metropolitan Road Networks
Abstract: Global climatic changes have recently led to frequent occurrences and bigger magnitude of natural hazards in Taiwan, causing remarkable losses in mortality, injury as well as property. Disruptions to critical infrastructure, including transportation systems, electric power suppliers, and health care systems, impair the23
ability to ensure sustainable daily operations and incur failures in other systems. Along with resource allocation and pre-evacuation, road networks significantly impact disaster response and recovery, particularly emergent disaster logistics and islanding rescues. This study thus examines the resilience of road network failures from the perspective of vulnerability considering spatial-functional interdependency among fragile factors. Based on eleven vulnerable factors developed in the literature, road network vulnerability is determined by systematic approaches and illustrated through geographic information systems. Analytical results demonstrate that vulnerable factors playing a critical role in the sensitivity model, such as the level of service on adjacent links, connectivity, and accessibility to hospital emergency facilities significantly impact the resilience of metropolitan road networks. The strategies to protect the critical fragile factors mitigate the road network operations from strongly vulnerable to medial level. The method developed in this study can assist planners in understanding the assessment tools of road network resilience and help decision makers prioritize resource allocation to improve road network serviceability under hazardous conditions.
Keywords: Road network vulnerability, interdependency, resilience, geographic information system (GIS)
24 國科會補助專題研究計畫項下出席國際學術會議心得報告 日期: 102 年 10 月 18 日 計畫編號 NSC 99-2410-H-009-062-MY3 計畫名稱 公路路網之脆弱度、回復力及減輕對策之資源配置 出國人員 姓名 馮正民 服務機構及 職稱 交通大學交通運輸與物流管理 學系教授 會議時間 102 年 9 月 2 日 至 102 年 9 月 7 日 會議地點 大陸貴州市 會議名稱 (中文)第十二屆海峽兩岸城市發展研討會
(英文)Conference of Urban Development
主持場次 (中文)土地利用、模式探索與民居建築
(英文)Land Use, Model Analysis and Living Building 一、參加會議經過 (一) 會議議程與主題 9 月 3 日主要的會議主題為「生態文明、城鄉統籌」 1. 研討議程(一):區域開發、新型城鎮化與城鄉統籌發展 (1) 跨域治理與城鄉統籌發展 (2) 生態文化與生態城市 (3) 台灣農村再生政策與計畫的演進與推動 2. 研討議程(二):生態建設、轉型發展與戰略導引 (1) 台北市生態城市發展策略 (2) 整合與創新性思考-貴州省示範小城鎮風貌規劃指引研究 (3) 建立生態文明體制-以台灣濕地保育法立法過程為例 (4) 西部生態文明建設存在的問題及戰略取向 3. 研討議程(三):空間演變、應對氣候變化與智慧規劃 (1) 高山丘陵地區因應氣候變遷之治理模式:以嘉義縣為例 (2) 從 “極核” 走向 “均衡” –以智慧城市建設助力特色新型城鎮化之夢 (3) 綠色旅遊智慧規劃 (4) 轉型期中國大陸大城市空間演變的形式與特徵 4. 研討議程(四):土地利用、模式探索與民居建築
25 (1) 調洪式土地使用規劃架構之研究 (2) 雲南省山地城鎮空間組織中的生態模式探索 (3) 台灣東部人才遷移鼓勵策略與智慧城鄉發展的新思維 (4) 貴州民居建築特色解析及應用 本次會議主題除了在都市發展面的議題外,在生態低碳方面也有許多討論,表示綠色低碳分析 已成未來重視的課題。 (二) 本人主持之場次 本人主持之場次為土地利用、模式探索與民居建築,其中報告的論文有: (1) 調洪式土地使用規劃架構之研究 (2) 雲南省山地城鎮空間組織中的生態模式探索 (3) 台灣東部人才遷移鼓勵策略與智慧城鄉發展的新思維 (4) 貴州民居建築特色解析及應用 二、 與會心得 參加此次大陸城市科學學會舉辦的兩岸城市發展研討會,發現大陸的年輕學者與專家的簡 報技術與內容進步很多,相對台灣的學者專家參與年齡層相對較高,此點令人擔憂。未來 希望鼓勵年輕學者參與此類學術專業會議,增加學術與專業的曝光率。 三、 考察參觀活動 (一) 9 月 4 日參訪苗族博物館及座談 參訪西江千戶苗寨及苗家博物館,在討論中,大家覺得貴州雖然保留了苗寨文化,值得學 習,但其中夾雜了一些現代的商業活動與商業設施,卻破壞了原有的風貌,其為美中不足 之處。 (二) 9 月 5 日參訪歷史文化名城及座談 參訪舞陽國家級風景區,及體驗中國歷史文化古城鎮遠古城風貌,沿岸為客斯特地形,頗 為特殊。在討論中,大家覺得其雖具有古城特色,唯國際觀光客較少,原因是交通不便, 且欠缺國際行銷與解釋。 (三) 9 月 6 日參訪遵義市容及新農村建設座談 參訪黔北民居及新農村建設,其為政府補助農民的新農村建設,建築型態類似。在討論中, 大家覺得太過樣板。
26 四、 建議 1. 未來應多鼓勵年輕專家學者參加 2. 未來應藉著領岸學術會議,增加兩岸學術的交流 五、 攜回資料名稱及內容 兩岸城市發展學術研討會論文集