www.elsevier.com / locate / chroma
O
n-line concentration of trace proteins by pH junctions in capillary
electrophoresis with UV absorption detection
*
Shang-Ji Wang, Wei-Lung Tseng, Yang-Wei Lin, Huan-Tsung Chang
Department of Chemistry, National Taiwan University, Taipei, Taiwan
Abstract
We report an on-line concentration approach based on pH junctions for the analysis of trace proteins under acidic conditions by capillary electrophoresis (CE) with UV absorption detection. Stacking is due to decreases in the electrophoretic mobilities of proteins when migrating from the sample zone to a relatively high-pH buffer filled in the capillary. Acidic buffers prepared from tris(hydroxymethyl)aminomethane (co-ions) and propanoic acid were suitable. With respect to speed, resolution, and stacking efficiency, it is appropriate to conduct the analysis of proteins under discontinuous conditions: pH 3.8 (inside the capillary), 2.8 (protein samples), and 3.3 (anodic reservoir). To minimize protein adsorption on the capillary wall, capillaries dynamically coated with single, double, and triple layers of polymers have been made and tested. Capillaries dynamically coated with three layers of neutral, cationic and neutral polymers in sequence were used to separate four proteins with good reproducibility. When using a 60-cm capillary, the peak height increased linearly with the injection volume up to 1.42-ml and peak profiles were sharp, indicating stacking of proteins. As a result, the limits of detection for lysozyme, myoglobin, carbonic anhydrase, and a-lactalbumin were 1.9, 3.2, 11.3 and 6.5 nM, respectively. Furthermore, this method has been applied to the analysis of about 1.31 and 0.66 ml of 5.00 and 0.20 mM peptic and tryptic digests of
b-casein, with results of detecting 26 and 12 peaks in 21 and 14 min, respectively.
2002 Elsevier Science B.V. All rights reserved.
Keywords: Sample stacking; Coated capillaries; Proteins; Poly(ethylene oxide)
1
. Introduction suffers from low concentration sensitivity because of
a shorter optical path length, usually 50–100 mm, Capillary electrophoresis (CE) is processing to- and a small injection volume (several nanoliters) [3]. ward maturity and becomes one of the most powerful To make CE more attractive, a number of sensitive analytical techniques [1]. For many years, many detection techniques such as electrochemical meth-methods and instrumentation in CE have been de- ods, fluorescence, and mass spectrometry (MS) have veloped and applied to analysis of a wide range of been developed and tested with varying degrees of solutes, including small neutral molecules and ions, success [4,5]. However, they are either more proteins, DNA and so on [2]. Although CE provides sophisticated, expensive, selective, or not easily advantages over high-performance liquid chromatog- adapted to automation when compared with absorp-raphy, including rapidity, high-resolving power, and tion detection.
small amounts of samples and reagents required, it To make CE as a more practical and powerful tool for trace analysis of proteins using absorption tection, developing concentration techniques is
de-*Corresponding author. Tel.: / fax: 1886-2-2362-1963.
E-mail address: [email protected](H.T. Chang). manded. For example, analysis of proteins, such as
0021-9673 / 02 / $ – see front matter 2002 Elsevier Science B.V. All rights reserved. P I I : S 0 0 2 1 - 9 6 7 3 ( 0 2 ) 0 1 4 3 9 - 5
human serum albumin (HSA) in urine [6], and laries have commonly been used for protein analysis amyloid and b-trace proteins in central nerve fluids, under mild conditions. The capillary wall could be is important from a practical point of view [7]. The either covalently bonded or dynamically modified new techniques should also allow the analysis of with suitable chemicals or polymeric materials, while hundreds of thousands of proteins, with concen- the latter provides the advantages of low cost and trations ranging over six orders of magnitude, from simplicity [21–35]. Common chemicals and materi-biological samples because there is an urgent need to als used for dynamic modification of the capillary identify the patterns of protein expression, which is wall include amines, polycations, zwitterionic surfac-dependent on the stage of development of an organ- tants, PEO, hydroxycellulose derivatives, and linear ism and the organism’s physiological state. Although polyacrylamide [27–33]. To prevent loss of res-CE could not play the role that two-dimensional gel olution due to an incomplete coverage of the capil-electrophoresis combined with mass spectrometry lary wall with materials, multiple dynamic coating does in proteomics [8], it has a large potential for using positively and negatively charged polymers in determining the microheterogeneity of proteins be- between has been proposed [34,35]. Thus formed cause of its high resolving power and rapidity. capillaries also allow switches of the direction of However, time-consuming and costly preconcentra- EOF, depending on the properties of the utmost layer tion of certain proteins is generally carried out prior of polymers. The stability of the capillary is excel-to CE analysis [9]. To circumvent these disadvan- lent because Coulombic interactions take place be-tages, on-line concentration techniques have been tween any two adjacent layers. Adsorption of pro-developed, including isotachophoresis [10,11] and teins with opposed charges to that of the outmost field amplification [12]. The concentration factors of capillary wall through Coulombic interactions could these methods depend on the compositions of the however be a problem.
discontinuous buffer electrolytes. Using membranes The primary goal of this work is to optimize or hollow fibers has also been employed for the resolution, speed, and sensitivity for the analysis of analysis of proteins, with good concentration results, proteins in CE with UV absorption. We developed a but some shortages need to be overcome, including simple on-line concentration method for the analysis difficult automation and limits to certain proteins of proteins using deactivated capillaries. This method [13,14]. Recently, we have developed a technique is based on the fact that the migration of proteins is allowing concentration of proteins and DNA pre- solvent sensitive, depending on pH, ionic strength, pared in either low- or high-conductivity media [15– electrolytes species, and buffer species [36]. We 17]. When DNA fragments or proteins migrating explored the effect of pH junctions and co-ions in the against electroosmotic flow (EOF) enter poly- background electrolytes on the stacking efficiency. (ethylene oxide) (PEO), they slow down and stack at Using this method for peptide mapping was also the boundary between the sample zone and PEO. As demonstrated.
a result, more than 1500-fold sensitivity improve-ments in the protein analysis [16] and the analysis of
up to 5-ml DNA samples have been demonstrated 2 . Materials and methods using laboratory-made CE systems with
laser-in-duced fluorescence [17]. 2 .1. Equipment
Adsorption of proteins on the capillary wall
through Coulombic interactions, hydrogen bonding A commercial electrophoresis instrument from and / or hydrophobic patches leads to poor resolution Bio-Rad (BioFocus CE 2000, Hercules, CA, USA) and irreproducibility. Although using harsh condi- was used. Fused-silica capillaries (Polymicro Tech-tions such as extremely high pH, low pH, or high nologies, Phoenix, AZ, USA) were 35 or 60 cm (360 salts to minimize adsorption has been demonstrated mm O.D.375 mm I.D.) At 4.5 cm from the outlet
[18–20], protein denaturation, poor stacking ef- end, the polyimide coating was burned off to form ficiency, and / or Joule heating are problematic. To the detection window. The absorbance of proteins further overcome these problems, deactivated capil- was determined at 220 nm.
2
.2. Chemicals and then was stopped by adding 0.1 M acetic acid,
pH 4.0, while it was 1 h for peptic digestion. All chemicals for preparing background
elec-trolytes, proteins and PEO were obtained from 2 .3. Coating Sigma (St. Louis, MO, USA). Propanoate (PA)
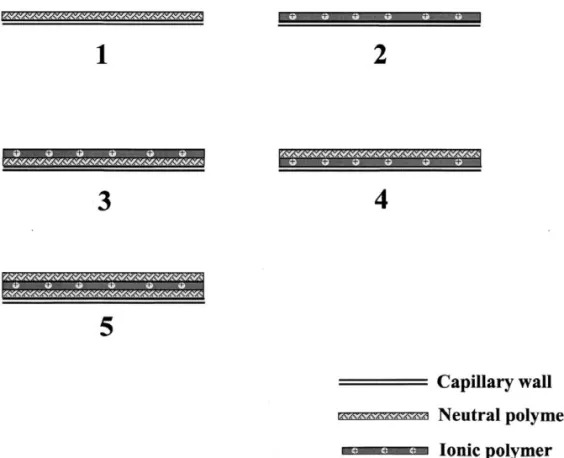
solutions were diluted from 1 M propanoic acid and Before coating, capillaries were rinsed with water adjusted with tris(hydroxymethyl)aminomethane for 30 min. The capillaries were flushed with either a (Tris) or NaOH to suitable pH values. Unless neutral (0.5%) or ionic polymer solution (5%) for otherwise noted, X mM PA solution means that the 15 min, and then equilibrated with the polymers at total concentration of PA and propanoic acid is X ambient overnight. Before processing in coating the mM. Carbonic anhydrase (CA), a-lactalbumin (a- second or third layer of the capillary wall with Lac), myoglobin (Myo), lysozyme (Lys), ribonu- neutral or ionic polymers at room temperature for clease A (Rib), trypsinogen (Try), b-lactoglobulin 10 min, the polymer solution inside the capillary was (b-Lac), and ovalbumin (Ova) were prepared in washed out with water. Fig. 1 shows thus formed water and thus formed solutions were diluted to capillaries that are called SLN, SLI, DLNI, DLIN, suitable concentrations with PA solutions prior to and TLNIN capillaries, wherein SL, DL, TL, N, and analysis. Pepsin and trypsin were separately prepared I mean single layer, double layers, triple layers, in 50 mM NH HCO4 3 buffer, pH 8.0, and in 2% neutral, and ionic, respectively. I and N are arranged formic acid, pH 1.0, which then were mixed with according to coating processes. For example, NIN
b-casein (b-Cas), with a concentration ratio of 20:1. means neutral, ionic, and neutral polymers were used Tryptic digestion was conducted at 37 8C overnight to coat the capillary in sequence.
2
.4. On-line concentration and separation should be the last two. Table 1 shows that the relative standard deviation (RSD) values of the Prior to pressure injection of the samples prepared migration times for the four model proteins were less in PA solution, pH 2.8, at low level, the capillary was than 2.5%, despite using DLNI capillaries. Com-hydrodynamically filled with PA solution (pH.2.8) pared to SLI capillary, the positive charge density on at high level. The separation was conducted after the the wall of DLNI capillary should be greater, be-anode end of the capillary was immersed in a vial cause the ionic polymer did not directly interact with
2
containing PA solution with different pH. Under Si–O . Thus, stronger interactions with low-isoelec-these acidic conditions, proteins carrying positive tric point (low pI ) proteins (a-Lac and CA) should charges migrated toward the cathode end. After each account for high RSD. Our reasoning was supported run, the capillary was re-equilibrated with polymer by a very small EOF toward anode and greater solution used to coat the outmost layer for 10 min migration times. The EOF mobility ( m ) is less thaneo
25 2 21 21
before filling the capillary with PA solution. 1310 cm V s when using a DLNI capillary, 26 which is larger than that (usually smaller than 3?10
2 21 21
cm V s ) of capillaries with neutral polymers at 3
. Results and discussion the utmost layer. In comparison, the analysis of
acidic proteins (low pI ) is reproducible when using 3
.1. Dynamic coating DLIN and TLNIN capillaries. Although SLN and
SLI capillaries provided good reproducibility, a As the primary purpose of this study is to develop relatively broad peak corresponding to CA was a method for performing on-line concentration of problematic. The peaks corresponding to Lys and proteins under acidic conditions, an efforts was made Myo were sharper compared to those of a-Lac and to minimize adsorption of proteins on the capillary CA when using the capillary coated with the cationic wall. Coulombic interaction is one of the most polymer. This result indicated that the interaction important contributors to protein adsorption when the with acidic proteins was slightly stronger when the charge of the outmost capillary wall is opposite to capillary wall was covered with a thin layer of that of proteins. On the other hand, hydrogen bond- polymers. Overall, we have shown that TLNIN ing and hydrophobic patches are dominant when the capillaries provided the best performance in terms of outmost capillary wall is neutral and the charge stability and resolution. The RSD values of the density of proteins is low. We made and tested migration times and peak heights for all proteins capillaries coated with one, two, and three layers of were ,1.8 and ,3.4%, respectively, in day-to-day polymers, with either neutral or ionic polymers at the runs for 3 consecutive days. Furthermore, several utmost layer, including SLN, SLI, DLNI, DLIN, and TLNIN capillaries were tested for more than 100 TLNIN capillaries. At pH,4.0, the ionic polymer is runs without a significant deterioration if washed partially protonated and the four model proteins with with neutral polymer solutions after each run for pI values ranging from 4.7 to 11.0 are all positive. 5 min. For this reason, we chose TLNIN capillaries Thus, the main forces accounted for the interactions for the following studies.
Table 1
Effect of coating procedures on the separation and quantitative reproducibility a
Capillary Migration time (min) (RSD%) Peak height (mAu) (RSD%)
Lys Myo CA a-Lac System peak Lys Myo CA a-Lac
SLN 7.81 (0.82) 8.28 (0.81) 9.65 (0.79) 12.58 (0.89) 12.97 (1.18) 5.42 (3.21) 5.86 (3.09) 3.66 (2.65) 4.79 (3.13) SLI 8.61 (0.64) 9.06 (0.68) 10.32 (0.82) 12.85 (1.33) 13.21 (1.32) 5.62 (2.35) 6.54 (2.43) 3.27 (3.19) 3.91 (2.85) DLNI 8.48 (3.05) 9.04 (3.37) 10.77 (4.03) 14.82 (5.84) 15.86 (6.52) 5.06 (4.35) 7.81 (4.80) 2.54 (5.42) 3.52 (6.12) DLIN 7.96 (2.13) 8.39 (1.73) 9.70 (0.97) 12.15 (0.58) 12.47 (0.89) 5.18 (3.70) 5.18 (2.85) 2.68 (2.64) 3.66 (2.35) TLNIN 7.83 (1.80) 8.31 (1.80) 9.59 (1.63) 12.53 (1.36) 13.24 (1.20) 6.74 (3.40) 8.50 (2.75) 2.78 (2.50) 3.81 (2.95) a
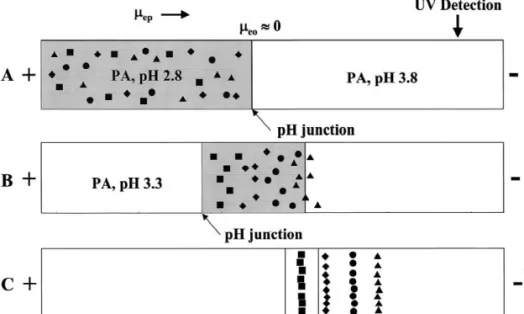
Fig. 2. Evolution of on-line concentration of trace proteins by pH junction. (A) After pressure injection of protein sample; (B) stacking of proteins; and (C) separation of protein based on the charge-to-mass ratio.
3
.2. Stacking anode vial containing 200 mM PA, pH 3.3, during
the separation. A cartoon is given in Fig. 2 to show Based on the changes in the electrophoretic pH junctions in the system. After stacking, the mobility ( m ) of proteins at different pH values, weep analysis was carried out at pH 3.3 for optimum developed an on-line concentration technique based resolution. The use of PA as the background elec-on pH junctielec-on. At pH,4.0, the four model proteins trolyte provides advantages of low Joule heating are positive and migrate toward the cathode end. generated at high electric field strengths and low When migrating from low-pH sample zone to high- absorption background at 220 nm. For example, the pH electrolytes, the net positively charges of proteins current generated at 500 V/ cm was only 8.2 mA decrease. As a result, proteins slow down and stack when the separation was carried out in 200 mM PA at the boundary. To generate discontinuous con- solution, pH 2.8, under isocratic conditions.
ditions (pH junctions) inside the capillary, 200 mM Using a 35-cm capillary, the four proteins injected PA solutions, pH 3.8, and 2.8, were used to fill the at low level for 40 s were still resolved. The capillary and to prepare protein samples, respective- injection length and volume were about 17.2 cm and ly. To make sure that the four proteins carried 760 nl, respectively. Table 2 shows good linearity positive charges, the capillary was placed in an between the peak height and injection volume, with
Table 2
On-line concentration and separation of four model proteins by pH junctions using a 35-cm capillary
Lys Myo CA a-Lac
a
Linear regression y 5 0.023x 2 1.28 y 5 0.029x 2 1.72 y 5 0.004x 2 0.19 y 5 0.015x 2 0.74
2
Linear regression coefficient (R ) 0.996 0.997 0.942 0.992
b
LOD (nM ) (S /N 53) 3.1 5.0 25.2 10.3
b
CF 48 69 40 30
b,c
Migration time (min) (% RSD) 3.63 (0.61) 3.79 (0.58) 4.27 (0.64) 5.27 (0.59) a
y is the peak height (mAU); x is the injection volume (nl).
b
Injection volume was 760 nl. c
2
linear regression coefficients (R ) greater than 0.99 except for CA (0.942), indicating that proteins stacked well. Owing to a relatively broader peak profile for CA mainly due to its microheterogeneity [37], the deviation of linearity was slightly greater. With increasing injection volumes, the migration times shortened since proteins migrated in a greater fraction of low pH zone. For example, the migration times for Lys and a-Lac shortened from 4.74 and 9.69 min to 3.63 and 5.27 min, respectively, when the injecting length was increased from 2.2 to 17.2 cm. Unfortunately, resolution decreased with increas-ing the injection length, with a limit of about 17.2 cm. With a maximum injection (four peaks were still resolved in baseline), the concentration factor (CF) values for the four proteins ranged from 29 to 70, with the limit of detection (LOD) values in the order of several tens nM at a signal-to-noise (S /N ) ratio of 3. Herein CF was used to express the stacking efficiency, which is defined as the LOD obtained by conventional injection (1 s at the low pressure level) to that obtained for longer injection times (e.g. 40 s) at the same pressure level. The LOD is only slightly higher than that obtained using a very expensive argon laser at 275 nm without performing on-line
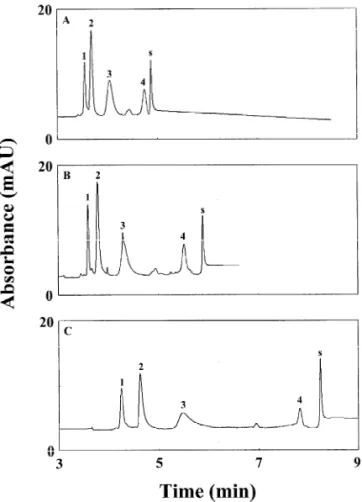
concentration [38]. Although increasing injection Fig. 3. Effect of pH on the separation of the four model proteins at 15 kV. The pH values for PA solutions in the anode reservoirs
volumes is useful to further improve sensitivity, it
and the capillary were 2.8, 3.3, 3.8 and 4.3 in (A), (B), (C) and
generally suffers from poor resolution. To overcome
(D), respectively. Proteins were prepared in 200 mM PA, pH 2.8.
this shortage, a longer capillary was tested. By using
The injection volume was about 0.67 ml. Peaks: 15Lys (0.25
a 60-cm capillary, the injection length was extended mM ); 25Myo (0.5 mM); 35CA (0.5 mM ); 45a-Lac (0.25 mM ); to about 32 cm, which corresponds to 1.42 ml. The s5system peak. The capillary was 35 cm total length (30.5 cm
effective length).
LODs for Lys, Myo, CA, and a-Lac were 1.9, 3.2, 11.3 and 6.5 nM, respectively, and the sensitivity
improvements were about 76, 107, 89 and 47-fold at CA (pI 6.2) and a-Lac (pI 4.7) were not as effective the expense of a longer analysis time ( ,12 min). as that at pH 3.8. Because hydrogen ions migrated much faster than proteins, the proteins close to the 3
.3. pH dependence anode end slowed down before migrating at the
interface in the cathode end, leading to poor stack-To exploit pH effect on stacking, we performed ing. This effect was more profound for the acidic analyses using 200 mM PA solutions, pH 2.8, 3.3, proteins. Regarding the speed and stacking efficiency 3.8 and 4.3, respectively, to fill the capillary and for the acidic proteins, the optimum condition was anode vials. Fig. 3A and B show that there were no pH 3.8. However using a higher pH condition is sharp peaks (a bump) at pH 2.8 or 3.3 when injecting suggested when high resolving power is needed. In about 0.67 ml protein sample, indicating poor stack- comparison with the results shown in Fig. 3C and D, ing because of small differences in pH and con- we concluded that pH did play a significant role in ductivity. The four main peaks were resolved as determining m , thereby affecting stacking ef-ep shown in Fig. 3C and D, while it took 20 min to ficiency, speed and resolution.
0.4 cm) of 30 or 50 mM phosphate solution adjusted acidic conditions. This suggestion was supported by with NaOH to apparent pH 12.0 was applied prior to short migration times for the four proteins when sample injection. Electropherograms depicted in Fig. compared to the result obtained at pH 4.3 (Fig. 3D). 4 show slow separations in the presence of the plugs. Apparently, it is promising for optimum resolution In addition, the migration times increased while the by applying a suitable plug of phosphate solution, stacking efficiency decreased with increasing the with a support from a complete separation of eight concentration of phosphate solution. This is mainly proteins shown in Fig. 5. In the presence of a short due to titration of hydrogen ions with greater con- plug of 50 mM phosphate, the separation of a 1.42 centrations of anions (phosphate and hydroxide ml sample containing eight proteins was complete in
ions). As a result, proteins had less positive charges 23 min. and slowed down gradually before entering the PA in
the cathode end, leading to loss of stacking (not 3 .4. Effect of co-ion shown). Owing to a relatively short length of
phos-phate solution compared to that of the sample plug To test the effect of co-ions, we performed the (about 15.1 cm), proteins should still migrate under analysis of proteins using PA solutions adjusted with Tris or NaOH. When the capillary was filled with PA (adjusted with NaOH), pH 3.3 and placed in PA, pH 3.8 during separation, CA and a-Lac (migration time was 3.9 min) were not resolved from the system peak (result not shown). In addition, the migration times for the four proteins were all shorter in the presence of sodium ions, indicating increases in the m . Thisep shows that the positively charged density of proteins increased upon interacting with sodium ions, which is in good agreement with a reported result [39]. On the other hand, a complete separation of the four proteins was achieved in 7 min in the case of using Tris to adjust the pH. One other advantage of using the solution containing Tris is that the stacking efficiency is greater (2-fold). With a smaller m , Trisep cations acted like a terminating ions in the system and thus affected the stacking efficiency [40]. The fact that the conductivities were different in the two different conditions indicated that the changes in the viscosity should slightly affect the separation results. 3
.5. Peptide mapping
Because the net charges and electrophoretic mobility of proteins are both dependent on ionic strength, the effect of salt on the analysis of peptic and tryptic digests must be explored. The salt impact
Fig. 4. Effect of 0.4-cm phosphate plug prior to sample injection on resolution, speed, and stacking efficiency is
on the separation of proteins. (A) No plug; (B,C) 30 and 50 mM expected to be more profound when injecting large phosphate, apparent pH 12.0, respectively. The anode vial con- volumes of samples (0.76 ml). In the presence of tained 200 mM PA, pH 3.3. Proteins were prepared in 200 mM
1 mM NaCl in the sample containing the four model
PA, pH 2.8. The injection volume was about 1.42 ml. Peaks:
proteins, the changes in the migration time and
15Lys (0.25 mM ); 25Myo (0.5 mM ); 35CA (0.5 mM );
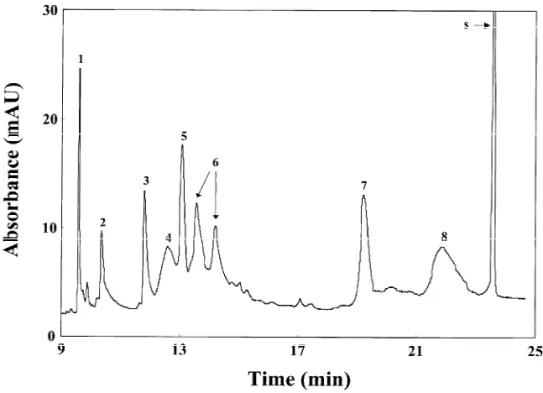
Fig. 5. On-line concentration of eight proteins in the presence of a short plug of 50 mM phosphate solution, apparent pH 12.0, at 20 kV. Peak: 15Lys; 25Myo; 35Rib; 45CA; 55Try; 65b-Lac; 75a-Lac; 85Ova; s5system peak. The concentrations of all proteins were 0.9
mM. The capillary was 60 cm in total length (55.5 cm effective length). Other conditions as in Fig. 4.
the migration time for a-Lac increased to 13.5 min advantage of this proposed method for trace analysis in the presence of 10 mM NaCl, the stacking was of proteins.
still effective supported by sharp peak profiles. In the presence of more than 20 mM NaCl, the analysis
was failed, presumably because of Joule heating and 4 . Conclusions small electrophoretic mobilities of proteins. These
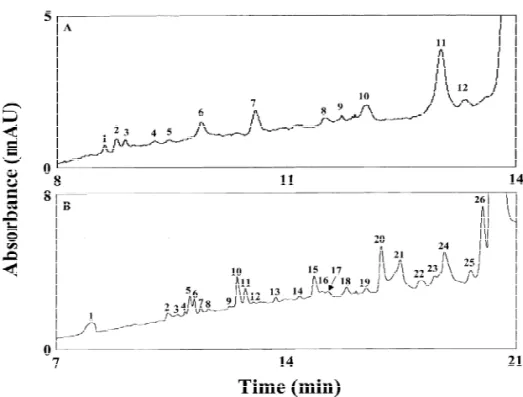
results suggested that matrix effect is significant Capillaries modified with multilayers of adjacent using this proposed method. To minimize the salt polymers with neutral and cationic charges have effect, we separately diluted peptic and tryptic been fabricated and tested for protein analysis, with peptides of b-Cas with 200 mM PA solution, pH 2.8, high resolving power, long lifetime, and reproduci-based on the results shown above. When injecting the bility. Of these capillaries, TLNIN ones are best and digests of b-Cas (0.2 or 5 mM ), 12 and 26 peaks have been used for on-line concentration of proteins were reproducibly detected in 14 and 21 min as under acidic conditions. When migrating from the shown in Fig. 6A and B, respectively. Although sample zone to PA solution (relatively high pH), these peaks were not identified in this work, we proteins slow down and stack. We have found that expect that this would be possible if CE–MS were co-ions (Tris) play a significant role in determining applied; this is not available in this laboratory. stacking efficiency. When using a 60-cm capillary, Because the two b-Cas samples were digested under the injecting volume was up to about 1.42 ml, different environments, the times for the system leading to LOD values for Lys, Myo, CA, and a-Lac peaks (not shown) were different. From a practical of 1.9, 3.2, 11.3 and 6.5 nM, respectively. This result point of view, this is one shortcoming of this demonstrates the suitability of this method for the method. Despite this, the concentration used in this analysis of trace proteins.
study was about 2 orders of magnitude less than that Although salts affect the stacking efficiency, this used in a conventional method [41], showing the method has been used for the analysis of 0.2 mM
Fig. 6. Electropherograms of peptides from b-Cas at 20 kV. Peptic and tryptic digests in (A) and (B), respectively. The anode vial contained 200 mM PA, pH 3.3. Peptides were prepared in 200 mM PA solution, pH 2.8. The injection volumes were about 1.31 and 0.66 ml in (A) and (B), respectively. Peak numbers given in (A) and (B) without identification. Other conditions as in Fig. 5.
[3] E.S. Yeung, Chromatogr. Sci. Ser. 64 (1993) 587.
peptic digest of b-Cas prepared in 200 mM PA
[4] K. Swinney, D.J. Bornhop, Electrophoresis 21 (2000) 1239.
solution, pH 2,8. With good sensitivity,
high-resolv-[5] A. von Brocke, G. Nicholson, E. Bayer, Electrophoresis 22
ing power, simplicity, rapidity, reproducibility, it is (2001) 1251.
our future goal to combine this technique with MS to [6] T. Marshall, K.M. Williams, Electrophoresis 20 (1999) 1307. [7] A. Sickmann, W. Dormeyer, S. Wortelkamp, D. Woitalla, W.
identify trace proteins. In conjunction with
immuno-Kuhn, H.E. Meyer, Electrophoresis 21 (2000) 2721.
assay, this new approach will be applied to the
[8] A. Shevchenko, A. Loboda, A. Shevchenko, W. Ens, K.G.
analysis of important biological markers such as CA Standing, Anal. Chem. 72 (2000) 2132.
in a variety of biological samples. We will also [9] N.J. Clarke, A.J. Tomlinson, G. Schomburg, S. Naylor, Anal.
extend this technique to the analysis of trace proteins Chem. 69 (1997) 2786.
[10] T.J. Thompson, F. Foret, P. Vouros, B.L. Karger, Anal.
labeled with suitable fluorophores using
laser-in-Chem. 65 (1993) 900.
duced fluorescence.
[11] J. Bergmann, U. Jaehde, W. Schunack, Electrophoresis 19 (1998) 305.
[12] Z.K. Shihabi, M. Friedberg, J. Chromatogr. A 807 (1998) 129.
A
cknowledgements
[13] E. Rohde, A.J. Tomlinson, D.H. Johnson, S. Naylor, J. Chromatogr. B 713 (1998) 301.
This work was supported by the National Science [14] R. Zhang, S. Hjerten, Anal. Chem. 69 (1997) 1585.´ Council of Taiwan, Republic of China, under the [15] W.-L. Tseng, M.-M. Hsieh, S.-J. Wang, C.-C. Huang, Y.-C. contract number NSC 90-2113-M-002-052. Lin, P.-L. Chang, H.-T. Chang, J. Chromatogr. A 927 (2001)
179.
[16] W.-L. Tseng, H.-T. Chang, Anal. Chem. 72 (2000) 4805. [17] C.-C. Huang, M.-M. Hsieh, T.-C. Chiu, Y.-C. Lin, H.-T.
R
eferences Chang, Electrophoresis 22 (2001) 4328.
[18] R.M. McCormick, Anal. Chem. 60 (1988) 2322.
[1] H.J. Issaq, Electrophoresis 21 (2000) 1921. [19] M.J. Gordon, K.J. Lee, A.A. Arias, R.N. Zare, Anal. Chem. [2] S.N. Krylov, N.J. Dovichi, Anal. Chem. 72 (2000) 111R. 63 (1991) 69.
[20] H.H. Lauer, D. McManigill, Anal. Chem. 58 (1986) 166. [31] Y. Wang, P.L. Dubin, Anal. Chem. 71 (1999) 3463.
` ´
[21] C. Gelfi, A. Vigano, M. Ripamonti, P.G. Righetti, R. Sebas- [32] E. Cordova, J. Gao, G.M. Whitesides, Anal. Chem. 69 tiano, A. Citterio, Anal. Chem. 73 (2001) 3862. (1997) 1370.
[22] M. Chiari, M. Cretich, F. Damin, L. Ceriotti, R. Consonni, [33] A. Cifuentes, P. Canalejas, J.C. Diez-Masa, J. Chromatogr. A Electrophoresis 21 (2000) 909. 830 (1999) 423.
´
[23] J. Horvath, V. Dolnık, Electrophoresis 22 (2001) 644. [34] H. Katayama, Y. Ishihama, N. Asakawa, Anal. Chem. 70 [24] G. Kleindienst, C.G. Huber, D.T. Gjerde, L. Yengoyan, G.K. (1998) 5272.
Bonn, Electrophoresis 19 (1998) 262. [35] H. Katayama, Y. Ishihama, N. Asakawa, Anal. Chem. 70 [25] M.A. Strege, A.L. Lagu, J. Chromatogr. 630 (1992) 337. (1998) 2254.
[26] K. Srinivasan, C. Pohl, N. Avdalovic, Anal. Chem. 69 [36] M.K. Menon, A.L. Zydney, Anal. Chem. 70 (1998) 1581. (1997) 2798. [37] S. Lindskog, Pharmacol. Ther. 74 (1997) 1.
[27] B. Verzola, C. Gelfi, P.G. Righetti, J. Chromatogr. A 874 [38] T.T. Lee, E.S. Yeung, J. Chromatogr. 595 (1992) 319. (2000) 293. [39] R.A. Curtis, J.M. Prausnitz, H.W. Blanch, Biotechnol. [28] R. Sebastiano, C. Gelfi, P.G. Righetti, A. Citterio, J. Chroma- Bioeng. 57 (1998) 11.
`
togr. A 894 (2000) 53. [40] J.L. Beckers, P. Boeek, Electrophoresis 21 (2000) 2747. [29] B. Verzola, C. Gelfi, P.G. Righetti, J. Chromatogr. A 868 [41] E. Bonneil, M. Mercier, K.C. Waldron, Anal. Chim. Acta 404
(2000) 85. (2000) 29.