Infrared brazing of Ti–6Al–4V and 17-4 PH stainless
steel with (Ni)/Cr barrier layer(s)
R.K. Shiue, S.K. Wu
∗, J.Y. Shiue
Department of Materials Science and Engineering, National Taiwan University, Taipei 106, Taiwan Received 24 July 2007; received in revised form 31 October 2007; accepted 31 October 2007
Abstract
Ti–6Al–4V and 17-4PH stainless steel (17-4PH SS) with (Ni)/Cr barrier layer(s) were infrared vacuum brazed using two silver-based braze alloys, 72Ag–28Cu and 63Ag–35.25Cu–1.75Ti (wt.%), respectively. Both Cr (15m) and Ni (2 m)/Cr (15 m) coated 17-4PH SS plates were evaluated in the study. Introducing (Ni)/Cr barrier layer(s) can effectively inhibit the interfacial reaction between the 17-4PH SS and the molten braze during brazing. Therefore, the formation of brittle interfacial Ti–Fe intermetallics next to the 17-4PH SS is avoided and replaced by Ti–Cu–(Ni) and TiCr2
intermetallic compounds in the joint. The average shear strength of the infrared brazed joint with Ni/Cr barrier layers is significantly improved up to 233 MPa. Using (Ni)/Cr barrier layers on the 17-4PH SS has the potential of industrial application in brazing Ti–6Al–4V and 17-4PH SS. © 2007 Elsevier B.V. All rights reserved.
Keywords: Ti–6Al–4V; 17-4PH stainless steel; Infrared brazing; Coating; Shear test
1. Introduction
Both Ti–6Al–4V and 17-4PH stainless steel (17-4PH SS) are important structural alloys. Combining an inexpensive 17-4PH SS body and a valuable Ti–6Al–4V key component has the potential to be an attractive product for industrial applica-tions [1–4]. For instance, the golf club head can be made by Ti–6Al–4V striking plate and a 17-4PH SS body. Brazing is considered as one of alternatives in joining Ti–6Al–4V and 17-4PH SS alloys. However, the formation of continuous interfacial Ti–Fe intermetallic compounds in the brazed joint significantly deteriorates the bonding strength of the joint due to the high reactivity of the Ti[4,5].
A barrier layer can isolate or relieve the interfacial reac-tion between the molten braze and the substrate during brazing. Based on our previous study of infrared brazing Ti–6Al–4V and 17-4PH SS using the 72Ag–28Cu braze alloy, the application of an electroless Ni plating with a 10m thickness on the 17-4PH SS is effectively served as a barrier layer to prevent the formation of Ti–Fe compounds[4]. Here, the brittle Ti–Fe reaction layer is replaced by interfacial CuNiTi and NiPTi phases. The plated Ni layer is consumed for the specimen infrared brazed at 880◦C for
∗Corresponding author. Tel.: +886 2 2363 7846; fax: +886 2 2363 4562.
E-mail address:[email protected](S.K. Wu).
300 s, so the bonding strength is impaired. It is preferred that a more resistant barrier layer is developed in brazing Ti–6Al–4V and 17-4PH SS.
Electroless or electric plating on a titanium alloy is not easily achieved by commercially available processes[4,6]. Because the Cr plating on the stainless steels is popular in industry, brazing Cr-coated 17-4PH SS plate and Ti–6Al–4V is proposed in the study[6].
It has been reported Ti alloys are easily brazed using both Ti and Ag-based braze alloys[3,7–11]. Compared with Ti-based braze alloys, Ag-based braze alloys are featured with their low melting points, which are advantageous in brazing the ␣– Ti such as Ti–6Al–4V [2,3,12]. A lower brazing temperature is also beneficial to the endurance of the barrier layer since both the interfacial reaction and the substrate dissolution are greatly decreased during brazing. So, two Ag-based braze alloys, 72Ag–28Cu and 63Ag–35.25Cu–1.75Ti in wt.%, were selected as filler metals in reported studies[5,13,14].
Infrared brazing is characterized by high heating rates up to 50◦C/s[15,16]. With the aid of infrared heating, the early stage of microstructural evolution of the joint is easily researched. The purpose of this research is focused on infrared braz-ing Ti–6Al–4V and 17-4PH SS with (Ni)/Cr barrier layer(s). Dynamic wetting angle measurements, microstructural evolu-tion, interfacial reaction and shear test of the infrared brazed joint are extensively assessed in the experiment.
0921-5093/$ – see front matter © 2007 Elsevier B.V. All rights reserved. doi:10.1016/j.msea.2007.10.075
2. Experimental procedures
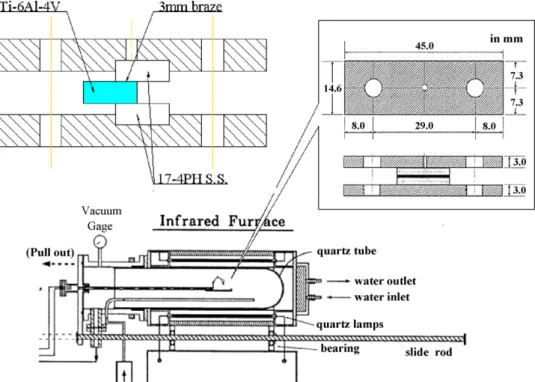
The thickness of both Ti–6Al–4V and 17-4PH SS plates is 3 mm each. Both Ti–6Al–4V and 17-4PH SS substrates are used in their annealed conditions. The 17-4PH SS plates were magnetically sputtered by a Cr layer of 15m in thickness as the barrier layer. Some Cr-coated 17-4PH SS plates were subsequently sputtered by a Ni layer of 2m in thickness to improve the wettability of the molten braze. Both 72Ag–28Cu and 63Ag–35.25Cu–1.75Ti (wt.%) foils with the thickness of 50m were selected as the brazing filler metals.
Wetting angle measurements of molten brazes on various sub-strates were performed in a vacuum of 5× 10⁻³Pa[10]. Infrared rays were generated from infrared lamps, transmitting the trans-parent quartz tube and focused in the specimen’s holder. One end of the quartz tube adopted the specimen’s holder, and the other end could transmit the signal into the image analysis system. The filler metal was placed on the substrate, and a thermocou-ple was in contact with the (Ni)/Cr-coated 17-4PH SS substrate
[10].
The braze alloy with near spherical shape used in the wetting angle test was prepared from the foil by vacuum arc remelting (VAR) with the operation voltage of 60 V and 50–60 A. The weight of each sphere was kept at about 0.12 g. The image of the molten braze on the substrate was captured simultane-ously by a charge coupled device (CCD) at a constant frequency of 20 frames a second. The active pixels of the CCD camera were 768(H)× 494(V), and CCD images were then saved in a computer for further analyses[15].
Fig. 1shows the schematic diagram of the infrared furnace and specimens used in the experiment. There are two types of specimens used in the experiment. One is prepared for met-allographic inspection; the other is made for the shear test as illustrated inFig. 1. The heating rate of infrared brazing was set at 15◦C/s throughout the experiment. All samples were preheated at 600◦C for 90 s before heating to the brazing temper-ature. The average cooling rate between the brazing temperature and 300◦C was approximately 0.3◦C/s. Table 1 summarizes all infrared brazing process variables used in the experiment. After infrared brazing, the cross-section of the brazed
speci-Fig. 1. The schematic diagram of infrared furnace and specimens used in the test. The up-left plots the specimen for the shear test, and the up-right plots the specimen for the metallographic inspection.
Table 1
Summary of infrared brazing process variables
Braze alloy (wt.%) Coating(s) on the 17-4PH SS Brazing temperature (◦C) Brazing time (s)
72Ag–28Cu Ni (2m)/Cr (15 m)/17-4PH SS 850 180 850 300 875 180 875 300 63Ag–35.25Cu–1.75Ti Cr (15m)/17-4PH SS 850 180 850 300 875 180 875 300
men experienced a standard metallographic procedure, and was examined using a Philips XL-30 scanning electron microscope (SEM) equipped with an energy dispersive spectroscopy (EDS) for chemical analyses.
Shear tests were performed to evaluate the bonding strength of selected infrared brazed joints. Ti–6Al–4V plate was sand-wiched between two coated 17-4PH SS plates with a 3 mm overlap of the braze alloy (Fig. 1)[4]. A Shimadzu AG-10 uni-versal testing machine compressed the infrared brazed specimen with a constant speed of 0.0167 mm/s. Failure analysis of the fractured surface after the shear test was performed using the SEM.
3. Results and discussion
3.1. Dynamic wetting angle measurements of two brazes on different substrates
The 72Ag–28Cu filler metal cannot effectively wet the Cr bar-rier layer, so the Cr-coated 17-4PH SS subsequently deposited a thin layer of Ni to improve its wettability. By adding 1.75 wt.% Ti into the Ag-based braze alloy, the 63Ag–35.25Cu–1.75Ti braze alloy is considered an active braze alloy and is selected as the filler metal in brazing Ti–6Al–4V and Cr-coated 17-4PH SS.
Fig. 2shows the dynamic wetting angle measurements of two brazes on Cr and Ni/Cr-coated 17-4PH SS at 850 and 875◦C, respectively. According toFig. 2, 63Ag–35.25Cu–1.75Ti shows poor wettability on the Cr-coated 17-4PH SS at 850 and 875◦C. Wetting angles display little change even after increasing the test time to 300 s. It is deduced introducing 1.75 wt.% Ti into the Ag-based braze alloy is insufficient to improve its wettability on the Cr-coated 17-4PH SS.
Fig. 2. Dynamic wetting angle measurements of two brazes on Cr and Ni/Cr-coated 17-4PH SS at 850 and 875◦C.
On the other hand, the Ag–Cu eutectic braze demonstrates excellent wettability on the Ni/Cr-coated 17-4PH SS. Introduc-ing a 2m Ni layer on the Cr-coated 17-4PH SS substantially improves the wettability of molten filler metal on it. For the spec-imen tested at 850◦C, the wetting angle drops from 120◦to 41◦ at 60 s and equilibrates at 11◦for testing time above 100 s. The wettability of Ag–Cu eutectic braze is further improved when increasing the test temperature to 875◦C. The wetting angle drops rapidly at 30 s and equilibrates at 60 s, and the wetting angle is as low as 8◦for the specimen tested at 300 s.
3.2. Brazing Ti–6Al–4V and Ni/Cr-coated 17-4PH SS using the 72Ag–28Cu filler
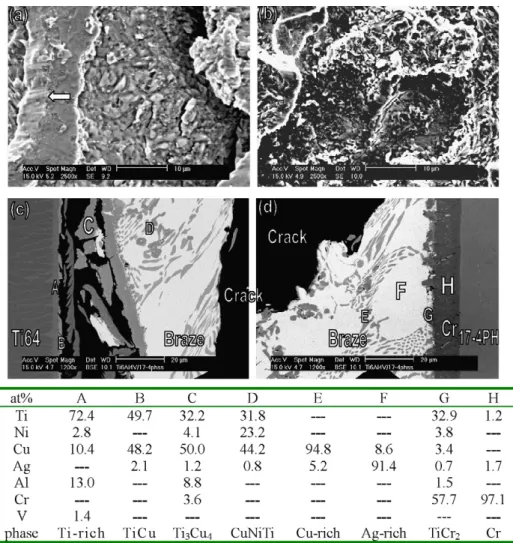
Fig. 3 displays the results of SEM backscattered electron images (BEIs) and EDS chemical analyses in atomic percent of
Fig. 3. SEM BEIs and EDS chemical analysis results in atomic percent of infrared brazed Ti–6Al–4V and Ni/Cr-coated 17-4PH SS using 72Ag–28Cu braze alloy at 850◦C for 180 s.
the specimen infrared brazed at 850◦C for 180 s. The deposited Ni layer is completely dissolved into the molten braze and read-ily reacts with Cu and Ti forming a Cu–Ni–Ti intermetallic compound close to the Cr layer, as marked by C inFig. 3. Accord-ing to the isothermal section of the Cu–Ni–Ti ternary alloy phase diagram at 800◦C, the CuNiTi phase can be expressed as (CuxNi1−x)2Ti where x ranges from 0.23 to 0.75[17]. Based
on the stoichiometric ratio among Cu, Ni and Ti, the phase at location C inFig. 3is close to CuNiTi.
The Cr layer shows good adhesion to the 17-4PH SS. Dif-fering from the deposited Ni layer in the previous study, the sputter-coated Cr barrier layer is almost intact from the short brazing cycle[4]. According toFig. 3, the thickness of the Cr layer (marked by A) is approximately 12m, so it is effective in isolating the interfacial reaction between Ti and Fe. Based on the Ag–Cr and Cr–Cu binary alloy phase diagrams, the Cr is nearly insoluble to Ag and Cu[18]. Accordingly, the interface between the braze and Ni/Cr-coated 17-4 PH SS is free of the reaction layer.
The chemical composition of 72Ag–28Cu deviates from the original eutectic because of the depletion of Cu from the brazed alloy. The brazed joint chiefly consists of white Ag-rich matrix
as marked by D inFig. 3. Some of the Cu atoms in the braze alloy react with the Ti nearby the Ti–6Al–4V side, and form interfacial Ti3Cu4and TiCu as marked by E and F. Because the
Ti content in the molten braze is supplied by the dissolution of Ti–6Al–4V substrate during infrared brazing, the growth of Ti–Cu intermetallics at the interface between Ti–6Al–4V and braze alloy is much more prominent than between 17-4PH SS and braze alloy. It is obvious the interfacial Ti–Cu intermetallic compounds grow rapidly even for the shortest brazing cycle.
Figs. 4 and 5display SEM BEIs and chemical analysis results of the specimens infrared brazed at various brazing conditions. The microstructures of these joints are similar to those ofFig. 3. Both dissolution of Ti–6Al–4V into the molten braze and reac-tions between Ti and Cu are increased by increasing the brazing temperature and/or time. The Ti–Cu intermetallic compounds as marked by F and G inFig. 4are much more than inFig. 3. On the other hand, the Cr barrier layer has not disappeared from the joint even if the specimen is brazed at 875◦C for 300 s (Fig. 5). It is obvious the coated Cr barrier layer functions well, and it is more resistant than the plated Ni one[4].
It is worth mentioning the TiCr2 phase at the interface
between 17-4PH SS and braze alloy is observed for the specimen
Fig. 4. SEM BEIs and EDS chemical analysis results in atomic percent of infrared brazed Ti–6Al–4V and Ni/Cr-coated 17-4PH SS using 72Ag–28Cu braze alloy at (a and b) 850◦C for 300 s, (c and d) 875◦C for 180 s.
Fig. 5. SEM BEIs and EDS chemical analysis results in atomic percent of infrared brazed Ti–6Al–4V and Ni/Cr-coated 17-4PH SS using 72Ag–28Cu braze alloy at 875◦C for 300 s.
infrared brazed at 875◦C for 300 s, as marked by B inFig. 5. However, the TiCr2phase is not obvious for other brazing
con-ditions. It is deduced a high brazing temperature and/or a long brazing time result in the interfacial reaction between Ti and Cr barrier layer. The growth rate of TiCr2is much lower than Ti–Cu
intermetallics, as demonstrated by the lack of a continuous TiCr2
reaction layer.
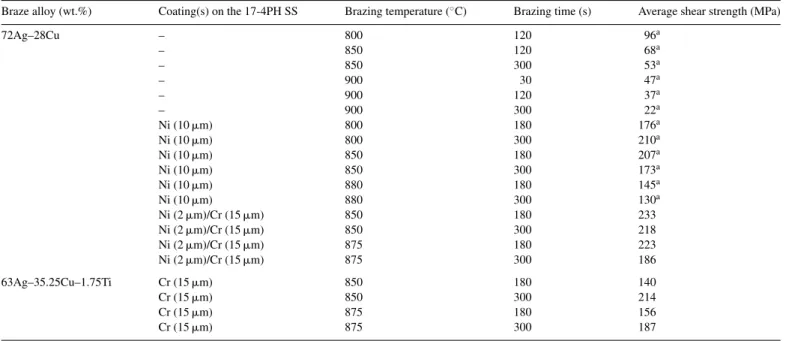
Table 2summarizes the shear strengths of infrared brazed Ti–6Al–4V and 17-4PH SS with various brazing conditions.
Because the shear strengths of all joints are much lower than the Ti–6Al–4V and 17-4PH SS substrates, further heat treat-ing both substrates to obtain their maximum strengths is not considered in this research. It needs further study. Data of the previous study are also included in the table for comparison purposes[4]. Since the growth of interfacial Ti–Fe intermetal-lic compound significantly reduces its bonding strength, the average shear strength of the 900◦C brazed specimen for 300 s without any coating is as low as 22 MPa. Decreasing the
braz-Table 2
Summary of shear strength of infrared brazed Ti–6Al–4V and 17-4PH SS
Braze alloy (wt.%) Coating(s) on the 17-4PH SS Brazing temperature (◦C) Brazing time (s) Average shear strength (MPa)
72Ag–28Cu – 800 120 96a – 850 120 68a – 850 300 53a – 900 30 47a – 900 120 37a – 900 300 22a Ni (10m) 800 180 176a Ni (10m) 800 300 210a Ni (10m) 850 180 207a Ni (10m) 850 300 173a Ni (10m) 880 180 145a Ni (10m) 880 300 130a Ni (2m)/Cr (15 m) 850 180 233 Ni (2m)/Cr (15 m) 850 300 218 Ni (2m)/Cr (15 m) 875 180 223 Ni (2m)/Cr (15 m) 875 300 186 63Ag–35.25Cu–1.75Ti Cr (15m) 850 180 140 Cr (15m) 850 300 214 Cr (15m) 875 180 156 Cr (15m) 875 300 187 aRef.[4].
Fig. 6. SEM and EDS analyses of the joint infrared brazed at 850◦C for 180 s. (a and b) Fractographs of Ti–6Al–4V side and 17-4PH SS side, (b and c) cross-sections after the shear test.
ing temperature and/or time leads to increasing average shear strength up to 96 MPa. Unfortunately, the Ti–Fe intermetallics cannot be completely avoided even in the fastest infrared brazing cycle.
The average shear strength of the brazed joint is greatly improved up to 210 MPa by introducing a layer of plated Ni on the 17-4PH SS[4]. However, the bonding strength is impaired if the Ni barrier layer is consumed for higher brazing temperature and/or longer brazing time. Because the sole Ni barrier layer is not very resistant to the molten braze, a rapid brazing cycle is still preferred in application.
In contrast, most average shear strengths of brazed Ti–6Al–4V and Ni/Cr-coated 17-4PH SS are higher than the Ni plated ones. The maximum average shear strength of the Ni/Cr-coated one is as high as 233 MPa for the specimen infrared brazed at 850◦C for 180 s. Also, the average shear strengths of joints are insensitive to brazing conditions, for example, the brazing temperature and time, since they have sim-ilar microstructures as described earlier. The Cr barrier layer is basically kept in good shape even for the highest brazing tem-perature and time. Therefore, it is inferred the Cr barrier layer is very effective in isolating 17-4PH SS and the molten braze to form interfacial Ti–Fe intermetallics in the joint.
Fig. 6shows the SEM and EDS analysis results of the frac-tured specimen infrared brazed at 850◦C for 180 s after the shear test. There are sliding marks marked by the arrow on the fractured surface (Fig. 6(a)), so some fractured phases were deformed plastically. Quasi-cleavage fracture is widely observed inFigs. 6(a and b). The joint is free of the brittle interfacial Ti–Fe intermetallic compound because the Cr barrier layer is almost intact after brazing. Also, the Cr barrier layer displays good adhesion to the 17-4PH SS after the shear test as illustrated in
Fig. 6(d). The infrared brazed joint consists of an Ag-rich matrix, a Cu-rich phase and Ti–Cu–(Ni) intermetallic phases. Cracks are mainly initiated from the interfacial Ti–Cu intermetallics as marked by B and C (Fig. 6(c)), and propagate into the Ag-rich matrix. The distortion of the eutectic matrix in the braze as illustrated inFigs. 6(c and d) demonstrates a certain degree of ductility in the joint. There are spotty TiCr2phase at the
inter-face between the Cr barrier layer and the braze as marked by G inFig. 6(d). However, the presence of such a spotty TiCr2phase
has little effect on the bonding strength of the joint.
It has been reported residual thermal stresses play a cru-cial role in brazing dissimilar alloys[19,20]. The brazed joint must have a certain ability to deform plastically, or the joint is greatly deteriorated due to residual thermal stresses. Based
Fig. 7. SEM BEIs and EDS chemical analysis results in atomic percent of infrared brazed Ti–6Al–4V and Cr-coated 17-4PH SS using 63Ag–35.25Cu–1.75Ti braze alloy at 850◦C for 180 s.
on the experimental observation, the Ag-rich matrix shows the ability of plastic deformation, and is helpful in relieving the residual thermal stresses of the joint. Also, the formation of interfacial Ti–Cu–(Ni) intermetallics is better than the very brit-tle Ti–Fe intermetallics. Consequently, applying Ni/Cr coatings on the 17-4PH SS significantly improves the bonding strength of the brazed joint.
3.3. Brazing Ti–6Al–4V and Cr-coated 17-4PH SS using the 63Ag–35.25Cu–1.75Ti filler
Fig. 7 shows the results of SEM BEIs and EDS chemical analyses in atomic percent of the specimen infrared brazed at
850◦C for 180 s. Similar to the earlier results, the microstructure of the brazed joint primarily consists of Ag-rich matrix (E), Ti–Cu intermetallics (C, F and H), Cu-rich (D and G) phases. The Cr barrier layer, as marked by A inFig. 8, is still available for isolation of the reaction between the molten braze and 17-4PH SS. However, there is a continuous phase as marked by B at the interface between the Cr barrier layer and braze alloy. Based on the Cr–Ti binary alloy phase diagram, the stoichiometric ratio between Cr and Ti is close to TiCr2 phase. In contrast to the
previous results, the continuous TiCr2phase is readily formed
even when the specimen is brazed at 850◦C for 180 s.
Fig. 8displays the SEM BEIs and EDS chemical analysis results of the joint infrared brazed at 875◦C for 300 s. According
Fig. 8. SEM BEIs and EDS chemical analysis results in atomic percent of infrared brazed Ti–6Al–4V and Cr-coated 17-4PH SS using 63Ag–35.25Cu–1.75Ti braze alloy at 875◦C for 300 s.
toFig. 8, Ti–Cu intermetallics are greatly coarsened by increas-ing the brazincreas-ing temperature and time. It is also noted the Cr layer works well to isolate the reaction between the braze alloy and 17-4PH SS. The interfacial TiCr2phase is observed as marked
by B inFig. 8. However, it is not significantly coarsened by increasing the brazing temperature and time. The slow growth rate of TiCr2suggests the Cr barrier layer is resistant to molten
braze erosion during infrared brazing. Thus, the thickness of Cr layer shows little change even when brazed at 875◦C for 300 s.
The shear strengths of brazed Cr-coated 17-4PH SS plates using 63Ag–35.25Cu–1.75Ti filler metal are included inTable 2. They are better than the specimen without any coating on the 17-4PH SS but inferior on average to those with Ni/Cr coatings. The maximum shear strength of the joint is 214 MPa for the specimen infrared brazed at 850◦C for 300 s. However, the joint shows lower bonding strength for the shorter brazing cycle, for example, 180 s. It is deduced that poor wetting of the molten braze on the Cr-coated 17-4PH SS worsens the bonding strength
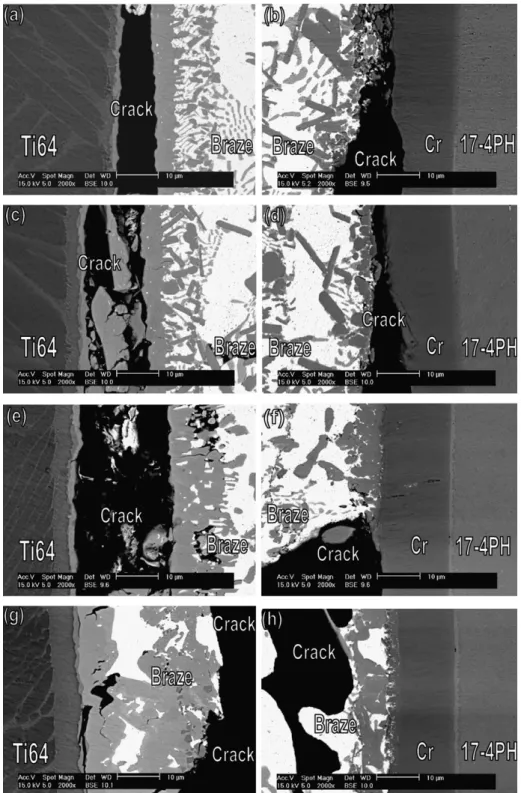
Fig. 9. SEM cross-sections after the shear tests and EDS chemical analyses of the joint infrared brazed at (a and b) 850◦C for 180 s, (c and d) 850◦C for 300 s, (e and f) 875◦C for 180 s, (g and h) 875◦C for 300 s.
of the joint, especially for the short thermal cycle of brazing. On the other hand, increasing the brazing temperature leads to decreasing bonding strength of the joint because of the growth of intermetallics in the joint. Both increasing the brazing time and/or temperature result in growth of brittle intermetallics, so the bonding strength of the joint is impaired as demonstrated in
Table 2.
Fig. 9displays SEM cross-sections of the brazed joints after the shear test for various brazing conditions. There are two major crack locations identified from Fig. 9 including Ti–Cu inter-metallics close to the Ti–6Al–4V and interfacial TiCr2next to
the Cr barrier layer. Cracks are generally initiated and propa-gated along the interfacial Ti–Cu and TiCr2intermetallic phases.
It is also noted the crack growth rate of interfacial TiCr2is not
as prominent as the Ti–Cu intermetallics. Rapid growth of inter-facial Ti–Cu may also result in premature failure of the brazed joint.
Because the brazed joint is free of Ti–Fe intermetallic com-pounds, introducing a Cr barrier layer on the 17-4PH SS is still a good approach to avoid the interfacial reaction between Ti and Fe. Replacing interfacial Ti–Fe intermetallics into Ti–Cu and TiCr2 phases significantly improves the shear strength of the
joint.
4. Conclusions
Microstructural evolution and the shear strength of the infrared brazed Ti–6Al–4V and 17-4PH SS with (Ni)/Cr barrier layer(s) have been evaluated in this study. Important conclusions are summarized below.
1. 63Ag–35.25Cu–1.75Ti shows poor wettability on the Cr-coated 17-4PH SS at 850 and 875◦C, and wetting angles show little change even after increasing the test time to 300 s. Introducing 1.75 wt.% Ti into the Ag-based braze alloy is insufficient to improve its wettability on the Cr-coated 17-4PH SS. In contrast, the wettability of 72Ag–28Cu braze is considerably improved by introducing a 2m Ni layer on the Cr-coated 17-4PH SS.
2. For the Ni/Cr-coated 17-4PH SS using 72Ag–28Cu braze, the Ni layer is readily dissolved into the molten braze, and the brazed joint primarily consists of an Ag-rich matrix, Cu-rich and Ti–Cu–(Ni) intermetallic phases. The maximum aver-age shear strength of the joint is as high as 233 MPa for the specimen infrared brazed at 850◦for 180 s. Average shear strengths of joints are insensitive to the brazing conditions because they have similar microstructures. Failure of the joint after the shear test is caused by the fracture of Ti–Cu–(Ni) intermetallics in the joint.
3. For the Cr-coated 17-4PH SS using 63Ag–35.25Cu–1.75Ti braze, the microstructure of the joint mainly consists of Ag-rich matrix, Cu-Ag-rich, Ti–Cu and TiCr2intermetallic phases.
Shear strengths of joints are generally inferior to those with Ni/Cr coatings on the 17-4PH SS. The maximum shear strength of the joint is 214 MPa for the specimen infrared brazed at 850◦C for 300 s. The joint shows lower bonding strength for the shorter brazing time, for example, 180 s due to the poor wetting of the molten braze on the Cr-coated 17-4PH SS. On the other hand, increasing the brazing tem-perature causes decreasing shear strength of the joint due to the rapid growth of Ti–Cu intermetallics in the joint. The Cr barrier layer is kept in good shape even for the highest brazing temperature and longest time in the test.
4. Both the Cr and Ni/Cr barrier layers are effective in avoid-ing the interfacial reaction between Ti and Fe. Replacavoid-ing interfacial Ti–Fe intermetallics into Ti–Cu–(Ni) and/or TiCr2
phases significantly improves the shear strength of the joint.
Acknowledgement
The authors gratefully acknowledge the financial support of this research from National Science Council (NSC), Taiwan, Republic of China, under the grant NSC 95-2221-E002-081-MY2.
References
[1] M. Schwartz, Brazing: for the Engineering Technologist, Chapman & Hall, New York, 1995.
[2] G. Humpston, D.M. Jacobson, Principles of Soldering and Brazing, ASM International, Materials Park, 1993.
[3] D.L. Olson, T.A. Siewert, S. Liu, G.R. Edwards, ASM Handbook, in: Welding Brazing and Soldering, vol. 6, ASM International, Materials Park, 1993.
[4] R.K. Shiue, S.K. Wu, C.H. Chan, C.S. Huang, Metall. Mater. Trans. 37A (2006) 2207–2217.
[5] C.C. Liu, C.L. Ou, R.K. Shiue, J. Mater. Sci. 37 (11) (2002) 2225–2235. [6] C.M. Cotell, J.A. Sprague, F.A. Smidt, ASM Handbook, in: Surface
Engi-neering, vol. 5, ASM International, Materials Park, 1994. [7] O. Botstein, A. Rabinkin, Mater. Sci. Eng. A188 (1994) 305–315. [8] O. Botstein, A. Schwarzman, A. Rabinkin, Mater. Sci. Eng. A206 (1995)
14–23.
[9] C.T. Chang, R.K. Shiue, C.S. Chang, Scripta Mater. 54 (2006) 853–858. [10] R.K. Shiue, S.K. Wu, C.H. Chan, Metall. Mater. Trans. 35A (10) (2004)
3177–3186.
[11] N.A. Tiner, Weld. J. 34 (1955) 846–850.
[12] R. Roger, E.W. Collings, G. Welsch, Materials Properties Handbook: Tita-nium Alloys, ASM International, Materials Park, 1993.
[13] R. Xu, J.E. Indacochea, J. Mater. Sci. 29 (23) (1994) 6287–6294. [14] A. Abed, I.S. Jalham, A. Hendry, J. Eur. Ceram. Soc. 21 (3) (2001) 283–290. [15] D.W. Liaw, Z.Y. Wu, R.K. Shiue, C.S. Chang, Mater. Sci. Eng. A454–A455
(2007) 104–113.
[16] R.K. Shiue, S.K. Wu, Y.L. Lee, Intermetallics 13 (8) (2005) 818–826. [17] P. Villars, A. Prince, H. Okamoto, Handbook of Ternary Alloy Phase
Dia-grams, ASM International, Materials Park, 1995.
[18] T.B. Massalski, Binary Alloy Phase Diagrams, ASM International, Mate-rials Park, 1990.
[19] B. Aleman, J. Guiterrez, J.J. Urcola, Mater. Sci. Technol. 9 (1993) 633–641. [20] K. Bhanomurthy, G.B. Kale, J. Mater. Sci. Lett. 12 (1993) 1879–1881.