K
INETICS OF
D
ECOMPOSITION OF
P
OLYETHYLENE
G
LYCOL
IN
E
LECTROPLATING
S
OLUTION BY
O
ZONATION
WITH
UV R
ADIATION
By C. Y. Chang,
1Y. H. Chen,
2H. Li,
3C. Y. Chiu,
4Y. H. Yu,
5P. C. Chiang,
6Y. Ku,
7and J. N. Chen
8ABSTRACT: The kinetics of the ozonation of polyethylene glycol (PEG) with ultraviolet (UV) radiation in the acid-based electroplating solution of the printed wiring board industry is studied. The substrate prescription of a typical electroplating solution is with pH of 0.18–0.42, [CuSO4⭈5H2O] of 200 g/L, [H2SO4] of 60 g/L, and [Cl⫺] of 0.03 g/L. Certainly, the discarded electroplating solution is hard to treat with the common chemical and biological processes because of its acidic and metallic compositions. In addition, it contains valuable sub-stances suitable for recovery and reutilization. One of the most important processes for reviving it is to remove the aged organic additives such as PEG. A two-step reaction mechanism in terms of ozone A and total organic carbon is proposed to express the reaction kinetics of PEG ozonation with UV radiation with intensity [Iuv]. The initial concentration of PEG is 30 mg/L, according to the recipe of a typical electroplating solution, which is equivalent to total organic carbon of 16.3 mg/L. The reaction rate r expressions of the concentrations of the liquid phase ozone CALb, PEG CBLb, and intermediates CILbare rA (=dCALb/dt) =⫺(kAm ⫹ kI[Iuv])CALb ⫺ (kR1⫹
kRI1[Iuv])CALbCBLb⫺ (kR2⫹ kRI2[Iuv])CALbCILb, rB(=dCBLb/dt) =⫺(kR1⫹ kRI1[Iuv])CALbCBLb, rint(=dCILb/dt) = (kR1⫹
kRI1[Iuv])CALbCBLb ⫺ (kR2⫹ kRI2[Iuv])CALbCILb, with kAm= 0.0036 s⫺1, kI= 4.654⫻ 10⫺5s⫺1/(Wm⫺2), kR1= 13.525 M⫺1s⫺1, kR2= 0.751 M⫺1s⫺1, kRI1= 0.683 M⫺1s⫺1/(Wm⫺2), and kRI2= 0.042 M⫺1s⫺1/(Wm⫺2). These reaction kinetic expressions are useful and referable for the proper design of an ozonation system with UV radiation for the treatment of PEG in the printed wiring board electroplating solution.
INTRODUCTION
Wasted electroplating solution is one of the major waste-water sources in the printed wiring board (PWB) industry. The substrates (the major chemical species) of the recipe solution are inorganics such as sulfuric acid, copper sulfate, and hy-drochloric acid, and the minor substances are organics such as polyethylene glycol (PEG), which is a brightening and stabi-lization agent (Fang 1996). Consequently, the characteristics of wasted electroplating solution include high acidity (pH = 0.18 to 0.42) and ionic strength. All of the above features make the solution hard to treat with conventional treatment processes (Suzuki 1976; Andreozzi et al. 1996a). The current major method used to treat the waste electroplating solution of PWB is chemical coagulation, which produces hazardous chemical sludge because of its high heavy metal content, such as copper. In Taiwan, the yield of the waste electroplating solution of
PWB is approximately 106,000 m3
/day, resulting in about 21,000 ton waste sludge/year with 78% by weight moisture (Waste 1997). Furthermore, in view of the resource recycling,
1
Prof., Grad. Inst. of Envir. Engrg., Nat. Taiwan Univ., Taipei 106, Taiwan (corresponding author). E-mail: [email protected]
2
PhD Candidate, Grad. Inst. of Envir. Engrg., Nat. Taiwan Univ., Tai-pei 106, Taiwan.
3
Master Grad., Grad. Inst. of Envir. Engrg., Nat. Taiwan Univ., Taipei 106, Taiwan.
4Asst. Prof., Dept. of Envir. Engrg., Fu Shin Inst. of Technol., I Lan
261, Taiwan.
5Prof., Grad. Inst. of Envir. Engrg., Nat. Taiwan Univ., Taipei 106,
Taiwan.
6Prof., Grad. Inst. of Envir. Engrg., Nat. Taiwan Univ., Taipei 106,
Taiwan.
7
Prof., Dept. of Chemical Engrg., Nat. Taiwan Univ. of Sci. and Tech-nol., Taipei 106, Taiwan.
8
Prof., Grad. Inst. of Envir. Engrg., Nat. Chiao-Tung Univ., HsinChu 300, Taiwan.
Note. Associate Editor: Steven Dentel. Discussion open until March 1, 2002. To extend the closing date one month, a written request must be filed with the ASCE Manager of Journals. The manuscript for this paper was submitted for review and possible publication on September 28, 2000; revised April 26, 2001. This paper is part of the Journal of
Environmental Engineering, Vol. 127, No. 10, October, 2001.䉷ASCE,
ISSN 0733-9372/01/0010-0908–0915/$8.00⫹ $.50 per page. Paper No. 22456.
the waste electroplating solution of PWB has great reclamation and recycling potentials with high copper concentration and electric conductivity. However, the qualities of the organics of the electroplating solution are low and unreliable for the pro-cess after electroplating and electrophoresis. For this reason, removing the spent organic additives in order to add new ad-ditives is one of the key steps for the reutilization process.
Ozonation is an effective way to reduce the chemical oxi-dation demand and total organic carbons (TOCs) by oxidizing the stream solutions with ozone (Hewes and Davison 1971). Ozonation takes place via two different reaction pathways (Gurol and Singer 1982). Ozone can directly react with
pol-lutants, ‘‘direct ozonation’’ by means of O3 molecules. It can
also indirectly react with pollutants, ‘‘radical ozonation,’’ by means of the highly oxidative free radicals such as hydroxyl radicals, which are produced by the ozone decomposition in the aqueous solution (Sotelo et al. 1987). The radical ozona-tion is nonselective and vigorous. The ozonaozona-tion process in the acid condition mainly takes place through the direct oxi-dation reaction, which is selective (Beltra´n and Alvarez 1996; Hautaniemi et al. 1998). Ozonation combined with ultraviolet (UV) radiation is deemed as a more effective process to re-move organics as compared to the pure ozonation. UV radia-tion is commonly employed to enhance the ozone decompo-sition, yielding more free radicals and resulting in a higher ozonation rate (Prengle 1983; Chang et al. 1996). The decom-position rate expressions of ozone in the presence of UV radiation reported by Ikemizu et al. (1987) and Ku et al. (1996) were⫺d[O3]/dt = kaI[O3] 1.5⫹ k bI[O3]⫹ kII[Iuv][O3] and kaK[O3] 1.5 ⫹ k IK[Iuv] 0.9 [O3] 1.5
, respectively, where the reaction
rate constants were some functions of [OH⫺]. The catalytic
effect of the UV radiation of ozone decomposition was found significant in the acid region (Huang and Chen 1993). How-ever, all their results were proposed for the aqueous solution and are not applicable to the electroplating solution of PWB examined in this study.
As reported by Suzuki (1976), the PEG chain is cleft ran-domly by the ozone in water. Compounds with a terminal hy-droxyl group and esters are formed as the major products of ozonation. The electrophilic attack of ozone on the ester bond takes place. Andreozzi et al. (1996a) studied the ozonation of
JOURNAL OF ENVIRONMENTAL ENGINEERING / OCTOBER 2001 / 909
PEG 2000 in aqueous solution using the simple PEG-like structure substances such as ethylene glycol (EG), diethyl-eneglycol (DEG), and triethylene glycol (TEG). It was found that the direct ozonation mechanism at the acid condition is applicable for explaining that the relatively small amount of EG, glycolic aldehyde, and glycolic acid derivative appear as the intermediates of the DEG oxidation process. However, at the basic condition, the marked occurrence of EG, glycolic aldehyde, and glycolic acid derivatives is likely the conse-quence of the low selectivity of the radical ozonation mecha-nism. Note that they described the reaction kinetics of ozone
A and PEG-like substances B as ⫺dCA/dt = ⫺dCB/dt =
where C = concentration, kB= reaction rate constant,
n
k C C ,B A B
and n = reaction order. The values of n for DEG, TEG,
tetra-EG, and PEG 2000 are close to unit, whereas those of kB for
DEG, TEG, tetra-EG, and PEG 2000 are 0.348, 0.468, 0.416, and 5.182 M⫺1s⫺1, respectively. All their results are useful for the PEG ozonation in water or aqueous solution but do not refer to the electroplating solution. Recently, Li et al. (2000) investigated the kinetics of the ozonation of PEG in the PWB electroplating solution. However, the study did not consider the effect of UV radiation.
The objective of this study is to model and investigate the reaction kinetics of ozone photolysis and PEG decomposition by the combined ozonation with UV radiation in the electro-plating solution of the PWB industry. Batch and semibatch ozonation experiments with UV radiation are proceeded under different reaction conditions. The dissolved liquid CALband
off-gas CAGe ozone concentrations are measured for the samples
drawn out from the reactor at specified time intervals. TOC is chosen as a mineralization index of PEG. PEG decomposition accompanies TOC variation and ozone consumption. The re-action rate expressions of ozone (dCALb/dt), PEG (dCBLb/dt),
and intermediate organic species (dCILb/dt) can then be
ob-tained. These results can provide useful information about re-moving the PEG from the electroplating solution of PWB by ozonation with UV radiation for the reutilization process.
EXPERIMENTAL Chemicals
The substrate recipe of the electroplating solution is
[CuSO4⭈5H2O] = 200 g/L, [H2SO4] = 60 g/L, and [Cl
⫺] =
0.03 g/L. The concentration of PEG as the sole organic target is 30 mg/L according to the electroplating prescription. PEG
with the chemical formula HO(C2H4O)nH, which is used as a
brightening and stabilization agent in the electroplating pro-cess, has an average molecular weight equal to 6,000, ranging from 5,000 to 7,000. All the chemicals employed are pur-chased in reagent grade from Merck (Darmstadt, Germany) and used without any further purification. All electroplating solutions are prepared with deionized water without other buf-fers. The pH value of the electroplating solution is about 0.25. The variation of pH during the experiments is found to be very slight because of the high acid concentration of the so-lution.
Instrumentation
The airtight reactor, 17.2-cm inside diameter, is made of Pyrex glass with an effective volume of 8 L and is equipped with a water jacket to maintain a constant solution temperature of 25⬚C in all experiments. The design of the reactor is based on the criteria of the shape factor of a standard six-blade tur-bine (McCabe et al. 1993). The gas diffuser, cylindrical shape with pore size of 10m, is located at the bottom of the reactor. Two quartz tubes of 4.4-cm outside diameter, symmetrically installed inside the reactor, are used to house the UV lamps. The low-pressure mercury lamps, with various output powers emitted principally at 254 nm, supply the UV radiation. The
radiation intensity ([Iuv], Wm⫺2) is measured by a Spectroline
(Spectronics Corp., New York) model DRC-100X digital ra-diometer with a DIX-254 radiation sensor (Ku et al. 1996). About 3.705 L of solution is used in each experiment, and the total sampling volume is within 5% of the solution. The stirred speed is as high as 800 rpm to ensure the complete mixing of liquid and gas phases, according to previous tests (Li et al. 2000). The generation of ozone is controlled by the power input of a Sumitomo (Sumitomo Co., Tokyo, Japan) model SG-01A ozone generator at constant gas pressure (1 kg force/ cm2
, or 9.8 N/cm2
). The ozone generator used employs two steel plate electrodes and a ceramic dielectric. The discharge gap is 0.8 mm with air cooling. As specified by the supplier,
the power needed is 0.4 kW at 30 gO3/h, 100 gO3/Nm
3
, and
0.3 Nm3O
2/h. Ozone-containing gas generated by pure oxygen
is introduced into the reactor with a gas flow rate of 1.78 L/
min at 273 K. The fed CAGi0 and discharged CAGe gas ozone
concentrations are measured by the Seki (Seki Electronics, To-kyo, Japan) model SOZ-6002 UV photometric analyzer, which is calibrated by the KI (potassium iodine) titration method (Rankness et al. 1996). The Orbisphere (Orbisphere Lab., Neu-chaˆtel, Switzerland) model 3600 liquid ozone monitor with a sensor of membrane-containing cathode, which is calibrated by the indigo method (Bader and Hoigne´ 1981) as previously described (Li et al. 2000), is used to analyze the dissolved
ozone concentration CALbin the electroplating solution. A
cir-culation pump is used to transport the liquid from the reactor to the sensor of the monitor with a flow rate of 0.18 L/min and to reflow it back during the ozonation. Samples are drawn out from the reactor at desired intervals in the course of the experiments. The residual dissolved ozone in the sample is removed by stripping with nitrogen. The TOC concentration of the sample is analyzed by an OIC (O. I. Corp., Tex.) model 700 TOC analyzer. The instrument uses the UV-persulfate technique to convert the organic carbon for the subsequent analysis by an infrared carbon dioxide analyzer calibrated with the potassium hydrogen phthalate standard. All fittings, tubing, and bottles are made of stainless steel, Teflon, or glass. The experimental apparatus employed in this work is shown in Fig. 1.
Experimental Procedures
Before starting the ozonation experiments, the ozone-con-taining gas is bypassed to the photometric analyzer to assure the stability and ozone concentration. Four different light
in-tensities ([Iuv] = 20.5, 31.1, 47.0, and 57.6 Wm
⫺2) are
em-ployed to test the UV radiation effect on the ozonation. A part of the gas stream at the present flow rate is directed into the reactor when reaching the set conditions.
Both semibatch and batch experiments are performed to study the ozone decomposition with UV radiation and carried
out until reaching the steady-state CALb,ss and zero
concentra-tions of dissolved ozone for the semibatch and batch cases, respectively. The batch experiment of PEG ozonation is con-ducted by the stopped-flow-like method (Kuo and Huang 1995), with PEG-containing liquid being injected into the re-actor prefilled with the electroplating solution of known
dis-solved ozone concentration CALb. The liquid phase experiment
is operated at a high agitation speed of 800 rpm to eliminate the mass transfer influence.
RESULTS AND DISCUSSION
The results of the kinetic study include two parts: (1) O3/
UV decomposition in the substrates of the electroplating so-lution; and (2) PEG ozonation with UV radiation. Ozone pho-tolysis in the electroplating solution is studied under various ozone dosages and light intensities. The temporal variations of dissolved and off-gas ozone concentrations are monitored to
FIG. 1. Experimental Apparatus Sketch—Components: 1. Oxygen Cylinder, 2. Drying Tube, 3. Ozone Generator, 4. Flow Meter, 5. Three-Way Valve, 6. Stirrer, 7. UV Lamp, 8. Reactor, 9. Thermostat, 10. Liquid Ozone Sensor, 11. pH Sensor, 12. Circulation Pump, 13. Sample Port, 14. Gaseous Ozone Detector, 15. KI Solution, 16. Vent to Hood
TABLE 1. Steady-State Concentrations of Ozone in Exit Gas CAGe, ss and Bulk Liquid CALb, ssat Various Inlet Gaseous Ozone Concentrations
CAGi0and UV Radiation Intensities [Iuv]—QG= 1.78 L/min at 273 K,
VL= 3.705 L, T = 298 K CAGi0 (mg/NL) [Iuv] (W/m2 ) CAGe, ss (mg/NL) CALb, ss (mg/L) 25.0 57.6 21.10 5.00 23.0 57.6 19.37 4.62 20.0 57.6 16.94 3.95 15.0 57.6 13.20 2.30 10.0 57.6 8.68 1.70 5.0 57.6 4.30 0.91 20.0 47.0 17.06 4.03 20.0 31.1 17.28 4.12 20.0 20.5 17.69 4.15 8.0 20.5 7.00 1.79
provide the data for determining the kinetics parameters. PEG ozonation is carried out with different UV radiation intensities. The temporal concentrations of TOC and dissolved ozone are analyzed for model acquirement.
Ozone Self-Decomposition with UV Radiation in Electroplating Solution
Although there have been numerous studies about ozone decomposition in aqueous solution, such information in the electroplating solution is still scarce. It is well known that UV radiation enhances the ozone decomposition. However, its role in the electroplating solution remains indeterminate. For this
reason, the kinetic expression of O3/UV decomposition
reac-tion is first established in the present experiments. The general reaction rate expression of ozone decomposition was proposed by Chang et al. (1996)
m n u
⫺d[O ]/dt = k [O ] ⫹ k [O ] ⫹ k [O ]3 Am 3 Bn 3 Iu 3 (1)
where kAm, kBn, and kIurepresent the acidic, basic, and radiation
decomposition reaction rate constants, respectively. In the ex-pression, kAm, kBn, and kIu are dependent slightly on [OH⫺],
strongly on [OH⫺], and on [OH⫺] and [Iuv], respectively. The
rate equation can be reduced to ⫺d[O3]/dt = kAm[O3]
m ⫹
kIu[O3] u
by neglecting the basic term for the strong acid con-dition of the electroplating solution. Further noting that the variation of acidity is slight in the strong acidic electroplating solution, one then has the ozone decomposition rate equation with UV radiation in the electroplating solution
dCALb m i u
⫺r = ⫺A =⫺r ⫺ r = k CAd Au Am ALb⫹ k [I ] CI uv ALb (2) dt
where CALb= concentration of ozone A in bulk liquid; [Iuv] =
light intensity of UV radiation; and kI = rate constant of
ra-diation decomposition expressed excluding the term [Iuv]. For
the case without UV radiation, (2) reduces to⫺rA =
m
k CAm ALb.
The values of kAmand m were determined by Li et al. (2000)
as 0.0036 s⫺1and 1, respectively. The kAm value is >0.00032
s⫺1 obtained by Sotelo et al. (1987) for the water system at
the same pH because of the high ionic strength of the electro-plating solution employed by Li et al. (2000).
Consider the combined absorption and decomposition of ozone in a semibatch stirred gas-liquid reactor. The mass
bal-ance equations describing the steady-state condition ss in the
reactor for the consumption of ozone by the O3/UV
decom-position reactions are as following:
Q (CG AGi 0⫺ CAGe, ss)/V =L ⫺rA (3) i u
Q (CG AGi0⫺ CAGe, ss)/VL⫺ k CAm ALb, ss=⫺r = k [I ] CAu I uv ALb, ss (4)
where QG= gas flow rate; VL= liquid volume in reactor; CAGi0
and CAGe,ss = ozone concentrations of inlet and steady-state
outlet gases; and CALb,ss = ozone concentration of bulk liquid
at steady state.
The value of u can be obtained from the slope of the plot of log(⫺rAu) versus log(CALb, ss) under a fixed UV radiation
in-tensity. Table 1 gives the values of CAGe, ssand CALb, ssat various
CAGi0 and [Iuv] for the semibatch system of the electroplating
solution substrate, with pH = 0.18 to 0.42, QG = 1.78 L/min
at 273 K, and VL = 3.705 L. Employing the data of Table 1
with UV radiation intensity equal to 57.6 Wm⫺2, one may
perform a linear regression by plotting log(⫺rAu) against
log(CALb, ss), as shown in Fig. 2. From the slope (=1.019) of
the straight line obtained by the least-squares calculation pro-cedure, the reaction order of ozone in the photolysis reaction may be regarded as first order (u = 1). It indicates that both ozone self-decomposition and photolysis reaction rates are proportional to ozone concentration. Consequently, the slope of log(⫺rAu/CALb, ss) versus log([Iuv]) may be used to find the
value of i. As shown in Fig. 3, the slope representing the order
JOURNAL OF ENVIRONMENTAL ENGINEERING / OCTOBER 2001 / 911
FIG. 4. ⫺rAuversus [Iuv]CALb, ssfor Ozone Decomposition with UV Ra-diation in Semibatch System (Slope Represents Reaction Rate Constant
kIof Ozone Photolysis Reaction; Line: Y = 4.654⫻ 10⫺5X, r
2
= 0.991;
䡩 = Experimental Data)
FIG. 2. log(⫺rAu) versus log(CALb, ss) for Ozone Decomposition with UV Radiation Intensity of 57.6 W/m2
in Electroplating Solution Substrate in Semibatch System (Slope Represents Reaction Order u of Ozone; Line:
Y = 1.019X⫺ 2.500, r2
= 0.999;䡩 = Experimental Data)
FIG. 3. log(⫺rAu/CALb, ss) versus log([Iuv]) for Ozone Decomposition with UV Radiation in Electroplating Solution Substrate in Semibatch Sys-tem (Slope Represents Reaction Order i of UV Radiation; Line: Y = 1.038X⫺ 4.399, r2
= 0.977;䡩 = Experimental Data)
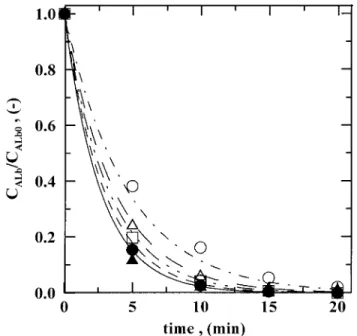
FIG. 5. (CALb/CALb0) versus Time for Ozone Decomposition with UV Radiation in Electroplating Solution Substrate in Batch System (R2
= 0.988; Symbols, Lines: Experiments, Prediction; 䡩 and — - —,䉭 and — —,䡺 and — - - —, ● and ---,䊱and —— : [Iuv] = 0.0, 20.5, 31.1, 47.0, 57.6 Wm⫺2)
of UV radiation is 1.038. Thus, one may employ the first re-action order to describe UV radiation (i = 1) and get the ozone photolysis reaction equation as⫺rAu= kI[Iuv]CALb. It illustrates
that the ozone photolysis reaction rate depends on both ozone concentration and UV radiation intensity with the first reaction order of each. Then the ozone photolysis reaction rate constant
kI is fitted to be 4.654⫻ 10
⫺5m2W⫺1s⫺1with r2 of 0.991 by
plotting⫺rAuagainst [Iuv]CALb, ss(Fig. 4). This gives
⫺r = k CA A ALb (5)
with kA = kAm⫹ kI[Iuv] = (0.0036⫹ 4.654 ⫻ 10 ⫺5[I
uv]) s ⫺1.
The decomposition rate of ozone increases about 25 – 75%
owing to the UV radiation (20.5 – 57.6 W/m2
) in the present experiments. The UV radiation initiates the photolysis of
dis-solved ozone to generate hydrogen peroxide and an oxygen molecule. The hydrogen peroxide can then be decomposed into hydroxyl radicals by being exposed to UV radiation. This thus enhances the ozone decomposition rate. According to the above pathway, Peyton and Glaze (1988) gave the following
decomposition reactions of O3 with UV radiation:
O3⫹ H O ⫹ h2 →O2⫹ H O2 2 H O2 2⫹ h→2OH⭈ ⫺ ⫹ pH O S HO2 2 2 ⫹ H ⫺ ⫺ O3⫹ HO2 →⭈O ⫹ HO ⭈3 2
The value of the reaction rate constant kI of this study is
lower than the kII of Ikemizu et al. (1987). At the same pH
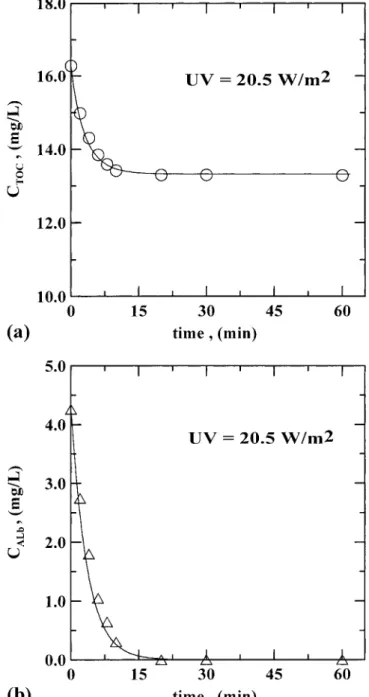
FIG. 7. Concentration Variations of CTOCand CALbof PEG Ozonation with UV Radiation of 20.5 W/m2
in Electroplating Solution of Batch System [Symbols: Experiments; Lines: Prediction: (a) CTOC: R
2
= 0.993; (b) CALb: R
2
= 0.983] FIG. 6. Procedures to Determine Kinetics Parameters (kRI1, kRI2) of
PEG Ozonation with UV Radiation in Electroplating Solution
value of 0.25, the values are 4.654 ⫻ 10⫺5(kI) and 4.802 ⫻
10⫺4m2
W⫺1s⫺1(kII), respectively. Noting that the solution of
chemicals such as metallic ions may absorb UV light (Leifer
1988), one may regard the low kI as attributed to the high
molar absorptivity of the medium of the electroplating solu-tion.
To further verify the kinetic expression of (5), batch
exper-iments of O3/UV photolysis are performed. The concentrations
of dissolved ozone are measured at different reaction times. One may have (6) for the batch system
⫺k tA
CALb= CALb0e (6)
where kAdescribed in (5) is a function of UV random intensity.
The comparison of experimental data and predicted values is shown in Fig. 5. It is seen that the kinetic model is attuned to the experimental data with R2 > 0.98.
PEG Ozonation with UV Radiation in Electroplating Solution
PEG ozonation with a distinct UV radiation intensity in the batch system is carried out to study the kinetics. UV radiation
is combined with ozone to create the synergistic effect on the mineralization of organics. Previous blank tests have indicated that the volatility of PEG under the experimental conditions is negligible. Furthermore, the PEG elimination in the electro-plating solution by virtue of sole UV radiation has tested as insignificant. However, with the synergistic effect of ozonation with UV radiation, the PEG removal is found remarkable. The enhanced phenomenon results from the free radical reactions of highly active oxidants such as hydroxyl radicals produced because of the ozone photolysis reactions.
The degradations of PEG and PEG-like structure substances by the ozonation without UV radiation in the aqueous solution have been studied by Suzuki (1976) and Andreozzi et al. (1996a). The occurrence of intermediates such as glycolic al-dehyde, glycolic acid derivatives, and compounds with a ter-minal hydroxyl group and esters was noted. The reaction rate expressions of ozone A and PEG-like substances B in the
JOURNAL OF ENVIRONMENTAL ENGINEERING / OCTOBER 2001 / 913
FIG. 9. Concentration Variations of CTOCand CALbof PEG Ozonation with UV Radiation of 57.6 W/m2
in Electroplating Solution of Batch System [Symbols: Experiments; Lines: Prediction: (a) CTOC: R
2
= 0.985; (b) CALb: R
2
= 0.985] FIG. 8. Concentration Variations of CTOCand CALbof PEG Ozonation
with UV Radiation of 31.1 W/m2
in Electroplating Solution of Batch System [Symbols: Experiments; Lines: Prediction: (a) CTOC: R
2
= 0.991; (b) CALb: R
2
= 0.994]
ous solution were described as⫺dCA/dt =⫺dCB/dt = kBCACB
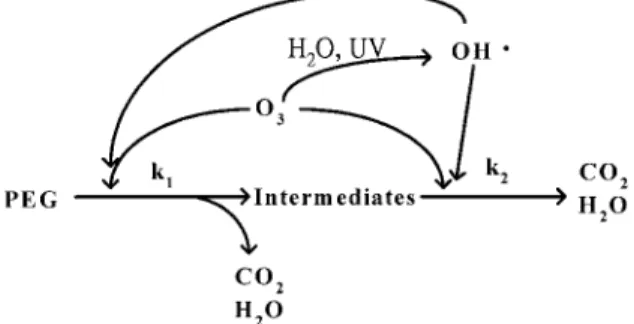
(Andreozzi et al. 1996a). In the ozonation process of other organics such as phenol (Andreozzi et al. 1996b) and chloro-phenol (Hautaniemi et al. 1998), and some solutes such as 2-propanol, o-xylene, toluene, and benzene (Hoigne´ and Bader 1983), the reaction rates have been reported to be first orders with respect to ozone, reactants, and intermediates. These find-ings support that the ozonation reaction rates may be generally considered first orders with respect to ozone A, reactant B, and intermediates int formed during ozonation (Gurol 1985). Based on the above works, one may propose a two-step action model for the reactions of ozone with PEG and its re-action intermediates (for example: glycolic acid or glycolic aldehyde). The simplified scheme of the decomposition path-ways of PEG ozonation with UV radiation is
It is apparent that the PEG decomposition in the O3/UV
process includes direct oxidation by means of ozone and in-direct oxidation by means of hydroxyl radicals. In the acidic
condition, hydroxyl radicals (OH⭈) are generated mainly from
the ozone photolysis reaction. Referring to the works of Gurol (1985) and Hautaniemi et al. (1998), one has the following rate expressions for ozone A, PEG B, and intermediates int:
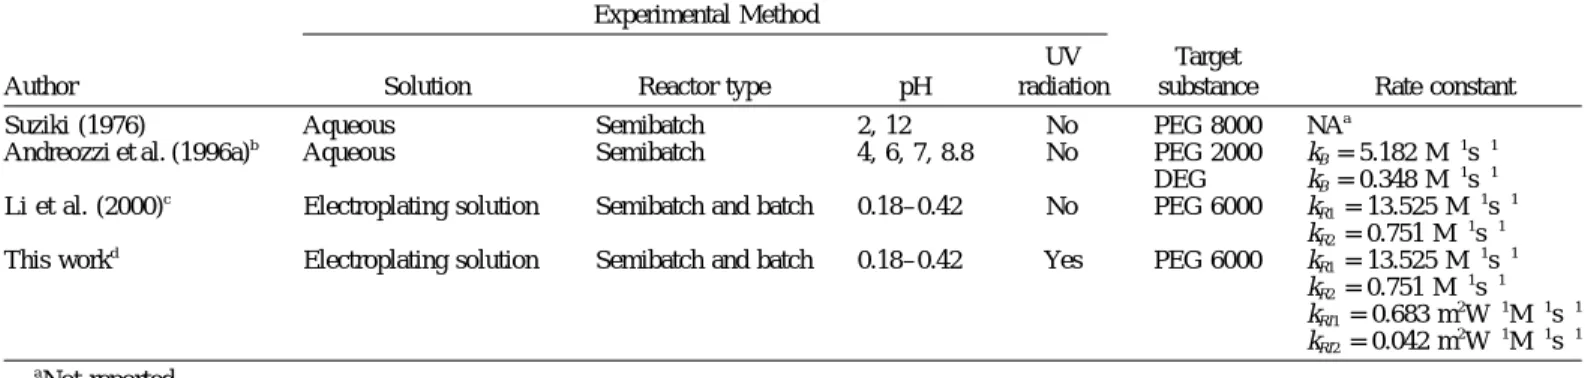
TABLE 2. Comparison of Ozonation Kinetic Expressions and Experimental Methods of PEG Removal between This Work and Others
Author
Experimental Method
Solution Reactor type pH
UV radiation
Target
substance Rate constant
Suziki (1976) Aqueous Semibatch 2, 12 No PEG 8000 NAa
Andreozzi et al. (1996a)b Aqueous Semibatch 4, 6, 7, 8.8 No PEG 2000
DEG
kB= 5.182 M⫺1s⫺1
kB= 0.348 M⫺1s⫺1 Li et al. (2000)c
Electroplating solution Semibatch and batch 0.18–0.42 No PEG 6000 kR1= 13.525 M⫺1s⫺1
kR2= 0.751 M⫺1s⫺1 This workd
Electroplating solution Semibatch and batch 0.18–0.42 Yes PEG 6000 kR1= 13.525 M⫺1s⫺1
kR2= 0.751 M⫺1s⫺1 kRI1= 0.683 m 2 W⫺1M⫺1s⫺1 kRI2= 0.042 m 2W⫺1M⫺1s⫺1 a Not reported. bdC
B/dt =⫺kBCACB, CAand CB= liquid concentrations of ozone and PEG or DEG.
c
dCB/dt =⫺kR1CACB, dCI/dt = kR1CACB⫺ kR2CACI, CI= liquid concentration of intermediates.
d
dCB/dt =⫺(kR1⫹ kRI1[Iuv])CACB, dCI/dt = (kR1⫹ kRI1[Iuv])CACb⫺ (kR2⫹ kRI2[Iuv]CACI.
r (=dCA ALb/dt) =⫺k CA ALb⫺ k C C1 ALb BLb⫺ k C C2 ALb ILb (7) r (=dCB BLb/dt) =⫺k C C1 ALb BLb (8) rint(=dCILb/dt) = k C1 ALbCBLb⫺ k C C2 ALb ILb (9)
with kA = kAm ⫹ k [I ],I uv k1 = kR1 ⫹ kRI1[I ],uv and k2 = kR2 ⫹
kRI2[I ].uv
The concentration of TOC in the electroplating solution is
CTOC=␣CBLb⫹ CILb (10)
The applicable initial conditions of the system at t = 0 are
CILb= 0; CBLb= CBLb0; CALb= CALb0; CTOC= CTOC0=␣CBLb0 (11)
The initial concentration of PEG is 30 mg/L, which is
equivalent to TOC of 16.3 mg/L. The values of␣, , kR1, kR2
were obtained by Li et al. (2000) as 271.7 MM⫺1, 155 MM⫺1,
13.525 M⫺1s⫺1, and 0.751 M⫺1s⫺1, respectively. The variations
of CTOC and CALb under different experimental conditions are
measured at successive reaction time intervals. Solving for (7) – (11) by the fourth-order Runge-Kutta method with the Turbo C program, one may obtain the predicted values with
presumed kinetics parameters (rate constants: kRI1 and kRI2).
The values of kRI1 and kRI2 are estimated by comparing the
predicted results with the experimental data with minimum differences. The simulation procedures are shown in Fig. 6.
As a result, kRI1 and kRI2 are determined as 0.683 and 0.042
m2
W⫺1M⫺1s⫺1. It is obvious that the reaction rate constants of PEG (kR1and kRI1) are greater than those of intermediates (kR2
and kRI2). The findings are consistent with the results of
An-dreozzi et al. (1996a) that the intermediates of PEG had lower ozonation reactivity than PEG. Figs. 7 – 9 compare the pre-dicted results of the two-step reaction model with experimental data, indicating good agreements. The TOC removal efficiency increases with UV radiation intensity with the same initial
ozone dosage (CALb0 = 4.24 mg/L). Thus, the UV
radia-tion enhances the PEG decomposiradia-tion rate. The reacradia-tion rate expressions of the concentrations of the liquid phase ozone
CALb, PEG CBLb, and intermediates CILb are rA (=dCALb/dt) =
⫺(0.0036 ⫹ 4.654 ⫻ 10⫺5[I
uv])CALb⫺ (13.525 ⫹ 0.683[Iuv])⭈
CALbCBLb ⫺ (0.751 ⫹ 0.042[Iuv])CALbCILb; rB (=dCBLb/dt) =
⫺(13.525 ⫹ 0.683[Iuv])CALbCBLb; and rint(=dCILb/dt) = (13.525
⫹ 0.683[Iuv])CALbCBLb ⫺ (0.751 ⫹ 0.042[Iuv])CALbCILb. These
reaction rate expressions are useful and referable for the proper design of the ozonation system with UV radiation for the treat-ment of PEG in the PWB electroplating solution.
Note that the values of kR1(13.525 M⫺1s⫺1) and kR2(0.751
M⫺1s⫺1) for the sole ozonation of PEG 5000 – 7000 in the elec-troplating solution studied by Li et al. (2000) are about 2 times
those of kB of PEG 2000 (5.182 M⫺s⫺1) and DEG (0.348
M⫺1s⫺1) in the aqueous solution reported by Andreozzi et al.
(1996a), as shown in Table 2. This may be due to the high ionic strength of the electroplating solution. Table 2 also com-pares the results of this work with those of other related stud-ies. The results clearly indicated that the intermediates are more refractory than PEG.
Further noted is that H2O2/UV or other advanced oxidation
processes with the addition of OH⫺ may give higher removal
of PEG than O3/UV because of the generation of more
hy-droxyl radicals. Nevertheless, the application of O3/UV
with-out changing the substrate recipe of the electroplating solution is preferred for the reutilization purpose. The cost of the power
consumption of generating O3is vital for adopting the O3/UV.
CONCLUSIONS
Ozonation combined with UV radiation is an effective way to remove PEG in the electroplating solution. The ozone pho-tolysis reaction rate is proportional to the dissolved ozone con-centration and UV radiation intensity. The mineralization rate of PEG ozonation is accelerated by the UV radiation. The following conclusions may be drawn:
• The kinetic expression of ozone A decomposition reaction with UV radiation in the acidic electroplating solution has been established. The results give the reaction rate ex-pression as rA(=dCALb/dt) =⫺(kAm⫹ kI[Iuv])CALb, with kAm
= 0.0036 s⫺1and kI= 4.654 ⫻ 10
⫺5s⫺1/(Wm⫺2).
• In PEG B ozonation with UV radiation, the reaction ki-netics may be expressed by a two-step reaction mecha-nism involving PEG and intermediates int. The predicted results of CALband CTOCagree with the experimental data.
• The kinetic equations of PEG ozonation with UV
radia-tion may be expressed as rA (=dCALb/dt) = ⫺(0.0036 ⫹
4.654 ⫻ 10⫺5[Iuv])CALb ⫺ (13.525 ⫹ 0.683[Iuv])CALbCBLb
⫺ (0.751 ⫹ 0.042[Iuv])CALbCILb; rB(=dCBLb/dt) =⫺(13.525
⫹ 0.683[Iuv])CALbCBLb; and rint (=dCILb/dt) = (13.525 ⫹
0.683[Iuv]CALbCBLb⫺ (0.751 ⫹ 0.042[Iuv])CALbCILb.
• The reactivity of ozonation of PEG is higher than that of intermediates.
ACKNOWLEDGMENTS
This study was supported by the National Science Council of Taiwan under Grant No. NSC 89-2211-E-002-025.
REFERENCES
Andreozzi, R., Caprio, V., and Insola, A. (1996a). ‘‘Kinetics and mech-anisms of polyethylene glycol fragmentation by ozone in aqueous so-lution.’’ Water Res., 30(12), 2955–2960.
Andreozzi, R., Caprio, V., Insola, A., and Tufano, V. (1996b). ‘‘Measuring
JOURNAL OF ENVIRONMENTAL ENGINEERING / OCTOBER 2001 / 915
ozonation rate constants in gas-liquid reactors under the kinetic-diffu-sional transition regime.’’ Chem. Engrg. Communications, 143, 195– 204.
Bader, H., and Hoigne, J. (1981). ‘‘Determination of ozone in water by the indigo method.’’ Water Res., 15(4), 449–456.
Beltra´n, F. J., and Alvarez, P. (1996). ‘‘Rate constant determination of ozone-organic fast reactions in water using an agitated cell.’’ J. Envir.
Sci. Health, A31(5), 1159–1178.
Chang, C. Y., et al. (1996). ‘‘Mass transfer aspect of ozone absorption and decomposition in aqueous solution with ultraviolet radiation.’’
Tox-icological and Envir. Chem., 57, 37–52.
Fang, C. L. (1996). General concepts of additives in the electroplating
solution, Finishing Science Publishing Co., Taipei, Taiwan.
Gurol, M. D. (1985). ‘‘Factors controlling the removal of organic pollut-ants in ozone reactors.’’ J. AWWA, 77(8), 55–60.
Gurol, M. D., and Singer, P. C. (1982). ‘‘Kinetics of ozone decomposi-tion: A dynamic approach.’’ Envir. Sci. and Technol., 16(7), 377–383. Hautaniemi, M., Kallas, J., Munter, R., and Trapido, M. (1998). ‘‘Mod-eling of chlorophenol treatment in aqueous solutions. 1. Ozonation and ozonation combined with UV radiation under acidic conditions.’’ Ozone
Sci. and Engrg., 20(4), 259–282.
Hewes, C. G., and Davison, R. R. (1971). ‘‘Kinetics of ozone decom-position and reaction with organics in water.’’ AIChE J., 17(1), 141– 147.
Hoigne´, J., and Bader, H. (1983). ‘‘Rate constants of reactions of ozone with organic and inorganic compounds in water: I. Non-dissociation organic compounds.’’ Water Res., 17(2), 173–183.
Huang, T. C., and Chen, D. H. (1993). ‘‘Kinetics of ozone decomposition in aqueous solution with and without ultraviolet radiation.’’ J. Chinese
Inst. Chem. Engrg. (Taiwan), 24(4), 207–215.
Ikemizu, J., Morooka, S., and Kato, Y. (1987). ‘‘Decomposition rate of ozone in water with ultraviolet radiation.’’ J. Chem. Engrg. Japan, 20(1), 77–81.
Ku, Y., Su, W. J., and Shen, Y. S. (1996). ‘‘Decomposition kinetics of ozone in aqueous solution.’’ Industrial Engrg. Chem. Res., 35(10), 3369–3374.
Kuo, C. H., and Huang, C. H. (1995). ‘‘Aqueous phase ozonation of cholorophenols.’’ J. Haz. Mat., 41(1), 31–45.
Leifer, A. (1988). The kinetics of environmental aquatic photochemistry:
Theory and Practice, American Chemical Society, Washington, D.C.
Li, H., et al. (2000). ‘‘Kinetics of ozonation of polyethylene glycol in printed wiring board electroplating solution.’’ J. Chinese I. Envir.
Engrg. (Taiwan), 10(1), 69–75.
McCabe, W. L., Smith, J. C., and Harriott, P. (1993). Unit operations of
chemical engineering, 5 Ed., McGraw-Hill, New York.
Peyton, G. R., and Glaze, W. H. (1998). ‘‘Destruction of pollutants in water with ozone in combination with ultraviolet radiation. 3. Photol-ysis of aqueous ozone.’’ Envir. Sci. and Technol., 22(7), 761–767. Prengle, H. W. (1983). ‘‘Experimental rate constants and reactor
consid-erations for the destruction of micropollutants and trihalomethane pre-cursors by ozone with ultraviolet radiation.’’ Envir. Sci. and Technol., 17(12), 743–747.
Rankness, K., et al. (1996). ‘‘Guideline for measurement of ozone con-centration in the process gas from an ozone generator.’’ Ozone Sci. and
Engrg., 18(3), 209–229.
Sotelo, J. L., Beltra´n, F. J., Benı´tez, F. J., and Beltra´n-Heredia, J. (1987). ‘‘Ozone decomposition in water: Kinetic study.’’ Ind. Eng. Chem. Res., 26(1), 39–43.
Suzuki, J. (1976). ‘‘Study on ozone treatment of water-soluble polymers. I. Ozone degradation of polyethylene glycol in water.’’ J. Appl. Polymer
Sci., 20(1), 93–103.
Waste recovery and pollution prevention of the electroplating business.
(1997). Industrial Devel. Bureau, Ministry of Economic Affairs, Taipei, Taiwan.
NOTATION
The following symbols are used in this paper:
CA, CALb = concentration of A or ozone in bulk liquid (M or mg/L);
CAGe = gas concentration of ozone in free volume (M or mg/ NL);
CAGe, ss = gas concentration of ozone in free volume at steady state (M or mg/NL);
CAGi0 = gas concentration of ozone of inlet gas (M or mg/ NL);
CALb, ss = CALbat steady state (M or mg/L);
CALb0 = concentration of ozone in bulk liquid at time = 0 (M or mg/L);
CB, CBLb = concentration of B or PEG in bulk liquid (M or mg/L);
CBLb0 = initial concentration of PEG in bulk liquid (M or mg/L);
Ce = experimental concentration data (M or mg/L);
Ce = average value of experimental concentration data (M or mg/L);
CILb = concentration of intermediates in reaction of PEG decomposed by ozonation (M);
Cp = predicted concentration values (M or mg/L);
CTOC = concentration of TOC (M or mg/L); CTOC0 = initial concentration of TOC (M or mg/L);
[Iuv] = light intensity of UV lamp (W/m 2
);
i = reaction order of UV radiation of ozone photolysis reaction;
int = intermediates produced by ozonation reaction; kA = reaction rate constant of ozone decomposition, =kAm
⫹ kI[Iuv] (s⫺1);
kAm = acidic decomposition rate constant of ozone [(M) 1⫺m s⫺1];
kaI = reaction rate constant reported by Ikemizu et al. (1987) [(M)⫺0.5s⫺1];
kaK = decomposition rate constant of ozone reported by Ku et al. (1996) [(M)⫺0.5s⫺1];
kB = reaction rate constant of ⫺dCB/dt =
n
k C CB A B (M⫺ns⫺1);
kbI = reaction rate constant reported by Ikemizu et al. (1987) (s⫺1);
kI = reaction rate constant of ozone photolysis [(Wm⫺2)⫺i(M)1⫺us⫺1];
kII = reaction rate constant of ozone photolysis reported by Ikemizu et al. (1987) [(Wm⫺2)⫺1s⫺1];
kIK = reaction rate constant of ozone photolysis reported by Ku et al. (1996) [(Wm⫺2)⫺0.9(M)⫺0.5s⫺1]; kIu = reaction rate constant of ozone photolysis in (1)
[(M)1⫺us⫺1];
kR1 = reaction rate constant of PEG reacted with ozone (M⫺1s⫺1);
kR2 = reaction rate constant of intermediates reacted with ozone (M⫺1s⫺1);
kRI1 = reaction rate constant of PEG reacted with OH⭈ in-duced by UV (m2
W⫺1M⫺1s⫺1);
kRI2 = reaction rate constant of intermediates reacted with OH⭈ induced by UV (m2
W⫺1M⫺1s⫺1);
k1 = PEG decomposition reaction rate constant (M⫺1s⫺1); k2 = intermediates decomposition reaction rate constant
(M⫺1s⫺1);
m = acidic decomposition reaction order of ozone of (1) or (2);
n = reaction order of kinetic expression of ⫺dCB/dt = or (1);
n
k C C ,B A B
[OH⫺] = molar concentration of OH⫺ions (M);
[O3] = molar concentration of dissolved liquid ozone (M); QG = ozone-containing gas flow rate (L s⫺1);
rA, rB, rint = reaction rates of formations of A, B, and int (Ms⫺1, Ms⫺1, Ms⫺1);
rAd = reaction rate of ozone self-decomposition without UV radiation (Ms⫺1);
rAu = reaction rate of ozone photolysis reaction (Ms⫺1);
R2
= determination coefficient, 1⫺ [兺 (Ce⫺ Cp)2 /兺 (Ce ⫺ Ce)2 ]; r2 = correlation coefficient; T = temperature (K); t = reaction time (s);
u = reaction order of ozone photolysis reaction; VL = liquid volume (L);
␣ = initial ratio of concentrations of TOC to PEG (M M⫺1); and
 = ratio of concentrations of TOC associated with in-termediates int to int (M M⫺1).