行政院國家科學委員會補助專題研究計畫
□ 成 果 報 告 ■期中進度報告(計畫名稱)
高尿酸血症對心血管疾病的前瞻性風險
研究
計畫類別:■ 個別型計畫 □ 整合型計畫
計畫編號:NSC 97-2314-B-039-010-MY3
執行期間:97 年 8 月 01 日至 100 年 7 月 31 日
計畫主持人:
陳俊宏
共同主持人:潘文涵
計畫參與人員:鄒宛玲、莊紹源、葉文婷
成果報告類型(依經費核定清單規定繳交):■精簡報告 □完整
報告
本成果報告包括以下應繳交之附件:
□赴國外出差或研習心得報告一份
□赴大陸地區出差或研習心得報告一份
■出席國際學術會議心得報告及發表之論文各一份
Chen JH, Pan WH. Severity of different metabolic risk impact on gout incidence. (2009 EULAR Congress Session: Gout-Could we do better?) Ann Rheum Dis. 2009;68 (suppl3): 108
□國際合作研究計畫國外研究報告書一份
執行單位:中國醫藥大學
報告內容
INTRODUCTION
Prevalence of gouty arthritis, a common chronic arthritis, has steadily increased in different parts of the world1. Although hyperuricemia has been documented as a key precipitating factor of gout in the Normative Aging Study2 and the UK General Practice Research Database from 1990-19953; aging of the world population, growing prevalence of obesity and metabolic syndrome have been indicted for the worldwide increase of gout incidence and prevalence4.
The Third National Health and Nutrition Examination Survey (NHANES III) reported a remarkably high prevalence of metabolic syndrome in individuals with hyperuricemia or gout5-6 and have also found a close association between serum uric acid (sUA) level and the prevalence of metabolic syndrome7. Recent finding of an inverse correlation between sUA and insulin sensitivity8 have suggested
hyperuricemia as a possible marker of insulin resistance9-10 or a reliable indicator of the “pre-metabolic syndrome”11-13. These findings raise attention on the role of metabolic syndrome on gout development6.
Gender difference has been observed for the age-hyperuricemia and age-gout relationships14. However, most gout-related reports studied men as contrast to the limited description of gout on women14-17. Previous research indicates that women not only tend to develop gout later in life, but also use more diuretics, and have more co-morbidities of obesity, hypertension, dyslipidemia, cardiovascular disease (CVD), peripheral artery disease, diabetes mellitus, renal insufficiency, and habitual alcoholic intake14, 18. Therefore, this study sought to determine the gender-specific risk of gout in relation to the abnormalities of various metabolic risk factors, including sUA, cholesterol, triglyceride, glucose, blood pressure and overweight.
METHODS
Study population. This prospective cohort study used data collected from
1994-1996 to December 2002 with physical examination carried out and questionnaire administered in the privately-owned nationwide MJ Health Screening Centers in Taiwan19-21. Detailed description of the data for those health examinees and their socio-economic distribution has been described in our recent report20.
Exclusion criteria. Data from 137,532 participants aged 18 years and above
were included after excluding 0.46% of the original cohort due to unclear data. We further excluded subjects who did not have registered data with the NHI program (n=2,450), died before 1997 (n=612), had self-reported gout history (n=1,725) or were suspected to have had gout according to the NHI database during 1994-96 (n=189; see later description of gout definition). Data from a total of 132,556 subjects (60,181 men and 72,375 women) were analyzed. The Institutional Review Boards of both the China Medical University Hospital in Taichung and the Academia Sinica in Taipei, Taiwan approved the study.
Baseline characteristics and morbidities defined with clinical and chemistry data. Health examination and questionnaire data were used as baseline information
for follow-up20. Plasma uric acid, cholesterol, triglyceride, and glucose were measured enzymatically using Hitachi 7150 autoanalyzer (Tokyo, Japan). Hyperuricemia was defined as sUA >6 mg/dl (0.354 mmol/L), overweight as body mass index (BMI) >24 kg/m2 22, high blood pressure as systolic blood pressure (SBP) >130 mmHg or diastolic blood pressure (DBP) >85 mmHg, hyperglycemia as fasting
blood sugar >100 mg/dl (5.5 mmol/L), hypercholesterolemia as cholesterol >200 mg/dl (51.8 mmol/L), and hyper-triglyceridemia as triglyceride >150 mg/dl (16.9 mmol/L), respectively.
Incremental levels of sUA were stratified into <4.5 (reference), 4.5-5.9, 6.0-7.4, and ≧7.5 mg/dl, BMI into <24 (reference), 24-26.9, 27-29.9, and ≧30 Kg/m2; cholesterol into <150 (reference), 150-199, 200-239, and ≧240 mg/dl; triglyceride into <150 (reference), 150-199, 200-239, and ≧240 mg/dl; blood pressure into <130/85 (reference), 130/85-139/89, 140/90-159/94, and ≧ 160/95 mmHg; and glucose into <100 (reference), 100-125, 126-179, and ≧180 mg/dl.
Outcome information: National Health Insurance (NHI) dataset and definition of incident gout. Use was made of claim data from the NHI that began in
mid-1995. This administrative database was a pharmaco-medical claim cost record which has provided a longitudinal follow-up resource for epidemiologic research23. Clinical gout diagnosis was recorded using either the ninth version of the International Classification of Disease (ICD-9) code in the NHI database. The codes of gout (ICD-9: 274.x) were searched from January 1, 1994 to December 31, 2002. The criteria for gout in the MJ participants were (1) the diagnostic code of gout assigned in at least two visits to the physicians or rheumatologists, and (2) both colchicine and urate-lowering drugs (i.e. allopurinol, probenecid, sulfinpyrazone, or benzbromarone) prescribed in these visits. Subjects with gout developed prior to the end of 1996 were considered prevalent gout and excluded. Gout attacks developed after the beginning of 1997 were considered as incident event. The onset time of gout was defined as the initial colchicine prescription to the patient. Rheumatologists diagnosed gout endpoints was used for a sub-group analysis which was served as a validation study for the original analysis.
Statistical analysis. Baseline characteristics between men and women or between
gout-free and incident-gout participants were tested by two-sample t-test or chi-square test. The age-standardized rate of gout was calculated according to the Taiwanese population structure at the end of year 2000 by five-year age groups. Hazard ratio (HR) of each metabolic risk factor on the incidence of gout in men and/or women was assessed by Cox proportional hazard model. In multivariate models, (1) the effects of age; and (2) those of age, hyperuricemia, hypercholesterolemia, hyper-triglyceridemia, hyperglycemia, high blood pressure, and overweight were adjusted. The interaction between gender and the aforementioned covariates was also tested. All HRs were provided with 95% confidence intervals (CI).
Mean gout incidence below cut-point of individual metabolic factor obtained from our study was used as the expected risk for subtraction in the process of estimating population-attributable risk (PAR)24-25. We used PAR to determine the percentage of gout cases in this population that theoretically would not have occurred if these metabolic risk factors had been lowered to the given levels. The degrees of impact from hyperuricemia, individual metabolic disorders, and different degrees of metabolic syndrome on gout were assessed by comparing above PARs. PAR was also estimated for (1) having hyperuricemia only, (2) at least one metabolic syndrome component, or (3) 3 of any metabolic risk factors, and (4) hyperuricemia combined with 3 metabolic factors. The statistical package SAS 9.01 (SAS Institute, Cary, NC) was used for analysis.
RESULTS
characteristics of the participants by genders. After a mean follow-up of 7.31±0.99 years, 1,606 clinical gout subjects (1,341 males and 265 females) were defined by the physicians’ visit in the original study of the 132,556 individuals 18 years-old (60,181 men and 72,375 women). The standardized incidence of gout was 1.69 per 1,000 person-years (PYs) for adults aged 18 and above. The incidence in men was 3.09 per 1,000 PYs, which was six times higher than that in women (0.53 per 1,000 PYs). When we focused on older people (>60 years old), we found higher incidence of gout; however, the male to female ratio of incident gout reduced to three times higher in men than women (5.18 per 1,000 PYs for men and 1.69 per 1,000 PYs for women;
p<0.001).
Among the physician-defined gout patients, the proportion of men was higher (83.5%) than women. The mean baseline age of participants who developed gout (49.8 years) was higher than that of participants without gout (42.3 years) (Table 2A). The mean onset age for gout was 62.3 years in women, which was older than that in men (52.3 years) (Table 1). Among the 238 gout subjects clinically defined by rheumatologists (207 males and 31 females), the proportion of male gout were 87.0% (Table 2B) and the mean age of gout onset was 51.9 years in men, and 64.4 years in women, respectively (no tabulated data shown). Both were comparable to the results derived from the original study (Table 2A). The comparability between both studies was shown not only in the baseline characteristics of the gout and gout-free participants (Tables 2) but also in the dose-responsive relations of gout with incremental levels of sUA, BMI, triglyceride, cholesterol, and blood pressure (Table 3).
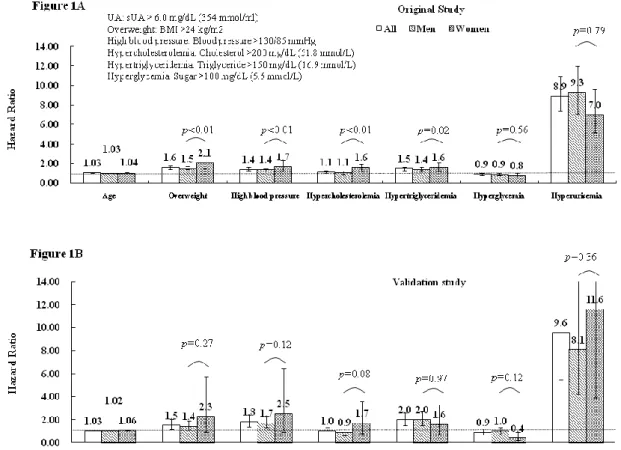
Effects of hyperuricemia and metabolic risk factors on gout occurrence.
Among all metabolic risk factors, hyperuricemia had the highest impact on gout (Figure 1A). Although the HR was higher in men (9.3; 95% CI, 7.1-12.0) than in women (7.0; 95% CI, 5.2-9.6), the gender difference was not statistically significant by multivariate regression model (p for gender-hyperuricemia interaction = 0.79). Nevertheless, the gender difference was significantly demonstrated for overweight, high blood pressure, hypercholesterolemia, and hyper-triglyceridemia, with respective HR (95% CI) higher in women [ 2.1 (1.5-2.8), 1.7 (1.2-2.3), 1.6 (1.2-2.0), and 1.6 (1.3-2.1)] than in men [1.5 (1.4-1.7), 1.4 (1.2-1.5), 1.1 (0.9-1.2), and 1.4 (1.3-1.6); all
p for gender-metabolic disorder interactions < 0.05), respectively. In the validation
study (Figure 1B) gender difference was similar but not statistically significant because there were only 31 female gout subjects defined by the rheumatologists.
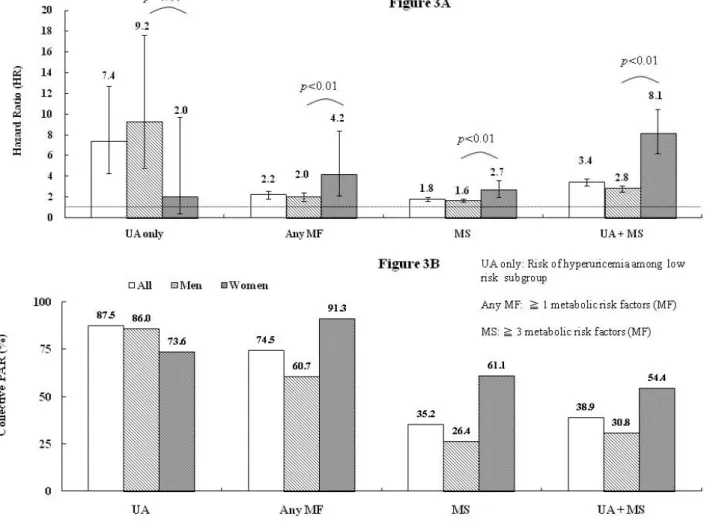
We further studied the low risk subgroup with normal body weight, blood pressure, lipid and glucose levels, (n=41,351; 13,520 men and 27,831 women). HR of hyperuricemia on gout was 9.2 (95% CI, 4.8-17.6) in men, in contrast to the statistically insignificant relative risk in women (2.0; 95% CI, 0.4-9.7; p=0.11 for gender interaction) (Figure 3A). To further compare the contributions of metabolic factors to the risk of gout between gender, we demonstrated in women that the HRs of at least one and that of ≥3 factors of any of the aforementioned metabolic risk were 4.2 (95% CI, 2.1-8.4) and 2.7 (95% CI, 2.0-3.6), respectively, which were significantly higher than those in males (2.0; 95% CI, 1.6-2.4 and 1.6; 95% CI, 1.5-1.8, respectively). Furthermore, the HR of women with a combined condition of hyperuricemia and ≥3 factors of any metabolic risk (8.1; 95% CI, 6.2-10.5) were also statistically higher than that of men (2.8; 95% CI, 2.5-3.1).
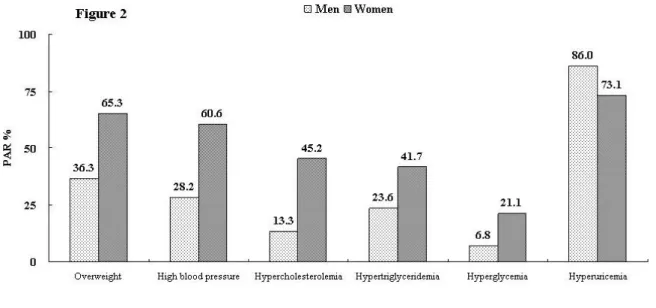
Population-attributable risk of hyperuricemia and other individual metabolic risk factor on gout. Presented in figure 2 is the proportion of incident gout that might
pressure, glucose, cholesterol, triglyceride are lowered below clinical cut-points. Hyperuricemia was the most influential risk factor. Controlling sUA to below 6.0 mg/dl was estimated to account for 87.5% of incident gout prevention. The hyperuricemia control was slightly more effective in men (86.0%) than in women (73.1%). On the other hand, the PAR of overweight in women was 65.3%, which was higher than that in men (36.3%). This implied that 65.3% of gout may be attributable to overweight in women and 36.3% in men. Similarly, the PAR of metabolic risk factors, including high blood pressure, hypercholesterolemia, hyper-triglyceridemia, and hyperglycemia were all higher in women (corresponding PAR of 60.6%, 45.2%, 41.7%, and 21.1%, respectively) than in men (28.2%, 13.3%, 23.6%, and 6.8%, respectively). Moreover, the PAR of having any one or more metabolic risk factors were also higher in women (91.3%) than in men (60.7%) (Figure 3B), which means that if the population’s body weight, blood pressure, lipid and glucose levels had been controlled within normal range, 91.3% of women and 60.7% of men can avoid gout. Furthermore, the PAR for usually defined metabolic syndrome was much higher in females than in males, regardless of whether hyperuricemia is combined or not.
DISCUSSION
The present study confirmed as expected that the risk of hyperuricemia on gout occurrence is the highest among all studied metabolic risk factors, and further demonstrated that the impact of metabolic syndrome components on gout attack are higher in women than in men, as illustrated by their relatively higher HR and PAR. From the perspective of PAR, metabolic syndrome can approximately explain more than 50% of the gout incidence in women and around 30% in men, regardless of the status of hyperuricemia. Further extending this perspective, if the population’s body weight, blood pressure, lipid and glucose levels are all controlled within normal range, 91.3% of women and 60.7% of men may have avoided gouty attack. This study shows metabolic syndrome or individual metabolic component tends to be more important risk factors for gout development in women than in men.
While a recent report of Framingham Heart Study highlighted the importance of overweight and hypertension as risk factors for gout in women18, the present study further demonstrated significant influences of other related metabolic risk factors in women, including hypercholesterolemia, hyper-triglyceridemia, and hyperglycemia. It is worth noting that although the prevalence of overweight in Taiwan (43.8% for men and 33.9% for women) was not as high as that in Caucasian (60% for men, and 40% for women)26, estimates of the female to male relative risk of overweight (0.77) on gout were similar in our study and in the Framingham Heart Study (0.73).
The degrees of impact of individual metabolic factors on gout incidence in the current study is comparable to what previously reported by the NHANES III study6 and American Health Professionals Follow-up Study26. Other than hyperuricemia, the importance of metabolic risk factors on incident gout follows the order of overweight, hyper-triglyceridemia, high blood pressure, hypercholesterolemia, and hyperglycemia. Among those who are free from metabolic disorders, hyperuricemia is still the most influential risk factor on gout occurrence, especially in men (Figure 3A). On the other hand, the risks of various metabolic morbidities on gout incidence are higher in women than in men (Figure 1). Therefore, controlling metabolic co-morbidities may be more critical or at least equally important as sUA control in women (Figure 3)14.
We noticed that the mean age of this Taiwanese cohort was younger (42.5 year-old in men and 42.3 year-old in women) as compared to other cohorts3, 18, 27. Due to the younger onset of gout in males, the sex ratio of gout incidence in men was 6
times higher than that in women. Nevertheless, when we focused on the older people, we found the incidence was 5.18 per 1,000 PYs in men and 1.69 per 1,000 PYs in women, and the sex-ratio reduced to 3; both are comparable to previous reports16-18.
The explanation of greater gout incidence in men14-15 may be attributable to higher mean sUA level, and higher prevalence of hyperuricemia in men (6.8 mg/dl and 67.8%) than in women (5.2 mg/dl and 21.7%)(Table 1). Estrogen may be responsible for the enhanced uricosuric effect on renal tubules and the lower incidence of hyperuricemia and gout in pre-menopausal women. This can also explain the later onset time of gout in women15. A greater impact of insulin on renal uric acid resorption in women, and a higher prevalence of abdominal obesity with insulin resistance in elderly women further evidence a central role of insulin resistance in the development of hyperuricemia8 and a greater role of metabolic co-morbidities in women with gout than in their male counterpart14. To assess the potential effect of glomerular filtration of urate in our model, we did a subgroup analysis on individuals who had creatinine data. The multivariate HRs of individual risk factors did not change after including glomerular filtration rate (GFR) into the Cox regression model (see supplementary figure).
According to an American study28, using administrative claim data with gout-related code assigned in at least two ambulatory visits in gout study achieved a positive predictive value of 61%, and evaluation by rheumatologists could substantially increase the positive predictive value to 92%. A relatively lower specificity in gout classification by using information from the National Health Insurance may be suspected. Since no information on chronic tophaceous gout or on acute arthritis with podagra has been provided by the NHI database, a subgroup analysis on gout subjects defined by rheumatologist was used to validate our findings. We found the respective metabolic characteristics by gout status (Table 2) and risk trends (Table 3) on gout incidence are comparable between the original and the validation studies. Furthermore, we included medical prescription data in defining gout in order to improve validity of gout diagnosis in this study. Since colchicine and urate-lowering drugs represent the most popular agents for treating chronic gout in Taiwan, and the non-steroidal anti-inflammatory drugs are primarily used to deal with acute arthritis, but not specifically for treating gouty arthritis; we included the former but not the latter in the definition. The criteria of incident gout defined by the current study may have underestimated gout incidence, but should not affect findings on the gender-specific or the overall relative risk on gout.
A gender difference concerning the impacts of hyperuricemia and metabolic co-morbidities on gout occurrence is shown in the present study. Although hyperuricemia has the greatest impact on gout development, the impacts of overweight, high blood pressure, hypercholesterolemia, and hyper-triglyceridemia as shown by HRs and PARs are all significantly higher in women than in men. In the subgroup analysis of participants free of metabolic risk factors, the HR of hyperuricemia on gout occurrence in women is not as prominent as in men. On the other hand, the importance of usually defined metabolic syndrome for incident gout in women again is evident, regardless of whether hyperuricemia is combined or not. This may suggest that controlling metabolic co-morbidities to prevent gout, especially among women, should not be overlooked, although clinical application warrants further investigation.
REFERENCES
1. Bieber JD, Terkeltaub RA. Gout: on the brink of novel therapeutic options for an ancient disease. Arthritis Rheum. 2004;50(8):2400-14.
2. Campion EW, Glynn RJ, DeLabry LO. Asymptomatic hyperuricemia. Risks and consequences in the Normative Aging Study. AM J Med. 1987;82(3):421-6. 3. Mikuls TR, Farrar JT, Bilker WB, et al. Gout epidemiology: results from the UK
General Practice Research Database, 1990-1999. Ann Rheum Dis. 2005;64(2):267-72.
4. Annemans L, Spaepen E, Gaskin M, et al. Gout in the UK and Germany: prevalence, comorbidities and management in general practice 2000-2005. Ann Rheum Dis. 2008;67(7):960-6.
5. Choi HK, Ford ES. Prevalence of the metabolic syndrome in individuals with hyperuricemia. Am J Med. 2007;120(5):442-7.
6. Choi HK, Ford ES, Li C, et al. Prevalence of the metabolic syndrome in patients with gout: the Third National Health and Nutrition Examination Survey. Arthritis Rheum. 2007;57(1):109-15.
7. Lin CS, Hung YJ, Chen GY, et al. A multicenter study of the association of serum uric acid, serum creatinine, and diuretic use in hypertensive patients. Int J Cardiol. 2010; [Epub ahead of print].
8. Choi HK, Ford ES. Haemoglobin A1c, fasting glucose, serum C-peptide and insulin resistance in relation to serum uric acid levels--the Third National Health and Nutrition Examination Survey. Rheumatology (Oxford). 2008;47(5):713-7. 9. Vuorin-Markkola H, Yki-Jarvonen H. Hyperuricemia and insulin-resistance. J
Clin Endocrinol Metab. 1994;78:25-9.
10. Choi HK, Curhan G. Independent impact of gout on mortality and risk for coronary heart disease. Circulation. 2007;116(8):894-900.
11. Denzer C, Muche R, Mayer H, et al. Serum uric acid levels in obese children and adolescents: linkage to testosterone levels and pre-metabolic syndrome. J Pediatr Endocrinol Metab. 2003;16(9):1225-32.
12. Fam AG. Gout, diet, and the insulin resistance syndrome. J Rheumatol. 2002;29:1350-5.
13. Jordan KM, Cameron JS, Snaith M, et al. British Society for Rheumatology and British Health Professionals in Rheumatology guideline for the management of gout. Rheumatology (Oxford). 2007;46(8):1372-4.
14. Harrold LR, Yood RA, Mikuls TR, et al. Sex differences in gout epidemiology: evaluation and treatment. Ann Rheum Dis. 2006;65(10):1368-72.
15. De Souza AW, Fernandes V, Ferrari AJ. Female gout: clinical and laboratory features. J Rheumatol. 2005;32(11):2186-8.
16. Lally EV, Ho G, Jr., Kaplan SR. The clinical spectrum of gouty arthritis in women. Arch Intern Med. 1986;146(11):2221-5.
17. Puig JG, Michan AD, Jimenez ML, et al. Female gout. Clinical spectrum and uric acid metabolism. Arch Intern Med. 1991;151(4):726-32.
18. Bhole V, de Vera M, Rahman MM, et al. Epidemiology of female gout: 52-Year follow-up of a prospective cohort. Arthritis Rheum. 2010;62(4):1069-76. 19. Wen CP, Cheng TY, Tsai MK, et al. All-cause mortality attributable to chronic
kidney disease: a prospective cohort study based on 462 293 adults in Taiwan. Lancet. 2008;371(9631):2173-82.
20. Chen JH, Chuang SY, Chen HJ, et al. Serum uric acid level as an independent risk factor for all-cause, cardiovascular, and ischemic stroke mortality: A Chinese cohort study. Arthritis Rheum. 2009;61(2):225-32.
21. Yang FY, Wahlqvist ML, Lee MS. Body mass index (BMI) as a major factor in the incidence of the metabolic syndrome and its constituents in unaffected Taiwanese from 1998 to 2002. Asia Pac J Clin Nutr. 2008;17(2):339-51. 22. Lu TH, Sun SM, Huang SM, et al. Mind your manners: quality of manner of
death certification among medical examiners and coroners in Taiwan. Am J Forensic Med Pathol. 2006;27(4):352-4.
23. Wen CP, Tsai SP, Chung WS. A 10-year experience with universal health
insurance in Taiwan: measuring changes in health and health disparity. Ann Intern Med. 2008;148(4):258-67.
24. Rothman KJ, Greenland S. Modern Epidemiology. 2nd ed. Philadelphia, Pa: Lippincott-Raven. 1998.
25. Woodward M. Epidemiology, study design and data analysis. 2nd ed. ed: CHAPMAN & HALL/CRC; 2004.
26. Choi HK, Atkinson K, Karlson EW, Curhan G. Obesity, weight change, hypertension, diuretic use, and risk of gout in men: the health professionals follow-up study. Arch Intern Med. 2005;165(7):742-8.
27. Arromdee E, Michet CJ, Crowson CS, et al. Epidemiology of gout: is the incidence rising? J Rheumatol. 2002;29(11):2403-6.
28. Harrold LR, Saag KG, Yood RA, et al. Validity of gout diagnoses in administrative data. Arthritis Rheum. 2007;57(1):103-8.
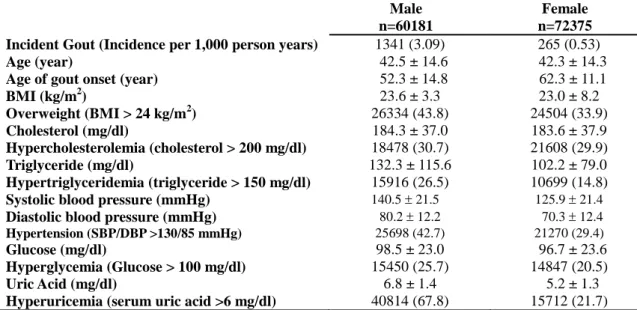
Table 1. Baseline characteristics of the participants in the MJ Health Screening Center,
stratified by gender.
Male Female
n=60181 n=72375
Incident Gout (Incidence per 1,000 person years) 1341 (3.09) 265 (0.53)
Age (year) 42.5 ± 14.6 42.3 ± 14.3
Age of gout onset (year) 52.3 ± 14.8 62.3 ± 11.1
BMI (kg/m2) 23.6 ± 3.3 23.0 ± 8.2 Overweight (BMI > 24 kg/m2) 26334 (43.8) 24504 (33.9) Cholesterol (mg/dl) 184.3 ± 37.0 183.6 ± 37.9 Hypercholesterolemia (cholesterol > 200 mg/dl) 18478 (30.7) 21608 (29.9) Triglyceride (mg/dl) 132.3 ± 115.6 102.2 ± 79.0 Hypertriglyceridemia (triglyceride > 150 mg/dl) 15916 (26.5) 10699 (14.8)
Systolic blood pressure (mmHg) 140.5 21.5 125.9 21.4
Diastolic blood pressure (mmHg) 80.2 12.2 70.3 12.4
Hypertension (SBP/DBP >130/85 mmHg) 25698 (42.7) 21270 (29.4)
Glucose (mg/dl) 98.5 ± 23.0 96.7 ± 23.6
Hyperglycemia (Glucose > 100 mg/dl) 15450 (25.7) 14847 (20.5)
Uric Acid (mg/dl) 6.8 ± 1.4 5.2 ± 1.3
Hyperuricemia (serum uric acid >6 mg/dl) 40814 (67.8) 15712 (21.7)
Values are meanSD or the percentage with a given condition.
All variables were tested and found significantly different between genders (p<0.01) by either two-sample t-test or 2 test.
(cholesterol 1 mg/dl = 0.0259 mmol/L; triglyceride 1 mg/dl = 0.0113 mmol/L; uric acid 1mg/dl = 0.059 mmol/L; glucose 1 mg/dl = 0.055 mmol/L)
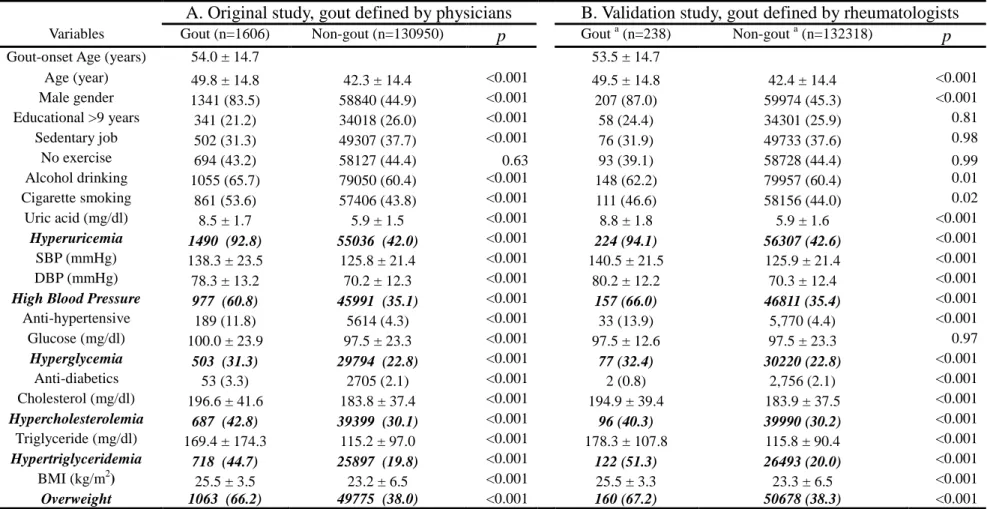
Table 2. Baseline characteristics of MJ participants who developed gout and those who did not (n=132556)
A. Original study, gout defined by physicians B. Validation study, gout defined by rheumatologists Variables Gout (n=1606) Non-gout (n=130950) p Gout a (n=238) Non-gout a (n=132318) p
Gout-onset Age (years) 54.0 ± 14.7 53.5 ± 14.7
Age (year) 49.8 ± 14.8 42.3 ± 14.4 <0.001 49.5 ± 14.8 42.4 ± 14.4 <0.001 Male gender 1341 (83.5) 58840 (44.9) <0.001 207 (87.0) 59974 (45.3) <0.001 Educational >9 years 341 (21.2) 34018 (26.0) <0.001 58 (24.4) 34301 (25.9) 0.81 Sedentary job 502 (31.3) 49307 (37.7) <0.001 76 (31.9) 49733 (37.6) 0.98 No exercise 694 (43.2) 58127 (44.4) 0.63 93 (39.1) 58728 (44.4) 0.99 Alcohol drinking 1055 (65.7) 79050 (60.4) <0.001 148 (62.2) 79957 (60.4) 0.01 Cigarette smoking 861 (53.6) 57406 (43.8) <0.001 111 (46.6) 58156 (44.0) 0.02 Uric acid (mg/dl) 8.5 ± 1.7 5.9 ± 1.5 <0.001 8.8 ± 1.8 5.9 ± 1.6 <0.001 Hyperuricemia 1490 (92.8) 55036 (42.0) <0.001 224 (94.1) 56307 (42.6) <0.001 SBP (mmHg) 138.3 ± 23.5 125.8 ± 21.4 <0.001 140.5 ± 21.5 125.9 ± 21.4 <0.001 DBP (mmHg) 78.3 ± 13.2 70.2 ± 12.3 <0.001 80.2 ± 12.2 70.3 ± 12.4 <0.001
High Blood Pressure 977 (60.8) 45991 (35.1) <0.001 157 (66.0) 46811 (35.4) <0.001
Anti-hypertensive 189 (11.8) 5614 (4.3) <0.001 33 (13.9) 5,770 (4.4) <0.001 Glucose (mg/dl) 100.0 ± 23.9 97.5 ± 23.3 <0.001 97.5 ± 12.6 97.5 ± 23.3 0.97 Hyperglycemia 503 (31.3) 29794 (22.8) <0.001 77 (32.4) 30220 (22.8) <0.001 Anti-diabetics 53 (3.3) 2705 (2.1) <0.001 2 (0.8) 2,756 (2.1) <0.001 Cholesterol (mg/dl) 196.6 ± 41.6 183.8 ± 37.4 <0.001 194.9 ± 39.4 183.9 ± 37.5 <0.001 Hypercholesterolemia 687 (42.8) 39399 (30.1) <0.001 96 (40.3) 39990 (30.2) <0.001 Triglyceride (mg/dl) 169.4 ± 174.3 115.2 ± 97.0 <0.001 178.3 ± 107.8 115.8 ± 90.4 <0.001 Hypertriglyceridemia 718 (44.7) 25897 (19.8) <0.001 122 (51.3) 26493 (20.0) <0.001 BMI (kg/m2) 25.5 ± 3.5 23.2 ± 6.5 <0.001 25.5 ± 3.3 23.3 ± 6.5 <0.001 Overweight 1063 (66.2) 49775 (38.0) <0.001 160 (67.2) 50678 (38.3) <0.001 a
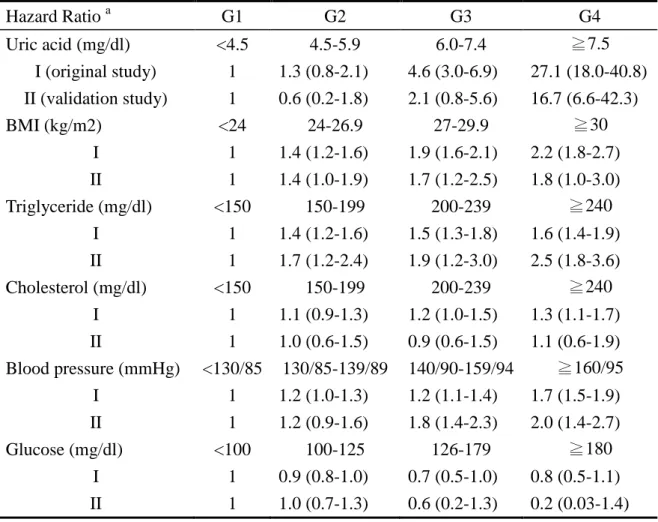
Table 3. Hazard ratios of incremental serum levels of each metabolic risk factor on gouty arthritis Hazard Ratio a G1 G2 G3 G4 Uric acid (mg/dl) <4.5 4.5-5.9 6.0-7.4 ≧7.5 I (original study) 1 1.3 (0.8-2.1) 4.6 (3.0-6.9) 27.1 (18.0-40.8) II (validation study) 1 0.6 (0.2-1.8) 2.1 (0.8-5.6) 16.7 (6.6-42.3) BMI (kg/m2) <24 24-26.9 27-29.9 ≧30 I 1 1.4 (1.2-1.6) 1.9 (1.6-2.1) 2.2 (1.8-2.7) II 1 1.4 (1.0-1.9) 1.7 (1.2-2.5) 1.8 (1.0-3.0) Triglyceride (mg/dl) <150 150-199 200-239 ≧240 I 1 1.4 (1.2-1.6) 1.5 (1.3-1.8) 1.6 (1.4-1.9) II 1 1.7 (1.2-2.4) 1.9 (1.2-3.0) 2.5 (1.8-3.6) Cholesterol (mg/dl) <150 150-199 200-239 ≧240 I 1 1.1 (0.9-1.3) 1.2 (1.0-1.5) 1.3 (1.1-1.7) II 1 1.0 (0.6-1.5) 0.9 (0.6-1.5) 1.1 (0.6-1.9) Blood pressure (mmHg) <130/85 130/85-139/89 140/90-159/94 ≧160/95 I 1 1.2 (1.0-1.3) 1.2 (1.1-1.4) 1.7 (1.5-1.9) II 1 1.2 (0.9-1.6) 1.8 (1.4-2.3) 2.0 (1.4-2.7) Glucose (mg/dl) <100 100-125 126-179 ≧180 I 1 0.9 (0.8-1.0) 0.7 (0.5-1.0) 0.8 (0.5-1.1) II 1 1.0 (0.7-1.3) 0.6 (0.2-1.3) 0.2 (0.03-1.4) a
Model adjusted by multiple covariates including age, sex, hyperuricemia, obesity, high
blood pressure, hypercholesterolemia, hyper-triglyceridemia, and hyperglycemia.
I, indicates hazard ratios derived from the original study of gout patients diagnosed by
either general physicians or rheumatologists; II, indicates relative risks derived from the
FIGURES
Figure 1. Hazard ratio of each metabolic risk factor on gout occurrence. (A) Hazard ratios of
subjects with gouty arthritis diagnosed by general physicians or rheumatologists. (B) Hazard
ratio derived from the gout patients diagnosed by rheumatologists. Cox proportional hazard
model estimated the hazard ratios with adjustments for age, (sex), hyperuricemia, obesity,
high blood pressure, hypercholesterolemia, hyper-triglyceridemia, and hyperglycemia.
Difference by gender was further tested between gender and each metabolic risk factor by
multivariate regression model. P-value corresponds to the gender-metabolic disorder
Figure 2. Population-attributable risk (PAR) for each metabolic factor on gout. Of the total
132,556 patients, 60181 were male and 72375 were female. Of the 1606 gout events, 1341
Figure 3. Gender-stratified hazard ratio and collective population-attributable risks of
hyperuricemia and metabolic risk factors on gout. These metabolic risk factors (MF)
were overweight, hypercholesterolemia, hyper-triglyceridemia, high blood pressure, and
hyperglycemia. Multivariate Cox proportional hazard model was applied with adjustment of
age, (sex), hyperuricemia and MF. The hazard risk (HR) and collective
population-attributable risk (PAR) shown were those with hyperuricemia, with at least one
Supplementary Figure. Gender-stratified HR of hyperuricemia and metabolic risks on gout
among individuals who had creatinine data. Of the total 41,031 patients, 18,293 were men
and 22,743 were women. Renal insufficiency was defined in subjects whose glomerular
filtration rate (GFR) <90 ml/min per 1.73 m2. Multivariate Cox proportional hazard model