行政院國家科學委員會專題研究計畫 成果報告
代謝症候群與其組成因子之家族聚集及遺傳性
計畫類別: 個別型計畫 計畫編號: NSC94-2314-B-039-019- 執行期間: 94 年 08 月 01 日至 95 年 07 月 31 日 執行單位: 中國醫藥大學中國醫學研究所 計畫主持人: 李采娟 共同主持人: 劉秋松,林正介 計畫參與人員: 李佳霙,張珮嘉,楊幸玉 報告類型: 精簡報告 處理方式: 本計畫可公開查詢中 華 民 國 95 年 10 月 31 日
中文摘要 背景 代謝症候群是一種常見、具有心血管疾病危險因子聚集之特質,有代謝 症候群的人有較高產生糖尿病及心血管疾病的風險,有代謝症候群的人通常報導 其家人也有相類似的症候群,但是家族研究相當缺乏,尤其是以中國人為對象的 研究。 目的 本研究目的主要有:預估代謝症候群及其組成因子之不正常和家族親屬 關係(父母-子女、兄弟姐妹及配偶)之相關;檢定指標個案或對照其兄弟姐妹、子 女、父母有無代謝症候群盛行率是否顯著高於配偶;分析指標個案或對照對象其 組成代謝症候群之生化指標是否有家族聚集現象。 方法 本研究將採用以社區為基礎之病例對照研究設計,代謝症候群病例指標 個案將由目前正在進行之社區隨機樣本調查中選取出,經由年齡性別配對選取出 對照指標個案,所有父母、配偶及大於二十歲以上之兄弟姐妹及子女皆以電話或 信件方式邀請參與本研究。每位受測者皆提供十二小時斷食後血液樣本,以提供 三甘酸油脂、高密度膽固醇、血糖、胰島素和尿蛋白等生化值,血壓、腰臀圍、 身高及體重則於健康檢查時由護理人員測量,並以自填問卷收集人口學因子、疾 病史、用藥史和生活型態變項如抽煙、喝酒、運動、飲食行為等相關資料。 結果 本研究總共網羅了 200 個代謝症候群家族,107 個非代謝症候群家族, 平均每個家族分別有 2.03 和 2.02 人參與本研究;在代謝症候群之組成生化值方 面,本研究發現代謝症候群個案之兄弟相對於非代謝症候群個案之兄弟有較高之 三酸甘油脂,而其姊妹則有較低之高密度膽固醇(p 值分別為 0.0310 and 0.0086); 代謝症候群個案之父或子相對於非代謝症候群個案之父或子有較高之三酸甘油 脂 (p=0.0167);在代謝症候群之組成生化異常方面,本研究發現代謝症候群個案 之兄弟相對於非代謝症候群個案之兄弟及父或子有較高之三酸甘油脂異常盛行 (p 值分別為 0.0408 and 0.0369)。 結論 本研究顯示於台灣家族有代謝症候群家族聚集之現象,未來研究應進一步 探討此人口之代謝症候群家族聚集為特定基因或是環境因素所造成。 關鍵詞:社區為基礎之病例對照研究設計;家族研究;代謝症候群;遺傳性;家 族聚集 Abstract
Background. Metabolic syndrome is a common population trait defined by a clustering of risk factors for cardiovascular disease. Persons with the syndrome have increased risks of developing diabetes as well as cardiovascular disease. Patients with metabolic syndrome often report family members with similar conditions, but family studies are lacking, especially for Chinese.
Objectives. The objectives of the present study are to estimate the relationship of metabolic syndrome and its individual components abnormality between each type of relative (sibling, parent, offspring, and spouse) and the probands, to evaluate whether type of relatives has a differential effect on the prevalence of individual metabolic syndrome abnormality.
Methods. A community-based case-control study of metabolic syndrome cases (metabolic syndrome probands) and age- and sex-matched controls (control probands) were conducted. All cases and controls were identified by our ongoing project ‘Valiation of A Screening Instrument for Prediabetes’. Data were collected for these case and control probands, their spouses and their all first-degree blood relatives
(parents, full siblings and offspring) aged 20 or over. Blood is drawn in the morning after a 12-hour overnight fasting and is sent for analysis within four hours of blood collection. Biochemical markers such as cholesterol, triglyceride, fasting glucose, creatinine, and insulin are analyzed. Blood pressure, waist, hip, weight, and height were measured during physical check-up. A self-administered questionnaire was used to obtain demographic information and medical history information from all study participants.
Results. There were 200 and 107 families recruited from index cases with and without metabolic syndrome, respectively. There are an average pedigree size of 2.03 and 2.02 relatives per family for index case group with and without metabolic syndrome. The majority of recruited relatives were spouse, parents or offspring. We observed significantly higher mean level of triglycerides between male siblings of different proband groups and lower mean level of HDL-cholesterol between female siblings of different proband groups (p=0.0310 and 0.0086, respectively). For parents or kids, we only observed significantly higher level of triglycerides in males between proband groups (p=0.0167). We also observed significantly higher prevalence of high triglycerides in male siblings (p=0.0408) and males of parent or kid relationship between proband groups (p=0.0369).
Conclusion. We have shown here that in Taiwanese families, there are familial aggregations for the metabolic syndrome. Further studies are necessary to investigate specific genetic and environmental factors related to the metabolic syndrome in this population.
Keywords. Community-based case-control study; family study; metabolic syndrome; heritability; family aggregation
SPECIFIC OBJECTIVE
This family study data from a large community sample of Taichung city was used to examine question regarding whether metabolic syndrome and its individual components’abnormality aggregate in the families of probands with metabolic syndrome. The specific objectives are as follows:
1. To estimate the relationship of metabolic syndrome and its individual
components abnormality between each type of relative (sibling, parent, offspring, and spouse) and the probands, and to assess whether this relationship will be influenced by each person’s characteristics, including sex, age, education level, smoking status, physical activity, alcohol drinking, diet habits, etc.
2. To evaluate whether type of relatives has a differential effect on the prevalence of individual metabolic syndrome abnormality and the metabolic syndrome among relatives of probands with metabolic syndrome.
BACKGROUND AND SIGNIFICANCE
Importance of Metabolic syndrome: Prevalence and Risk
Metabolic syndrome is a common population trait defined by a clustering of risk factors for cardiovascular disease. Its components usually include high plasma triglycerides, low HDL cholesterol, glucose intolerance, high blood pressure,
abdominal obesity, and proteinuria (National Cholesterol Education Program, 2002). Until recently, information about the prevalence of the metabolic syndrome in the general population is available. According ATP III definition, the prevalence varies from 8% (India) (Gupta et al., 2003) to 24% (United States) (Ford ES, et al., 2002) in men and from 7% (France) (Balkau B, 2003) to 46% (India) (Ramachandra A, 2003)
in women. For WHO definition, prevalence varies from 20.9% (Mauritius) (Cameron et al., 2003) to 43.3% (Sweden) (Balkau, et al., 2002) in men and from 12.0% (France) (Marques-Vidal et al., 2002) to 32.7% (United States) (Ford et al., 2002) in women. All studies indicate that metabolic syndrome is a burden to populations all over the world.
Persons with the syndrome have increased risks of developing diabetes as well as cardiovascular disease (Klein BEK, et al., 2002; Isomaa B, et al., 2001).
Individual components of metabolic syndrome are associated with behavioral trait, which is mainly determined by personal or environmental factors but which also shows a modest heritability level in a number of family studies. Some studies have begun to examine familial relationships of the syndrome or its components (Shaw JT, 1998; Stewart MW, 1995; Poulsen P., 2001; Pankow JS, 2004). Patients with metabolic syndrome often report family members with similar conditions, but family studies are lacking (Williams RR, et al, 1992; Hong Y, 1997), especially for Chinese. In addition, little information is available on whether the pattern of familial
aggregation of metabolic syndrome components differs between metabolic syndrome and random families (Austin MA, 2004).
Importance of Assessing Familial Aggregation
The assessment of familial aggregation of disease is often regarded as the initial step in determining whether or not there is a genetic basis for disease. When there is presence of familial aggregation, it can be due to many factors, including shared family environment. Therefore, familial aggregation alone is not sufficient to demonstrate a genetic basis for the disease. On the contrary, the absence of any evidence for familial aggregation casts strong doubt on a genetic component influencing disease, especially when environmental factors are included in the analysis.
King et al. emphasized that family studies consist three sequential steps: (1) to determine whether or not there is evidence of familial aggregation in a disease or trait; (2) to discriminate among environmental, cultural, and/or genetic factors that may contribute to his clustering if familiar aggregation exists; (3) to test for specific genetic mechanisms when evidence of a role for genetic factors exists.
Methods
Study Design
A community-based case-control study of metabolic syndrome cases (metabolic syndrome probands) and controls (control probands) was conducted. All cases and controls were identified by our ongoing project ‘Valiation of A Screening Instrument for Prediabetes’. Each proband and relative were contacted individually by letter and phone and were asked to participate in the study, including providing a fasting blood sample. Data were collected for these case and control probands, their spouses and their all first-degree blood relatives (parents, full siblings and offspring) aged 20 or over. The inclusion criterion for case or control probands is that they must have at least one living spouse or first degree relative.
Metabolic syndrome was defined according to criteria of National Cholesterol Education Program Adult Treatment Panel (NCEP ATP III); at least 3 of the
following : (1) fasting glucose110 mg/dL; (2) waist 102 cm for man and 88 cm for women; (3) triglycerides150 mg/dL; (4) HDL cholesterol 40 mg/dL in men and 50 mg/dL in women; (5) blood pressure 130/80 mm Hg. The metabolic
city.
All subjects without metabolic syndrome or individual metabolic syndrome components were recruited as the control proband.
Measurements
Blood pressure is measured in the left arm by a mercury sphygmomanometer after the patient had been seated for at least 5 minutes in the sitting position. The first and fifth-phase Korotkoff sounds are recorded in mmHg, as systolic and diastolic blood pressures, respectively. Subjects are considered to have high blood pressure if the average of three readings exceeded 130 mmHg Systolically and/or 80 mmHg diastolically.
Blood is drawn with minimal trauma from an antecubital vein in the morning after a 12-hour overnight fasting and is sent for analysis within four hours of blood collection. Biochemical markers such as cholesterol, triglyceride, fasting glucose, creatinine, and uric acid are analyzed by a biochemical autoanalyzer (Chem 1+, Technicon, USA) at the Department of Clinical Laboratory of China Medical University Hospital. Hypertriglyceridemia was defined as triglyceride 150 mg/dl and hyperglycemia was defined as fasting glucose110 mg/dl.
Weight, height, waist, and hip are measured by a trained nurse during physical check-up. Body mass index (BMI) will be derived from the formula of weight (kg) (height)2 (m2). BMI28 was defined as obesity; 25BMI<28 as overweight;
20BMI<25 as normal; and BMI<20 as underweight.
Confounding Variables
A self-administered questionnaire will be used to obtain demographic information and medical history information from all local and nonlocal study participants. Age, gender, income, marital status, ethnicity, employment status, education, family information, and whether living with family members was collected in the questionnaire. Pedigrees for all kindreds was constructed based on family information reported by probands.
Life style behaviors consist of smoking, alcohol drinking, eating of betel nut, exercise, and diet habits. Smoking status was measured by the years of smoking and the average pack of cigarettes per week. Alcohol drinking was measured by the duration of regular alcohol drinking and frequency, amount, and type of alcohol over a typical week. Betel nut eating was measured by the duration, frequency, and amount of a typical week. Exercise was measured by the duration, frequency, and type of exercise. Diet habits measure the way of cooking, types of fat used for cooking and at the table, frequency of some specific food such as fast food, junk food, etc. In addition, a semiquantitative food-frequency questionnaire was administered where a commonly used portion size was specified for each food (for example, 1 slice of bread or 1 egg). Participants were asked to average how frequently over the past year they had consumed that portion of food.
Statistical Analysis
The statistical analysis is described according to the specific objectives, and sample size estimation. The details are as follows:
A two-stage modeling approach will be used to investigate the potential
relationship of metabolic syndrome and its individual components between probands and each type of relative. Prospective approach of proband predictive model will be
adopted here (Laird NM & Cuenco KT, 2003). In the first stage, the presence of metabolic syndrome for relatives is considered the outcome of interest and is conditioned on metabolic syndrome status in the proband. Thus, the model is specified as follows: n j Y Y Y P it ( j 1| ) 2,..., log 1 011
For each family of size n, the proband is denoted by j=1 and the first-degree relatives by j=2,3,…, n. Yj 1 if individual j has metabolic syndrome and if
0
j
Y individual j does not have the disease. In the second stage, additional
covariates such as age, sex, behavioral, and environmental exposures will be included for each relative. The model is specified as follows:
n j Y x x Y Y P it ( j 1| , j) j 2,..., log 1 01 2 1
Results and Discussion
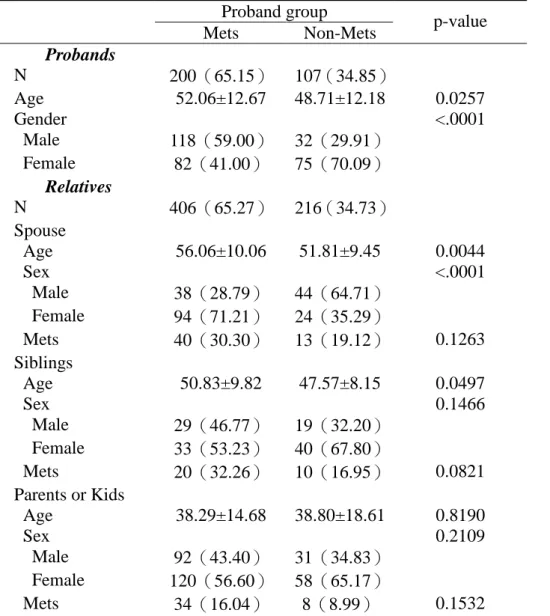
There were 200 and 107 families recruited from index cases with and without metabolic syndrome, respectively. Table 1 summarizes the distributions of relatives, spouse, siblings, and parents/offspring across the families by index case’s metabolic syndrome and yields an average pedigree size of 2.03 and 2.02 relatives per family for index case group with and without metabolic syndrome. The majority of recruited relatives were spouse, parents or offspring.
Demographic characteristics of the probands and their relatives are shown in Table 1. The proband groups differed significantly on age and gender (p=0.0257 and p<0.001, respectively). Proband group with metabolic syndrome has a higher mean age and a higher proportion of male than proband group without metabolic syndrome. Age and gender distributions also differ in spouses of proband groups (p=0.004 and p<0.0001, respectively) while only age distribution differs in siblings of proband groups (p=0.0497).
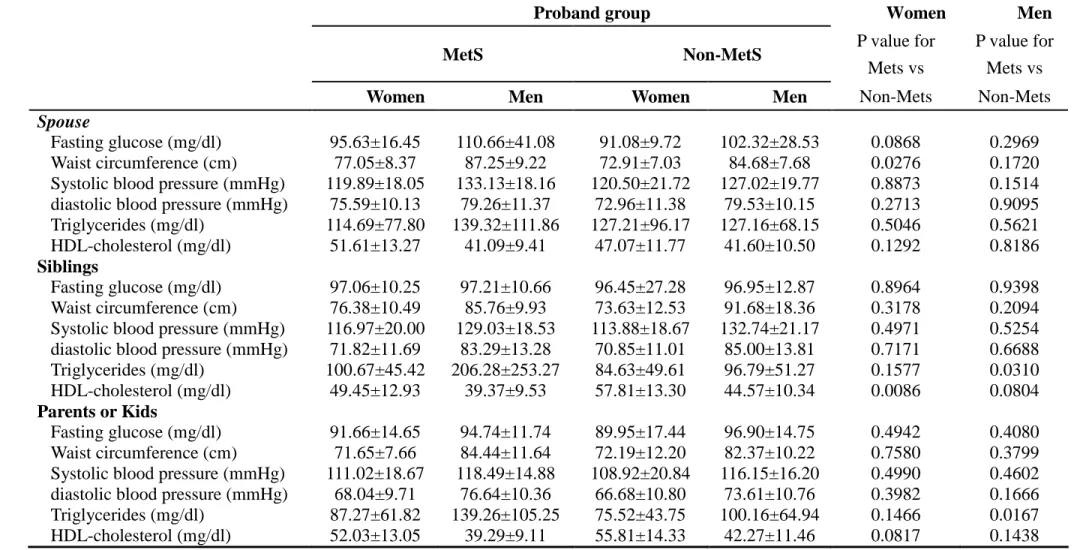
Table 2 shows anthropometric measurements and metabolic variables of
spouses, siblings, and parents or kids stratified by gender according to proband groups. We observed significantly higher mean waist circumference between wives of
different proband groups (p=0.0276). We also observed significantly higher mean level of triglycerides between male siblings of different proband groups and lower mean level of HDL-cholesterol between female siblings of different proband groups (p=0.0310 and 0.0086, respectively). For parents or kids, we only observed
significantly higher level of triglycerides in males between proband groups (p=0.0167).
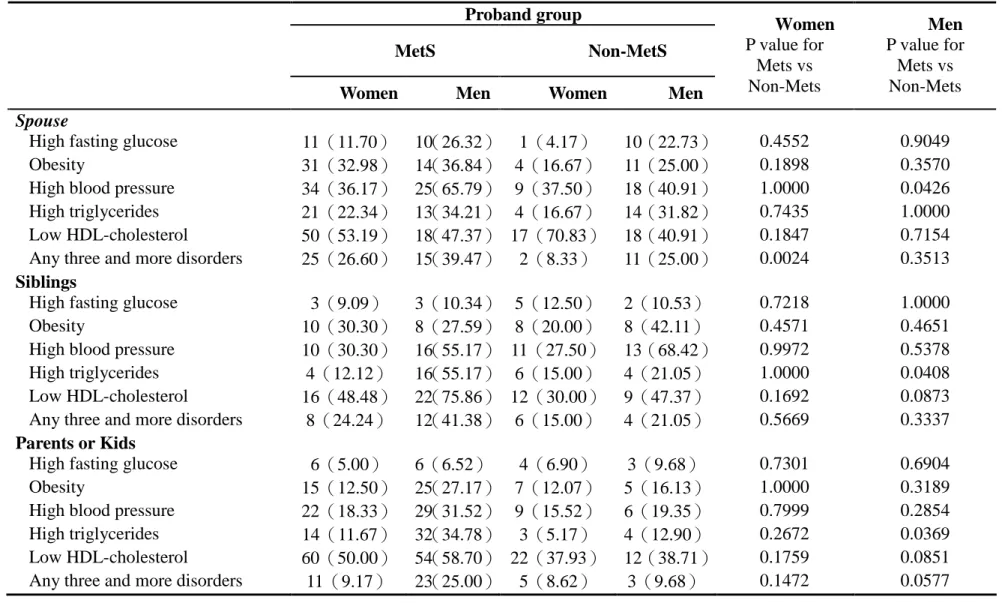
Table 3 abnormalities of metabolic variables of spouses, siblings, and parents or kids stratified by gender according to proband groups. We observed significantly higher prevalence of high blood pressure in husbands (p=0.0426) and higher
prevalence of metabolic syndrome in wives between proband groups (p=0.0024). We also observed significantly higher prevalence of high triglycerides in male siblings (p=0.0408) and males of parent or kid relationship between proband groups
(p=0.0369).
Table 4 shows the relationships of metabolic syndrome for proband cases with metabolic syndrome’s component abnormality of each type of relative (spouse, sibling, and parents or kids). We observed spouse’s obesity and low HDL-cholesterol were significantly associated with proband’s metabolic syndrome status after adjusting for age, sex, smoking status, alcohol status, physical activity, and diet (OR=2.82, 95% CI, 1.10-7.23 and OR=0.39, 95% CI, 0.16-0.94). We observed sibling’s low
HDL-cholesterol were significantly associated with proband’s metabolic syndrome status after adjusting for age, and sex (OR=3.00, 95% CI, 1.03-8.74), but it didn’t exist after further multivariate adjustment. We didn’t observe any significant
association between parents’or kids’abnormality of metabolic syndrome’s components and proband’s metabolic syndrome status.
Table 5 shows the results of logistic regression analysis with metabolic syndrome of relatives as dependent variable and type of relationship and proband’s metabolic syndrome status as independent variables. We only observed significant association between proband’s metabolic syndrome status and relatives’metabolic syndrome status no matter whether smoking status, alcohol status, physical activity, high oil diet, and sedentary behaviors are taken into account (OR=2.10, 95% CI, 1.29-3.43 and OR=1.85, 95%CI, 1.11-3.08, respectively). However, we didn’t observe significant association between type of relationship and metabolic syndrome status of relatives.
In conclusion, we have shown here that in Taiwanese families, there are familial aggregations for the metabolic syndrome. Further studies are necessary to investigate specific genetic and environmental factors related to the metabolic syndrome in this population.
Reference
Austin MA., Edwards KL, McNeely MJ, Chandler WL, Leonetti DL, Talmud PJ, Humphries SE, Fujimoto WY. Heritability of Multivariate Factors of the Metabolic Syndrome in Nondiabetic Japanese Americans. Diabetes 2004; 53:1166-1169.
Balkau B, Charles MA, Drivsholm T, Borch-Johnsen K, Wareham N, Yudkin JS, et al. Frequency of the WHO metabolic syndrome in European cohorts, and an alternative definition of an insulin resistance syndrome. Diabet Metab 2002; 28:364-76.
Balkau B, Vernay M, Mhamdi L, Novak M, Arondel D, Vol S, et al. The incidence and persistence of NCEP (National Cholesterol Education Program) metabolic syndrome. The French D.E.S.I.R. study Diabet Metab 2003;29:526-32.
Cameron AJ, Shaw JE, Zimmet PZ, Chitson P, Alberti KGGM, Tuomilehto J. Comparison of WHO and NCEP metabolic syndrome definitions over 5 years in Mauritius. Diabetologia 2003; 46:A3068.
Ford ES., Giles WH, Dietz WH. Prevalence of metabolic syndrome among US adults: Findings from the third national health and nutrition survey. JAMA 2002; 287(3): 356-359.
Gupta A, Gupta R, Sarna M, Rastogi S, Gupta VP, Kothari K. Prevalence of diabetes, impaired fasting glucose and insulin resistance syndrome in an urban Indian
population. Diab Res Clin Pract 2003;61:69-76.
Hong Y, Pedersen NL, Brismar K, De Faire U. Genetic and environmental
architecture of the features of the insulin-resistance syndrome. Am J Hum Genet 1997; 60:143.
Isomaa B, Almgren P, Tuomi T, Forsen B, Lahti K, Nissen M, Taskinen MR, Groop L; Cardiovascular morbidity and mortality associated with the metabolic syndrome. Diabetes Care 2001, 24: 683-689.
Klein BEK, Klein R, Lee KE: Components of the metabolic syndrome and risk of cardiovascular disease and diabetes in Beaver Dam. Diabetes Care 2002, 25: 1790-1794.
Laird NM, Cuenco KT. Regression methods for assessing familial aggregation of disease. Statistics in Medicine 2003; 22:1447-1455.
Marques-Vidal P, Mazoyer E, Bongard V, Gourdy P, Ruidavets JB, Drouet L, et al. Prevalence of insulin resistance syndrome in southwestern France and its relationship with inflammatory and hemostatic markers. Diab Care 2002;25: 1371-7.
National Cholesterol Education Program (NCEP). Detection, evaluation, and treatment of high blood cholesterol in adults (Adult Treatment Panel III). 2002 NIH publication number 02-o5215.
Pankow JS, Jacobs DR, Steinberger J. Insulin resistance and cardiovascular disease risk factors in children of parents with the insulin resistance (Metabolic) syndrome. Diabetes Care 2004; 27 (3):775-9.
Poulsen P, Vaag A, Kyvik K, Beck-Nielsen H. Genetic versus environmental aetiology of the metabolic syndrome among male and female twins. Biabetologia 2001;
44:537-543.
Ramachandran A, Snehalatha C. Satyavani K, Sivasankari S, Vijay V. Metabolic syndrome in urban Asian Indian adults –a population study using modified ATP III criteria. Diab Res Clin Pract 2003; 60:199-204.
Shaw JT, Levy JC, Turner RC: The relationship between the insulin resistance syndrome and insulin sensitivity in the first-degree relatives of subjects with non-insulin dependent diabetes mellitus. Diabetes Res Clin Pract 1998; 42:91-99. Stewart MW, Humphriss DB, Berrish TS, Barriocanal LA, Trajano LR, Alberti KG, Walker M: Features of syndrome X in first-degree relatives of NIDDM patients. Diabetes Care 1995, 18:1020-1022.
Williams RR, Hopkins PN, Hunt SC, Schumacher C, Elbein SC, Wilson DE, Stults BM, Wu LL, Hasstedt SJ, Lalouel JM. Familial dyslipidemic hypertension and other multiple metabolic syndromes. Ann Med 1992; 24:469.
Table 1. The demographic characteristics for proband groups and their relatives. Proband group
Mets Non-Mets p-value Probands N 200(65.15) 107(34.85) Age 52.06±12.67 48.71±12.18 0.0257 Gender <.0001 Male 118(59.00) 32(29.91) Female 82(41.00) 75(70.09) Relatives N 406(65.27) 216(34.73) Spouse Age 56.06±10.06 51.81±9.45 0.0044 Sex <.0001 Male 38(28.79) 44(64.71) Female 94(71.21) 24(35.29) Mets 40(30.30) 13(19.12) 0.1263 Siblings Age 50.83±9.82 47.57±8.15 0.0497 Sex 0.1466 Male 29(46.77) 19(32.20) Female 33(53.23) 40(67.80) Mets 20(32.26) 10(16.95) 0.0821 Parents or Kids Age 38.29±14.68 38.80±18.61 0.8190 Sex 0.2109 Male 92(43.40) 31(34.83) Female 120(56.60) 58(65.17) Mets 34(16.04) 8(8.99) 0.1532
Table 2. Anthropometric measurements and metabolic variables of spouses, siblings, and parents or kids stratified by gender according to proband groups.
Proband group Women Men
MetS Non-MetS P value for
Mets vs
P value for Mets vs
Women Men Women Men Non-Mets Non-Mets
Spouse
Fasting glucose (mg/dl) 95.63±16.45 110.66±41.08 91.08±9.72 102.32±28.53 0.0868 0.2969 Waist circumference (cm) 77.05±8.37 87.25±9.22 72.91±7.03 84.68±7.68 0.0276 0.1720 Systolic blood pressure (mmHg) 119.89±18.05 133.13±18.16 120.50±21.72 127.02±19.77 0.8873 0.1514 diastolic blood pressure (mmHg) 75.59±10.13 79.26±11.37 72.96±11.38 79.53±10.15 0.2713 0.9095 Triglycerides (mg/dl) 114.69±77.80 139.32±111.86 127.21±96.17 127.16±68.15 0.5046 0.5621 HDL-cholesterol (mg/dl) 51.61±13.27 41.09±9.41 47.07±11.77 41.60±10.50 0.1292 0.8186
Siblings
Fasting glucose (mg/dl) 97.06±10.25 97.21±10.66 96.45±27.28 96.95±12.87 0.8964 0.9398 Waist circumference (cm) 76.38±10.49 85.76±9.93 73.63±12.53 91.68±18.36 0.3178 0.2094 Systolic blood pressure (mmHg) 116.97±20.00 129.03±18.53 113.88±18.67 132.74±21.17 0.4971 0.5254 diastolic blood pressure (mmHg) 71.82±11.69 83.29±13.28 70.85±11.01 85.00±13.81 0.7171 0.6688 Triglycerides (mg/dl) 100.67±45.42 206.28±253.27 84.63±49.61 96.79±51.27 0.1577 0.0310 HDL-cholesterol (mg/dl) 49.45±12.93 39.37±9.53 57.81±13.30 44.57±10.34 0.0086 0.0804
Parents or Kids
Fasting glucose (mg/dl) 91.66±14.65 94.74±11.74 89.95±17.44 96.90±14.75 0.4942 0.4080 Waist circumference (cm) 71.65±7.66 84.44±11.64 72.19±12.20 82.37±10.22 0.7580 0.3799 Systolic blood pressure (mmHg) 111.02±18.67 118.49±14.88 108.92±20.84 116.15±16.20 0.4990 0.4602 diastolic blood pressure (mmHg) 68.04±9.71 76.64±10.36 66.68±10.80 73.61±10.76 0.3982 0.1666 Triglycerides (mg/dl) 87.27±61.82 139.26±105.25 75.52±43.75 100.16±64.94 0.1466 0.0167 HDL-cholesterol (mg/dl) 52.03±13.05 39.29±9.11 55.81±14.33 42.27±11.46 0.0817 0.1438
Table 3. abnormalities of metabolic variables of spouses, siblings, and parents or kids stratified by gender according to proband groups.
Proband group
MetS Non-MetS
Women Men Women Men
Women P value for Mets vs Non-Mets Men P value for Mets vs Non-Mets Spouse
High fasting glucose 11(11.70) 10(26.32) 1(4.17) 10(22.73) 0.4552 0.9049 Obesity 31(32.98) 14(36.84) 4(16.67) 11(25.00) 0.1898 0.3570 High blood pressure 34(36.17) 25(65.79) 9(37.50) 18(40.91) 1.0000 0.0426 High triglycerides 21(22.34) 13(34.21) 4(16.67) 14(31.82) 0.7435 1.0000 Low HDL-cholesterol 50(53.19) 18(47.37) 17(70.83) 18(40.91) 0.1847 0.7154 Any three and more disorders 25(26.60) 15(39.47) 2(8.33) 11(25.00) 0.0024 0.3513
Siblings
High fasting glucose 3(9.09) 3(10.34) 5(12.50) 2(10.53) 0.7218 1.0000 Obesity 10(30.30) 8(27.59) 8(20.00) 8(42.11) 0.4571 0.4651 High blood pressure 10(30.30) 16(55.17) 11(27.50) 13(68.42) 0.9972 0.5378 High triglycerides 4(12.12) 16(55.17) 6(15.00) 4(21.05) 1.0000 0.0408 Low HDL-cholesterol 16(48.48) 22(75.86) 12(30.00) 9(47.37) 0.1692 0.0873 Any three and more disorders 8(24.24) 12(41.38) 6(15.00) 4(21.05) 0.5669 0.3337
Parents or Kids
High fasting glucose 6(5.00) 6(6.52) 4(6.90) 3(9.68) 0.7301 0.6904 Obesity 15(12.50) 25(27.17) 7(12.07) 5(16.13) 1.0000 0.3189 High blood pressure 22(18.33) 29(31.52) 9(15.52) 6(19.35) 0.7999 0.2854 High triglycerides 14(11.67) 32(34.78) 3(5.17) 4(12.90) 0.2672 0.0369 Low HDL-cholesterol 60(50.00) 54(58.70) 22(37.93) 12(38.71) 0.1759 0.0851 Any three and more disorders 11(9.17) 23(25.00) 5(8.62) 3(9.68) 0.1472 0.0577
Table 4 The relationships of metabolic syndrome for proband cases with metabolic syndrome’s component abnormality of each type of relative (spouse, sibling, and parents or kids).
Model 1 Model 2
OR (95% CI) OR (95% CI)
Spouse
High fasting glucose 1.17(0.41-3.34) 1.11(0.34-3.66) Obesity 2.30(0.96-5.51) 2.82(1.10-7.23) High blood pressure 1.06(0.48-2.35) 1.24(0.53-2.93) High triglycerides 1.26(0.50-3.19) 1.47(0.53-4.09) Low HDL-cholesterol 0.48(0.22-1.07) 0.39(0.16-0.94)
Sibling
High fasting glucose 2.02(0.44-9.18) 1.98(0.38-10.31) Obesity 0.70(0.19-2.62) 0.69(0.16-2.89) High blood pressure 0.55(0.18-1.70) 0.56(0.17-1.87) High triglycerides 2.03(0.52-7.95) 2.21(0.48-10.14) Low HDL-cholesterol 3.00(1.03-8.74) 2.98(0.92-9.65)
Parents or Kids
High fasting glucose 0.57(0.16-2.01) 0.55(0.14-2.09) Obesity 1.17(0.46-2.99) 1.09(0.39-3.11) High blood pressure 1.55(0.66-3.63) 1.62(0.67-3.95) High triglycerides 2.21(0.78-6.22) 2.74(0.87-8.58) Low HDL-cholesterol 1.71(0.91-3.20) 1.89(0.97-3.68) Model I: adjusted for age and gender.
Model II: adjusted for age, sex, smoking status, alcohol status, physical activity, and diet.
Table 5. Logistic regression analysis with metabolic syndrome of relatives as the dependent variable and type of relationship and proband’s metabolic syndrome status as independent variables
Model 1 Model 2 OR (95% CI) OR (95% CI) Type of relationship (reference: Spouse)
Sibling 1.46(0.82-2.58) 1.46(0.80-2.66) Parent or Kid 0.96(0.57-1.61) 0.94(0.55-1.61) Proband’s metabolic syndrome status
(reference: non-Mets)
Metabolic syndrome 2.10(1.29-3.43) 1.85(1.11-3.08) model 1:age,sex,typeofrelationship,index’status; model 2:age, sex, type of relationship, index’ status, smoking status, alcohol status, physical activity, high-oil diet, sedentary behavior.