國
立
交
通
大
學
應用化學系碩士班
碩
士 論 文
飛秒雷射誘發光學熔損製備金與銀奈米粒子
Gold and silver nanoparticles fabrication by femtosecond
laser-induced optical breakdown
研 究 生:王 順發 (Shun-Fa Wang)
指導教授:三浦 篤志 博士 (Dr. Atsushi Miura)
飛秒雷射誘發光學熔損製備金與銀奈米粒子
Gold and silver nanoparticles fabrication by femtosecond
laser-induced optical breakdown
研 究 生:王順發 Student:Shun-Fa Wang
指導教授:三浦 篤志 博士 Advisor:Dr. Atsushi Miura
國 立 交 通 大 學
應用化學系碩士班
碩 士 論 文
A Thesis
Submitted to M.S. Program
Department of Applied Chemistry
National Chiao Tung University
in partial Fulfillment of the Requirements
for the Degree of
Master
in
Applied Chemistry
July 2012
Hsinchu, Taiwan, Republic of China
中 華 民 國一 百零一 年 七 月
i
Gold and silver nanoparticles fabrication by femtosecond
laser-induced optical breakdown
Student: Shun-Fa Wang Advisor: Dr. Atsushi Miura
M.S. Program
Department of Applied Chemistry National Chiao Tung University
Abstract
When femtosecond laser pulses are focused into water, an impulsive force is
generated that propagates from the laser focal point in a micron-sized space. This
femtosecond laser-induced optical breakdown has been widely used as a promising
technique for detaching and manipulating individual adherent cells, and insertion of
nanoparticles and bio-molecules into cells. In early studies on the femtosecond laser
application, most researchers have focused only on the induced physical behaviors,
but rarely on chemical aspect of the behaviors such as generation of transient
chemical species by the irradiation. The investigation of the chemical reactions on
femtosecond laser-induced multiphoton absorption in solution is indispensable to
confirm that these physical behaviors are realized without any chemical changes.
In this work, gold and silver nanoparticle fabrication is chosen as a probe in order
to confirm the generation of transient species such as ions and radicals by intense
ii
characteristic extinction spectra due to their surface plasmon. These nanoparticles are
prepared by the multiphoton reduction of HAuCl4 and AgNO3 in the presence/absence
of polyvinylpyrrolidone (PVP) and/or 1-propanol, and the formation of colloid
formation is confirmed by the change in the extinction spectra.
The laser energy dependence of gold nanoparticle formation strongly supports the
reduction of HAuCl4 through 2-photon absorption of AuCl4-. On the other hand, for
silver nanoparticle formation, the increase in the Δextinction is observed only in the
presence of PVP, which indicates that the colloid formation is achieved through the
2-photon absorption of PVP. While, even in the absence of PVP, a little extinction
change is observable. This result suggests that silver ions are reduced by hydroxyl
and/or hydrogen radicals due to 4-photon absorption of water, that is due to
femtosecond laser-induced optical breakdown.
Thus, we successfully demonstrate multiphoton absorption of AuCl4-, PVP and
H2O by femtosecond laser irradiation as a primary mechanism of gold and silver
nanoparticle fabrication. Furthermore, we have succeeded in nanoparticle fabrication
by laser ablation of nanoparticles formed by the reduction, and also succeeded in
controlling the mean size and the size distribution by optimizing various kinds of
experimental conditions. These successes will give us a novel guideline for the studies
iii
飛秒雷射誘發光學熔損製備金與銀奈米粒子
研究生: 王順發 指導教授: 三浦篤志 博士
國立交通大學 應用化學系碩士班
摘要
當飛秒雷射脈衝聚焦在水中,會在微米大小的雷射焦點產生一股斥力並向外 擴散,這種飛秒雷射誘發光學熔損廣泛地應用在一些很具發展性的科技上,如分 離和操作獨立附著的細胞以及嵌入奈米粒子與生物分子進細胞內,近年在飛秒雷 射應用的研究上,研究人員只專注在雷射產生的物理作用上,鮮少探討化學方面 的作用,例如雷射照射下短暫物質的生成,因此,飛秒雷射在溶液中誘發多光子 吸收產生化學反應的研究對於證明雷射誘發的物理作用與化學作用是相當重要 的。 在我們的研究中,金奈米及銀奈米粒子的製備可以當成是探測的工具,藉由 生成的金屬奈米粒子因表面電漿共振所展現的消光光譜,可證實飛秒雷射照射下 所生成的離子和自由基等短暫物質,這些奈米粒子是藉由四氯金酸與硝酸銀在溶 液中的多光子還原來製備,奈米粒子膠體溶液的形成可由消光光譜上的變化而得 知。 雷射能量相關的作圖可以推測四氯金酸的還原是透過四氯金酸離子的雙光 子吸收來進行,對銀奈米粒子的製備而言,消光光譜的強度只在聚乙烯吡咯烷酮 存在的溶液中大量增加,從這可以得知聚乙烯吡咯烷酮的雙光子吸收造成還原反 應的發生,然而在沒有聚乙烯吡咯烷酮的硝酸銀溶液中仍然可觀測到少量的光譜iv 變化,這結果可推論水的四光子吸收,也就是飛秒雷射誘發光學熔損所生成的氫 原子自由基與氫氧自由基可以還原銀離子。 因此,透過四氯金酸、聚乙烯吡咯烷酮及水在雷射照射下的多光子吸收,我 們推導出金奈米及銀奈米粒子還原的機制,此外,雷射熔損也可控制奈米粒子的 製備,根據不同的實驗參數,我們也成功地控制奈米粒子的大小與粒徑分佈,這 研究將會成功且創新地引導未來飛秒雷射誘發現象的發展。
v
Acknowledgement
I am very glad and fortunate to join our laboratory, Laser Bio/Nano Science
Laboratory, where I have opportunity to operate the advanced optical equipment,
investigate the novel research and cooperate with many intellectual scholars, as my
master student career in these two years. I sincerely appreciate Prof. Hiroshi
Masuhara for giving me new experimental ideas and teaching me how to explore
scientific world patiently. Even in daily life, a lot of encouragement and support for us
are covered in a joke or routine communication, leading us to learn the positive
attitude.
I must express many thanks to Dr. Takayuki Uwada who advises my experiment
and offers opinions to me. Such nice experimental environment organized by Prof.
Atsushi Miura is essential to be mentioned and praised. I deeply appreciate Prof.
Teruki Sugiyama for revising my master thesis and discussing my experiments. With
the help of Prof. Sugiyama for my master thesis, I can graduate successfully on time.
Many thanks to senior members inclusive of Dr. Anwar Usman, Dr. Ken-ichi
Yuyama, Mrs. Wen-Yu Lee, Mr. Ping-Yu Hee, Ms. Jing-Ru Tu, Mr. Chong-Wei Huang
and Mr. Tsung-Han Liu, my classmate Mr. Wei-Yi Chiang, Mr. Tsu-Wei Hsu, Ms.
Ling-Ting Huang, Mr. Yan-Hua Huang and Mr. Ching-Hsu Tseng, and junior member
vi
Table of Contents
1. Introduction ... 1
1.1 Research purpose ... 4
1.2 Why metallic nanoparticle preparation is studied? ... 4
1.3 General preparation method of metallic nanoparticles ... 6
1.3.1 Top-down method ... 6
1.3.2 Bottom-up reduction method ... 8
2. Principle ... 14 2.1 Plasmon resonance ... 14 2.2 Femtosecond laser ... 16 2.3 Optical breakdown ... 20 3. Experiments ... 23 3.1 Sample preparation ... 23 3.1.1 HAuCl4 solution ... 23 3.1.2 AgNO3 solution ... 24 3.2 Instruments ... 24 3.2.1 Femtosecond laser ... 24
3.2.2 UV-Vis absorption spectroscope ... 26
3.2.3 Scanning Electron Microscope ... 27
3.2.4 Transmission Electron Microscope ... 28
4. Laser-induced reduction of HAuCl4 and AgNO3 in solution ... 29
4.1 HAuCl4 concentration dependence of gold nanoparticle preparation ... 30
4.2 Laser energy dependence of gold nanoparticle preparation... 33
4.3 Irradiation time dependence of gold nanoparticle preparation ... 40
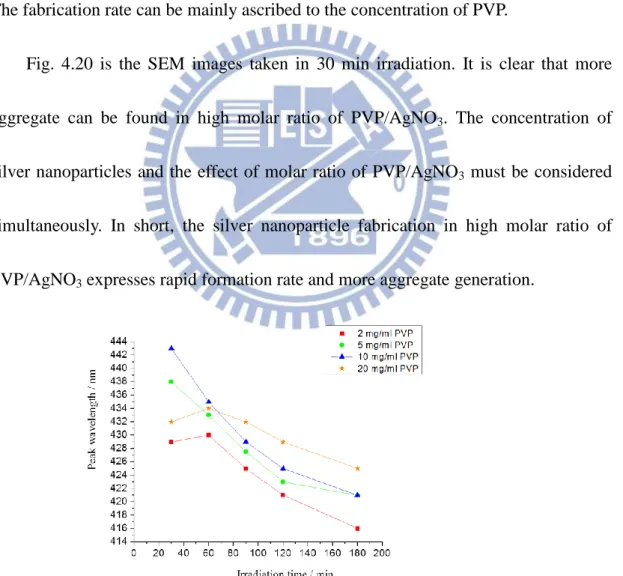
4.4 AgNO3 and Polyvinylpyrrolidone (PVP) concentration dependences of silver nanoparticle preparation... 44
4.5 Discussion ... 48
4.5.1 Laser energy dependence of gold nanoparticle preparation efficiency and bubbling threshold ... 48
4.5.2 Irradiation time dependence of gold nanoparticle size ... 50
4.5.3 Concentration dependence of preparation yield ... 51
4.5.4 Preparation mechanism of gold and silver nanoparticle ... 52
4.6. Surfactant effects on the preparation process ... 58
4.6.1 Polyvinylpyrrolidone (PVP) effect on gold nanoparticle preparation 58 4.6.2 Polyvinylpyrrolidone (PVP) effect on silver nanoparticle preparation ... 61
vii
4.7. Discussion ... 64 6. Conclusion ... 67 7. References ... 69
viii
List of Figures
Fig.1.1 The gold nanoparticles with different sizes show various colors ... 6
Fig.1.2 The absorption spectra of surface plasmon of gold nanoparticle demonstrate size dependence. ... 6
Fig.1.3 The principle of e-beam lithography process for the fabrication of nanostructure. (a) & (b) e-beam irradiation on PMMA resist layer with thickness of 100 nm, which spin-coated on ITO glass substrate. (c) Vacuum decomposition of metal, and (d) removal at unexposed area by the liftoff process ... 7
Fig.2.1 Scheme of plasmon oscillation for a sphere ... 16
Fig.2.2 A picture of mode-locked Ti:sapphire laser, Tsunami. ... 18
Fig.2.3 Absorption and emission spectra of Ti:sapphire. ... 18
Fig.2.4 The mode-locking principle in Tsunami. ... 19
Fig.2.5 A picture of Ti:sapphire regenerative amplifier system, Spitfire Pro... 19
Fig.2.6 The schematic illustration of CPA principle. ... 19
Fig.2.7 Images of femtosecond laser-induced optical breakdown in water with various time delays ... 21
Fig.2.8 Evolution of the radius of the laser-produced plasma, pressure wave, and cavitation bubble as a function of time (● plasma/bubble radius, ❑ pressure wave) ... 21
Fig.2.9 Absorption coefficient spectrum of water, together with the wavelength positions of the most widely used lasers ... 22
Fig.2.10 The diameter of cavitation bubble in water plotted as a function of time. ... 22
Fig.3.1 HAuCl4 solution in a quartz cell ... 23
Fig.3.2 AgNO3 solution in a quartz cell (left) and polyvinylpyrrolidone (PVP) chemical structure (right). ... 24
Fig.3.3 Laser light source and microscopic system. ... 25
Fig.3.4 A picture of inverted microscope and other attachments. ... 25
Fig.3.5 Reflectance spectrum of the dichroic mirror used in the inverted microscope. ... 26
Fig.3.6 Transmittance spectrum of the objective lens used in the inverted microscope. ... 26
Fig.4.1 The pictures of HAuCl4 solution before (left) and after (right) femtosecond laser irradiation. ... 30
Fig.4.2 The Δextinction at 540 nm shows linear increase versus irradiation time in 0.5, 1, and 2 mM HAuCl4 solutions. ... 31
ix
solutions. The nanoparticle size changes with the evolution of irradiation time. ... 32 Fig.4.4 The Δextinction increases with the irradiation time at the pulse energy; (a) 5 μJ/pulse, (b) 10 μJ/pulse, and (c) 40 μJ/pulse. Rapid increase in the Δextinction is observed at higher energy. ... 34 Fig.4.5 The Δextinction around 540 nm in the presence/absence of 1-propanol increases with the irradiation time at the pulse energy of (a) 5 μJ/pulse, (b) 10 μJ/pulse, and (c) 40 μJ/pulse. ... 36 Fig.4.6 The Δextinction increase at 540 nm with irradiation time shows energy dependence. ... 38 Fig.4.7 The relation between peak wavelength and irradiation time depends on the laser energy. Larger nanoparticles are obtained at lower energy. ... 39 Fig.4.8 The Δextinction at 540 nm versus laser pulse energy. The fitting curve is based on 2nd order equation. ... 40 Fig.4.9 The peak wavelength against irradiation time at 40 μJ/pulse. The nanoparticle size varies with irradiation time. ... 42 Fig.4.10 SEM images taken at the irradiation time of (a1) & (a2) 10 min, (b1) 60 min,
(c1) 120 min, and (d1) 180 min. (b2), (c2), and (d2) are the size distribution estimated from the corresponding SEM images of (b1), (c1), and (d1). ... 43 Fig.4.11 The Δextinction of AgNO3 solution at 425 nm versus irradiation time under
the three conditions; with PVP, with 1-propanol, and without any chemicals. A large extinction change was found in the presence of PVP. ... 45 Fig.4.12 The pictures of AgNO3 solution before (left) and after (right) femtosecond
laser irradiation. ... 45 Fig.4.13 The Δextinction at 425 nm versus irradiation time among 0.25, 0.5, 1 mM AgNO3 concentration at 40 μJ/pulse. AgNO3 concentration dependence is
observed. ... 46 Fig.4.14 The Δextinction at 425 nm versus irradiation time among four concentration of PVP. The yield of silver nanoparticles depends on PVP concentration. ... 47 Fig.4.15 The plot of log(Δextinction) versus log(energy) depicts that the slope of linear fitting line is (a) 1.8 and (b) 2.0. HAuCl4 concentration is (a) 0.5 mM and
(b) 2 mM. ... 55 Fig. 4.16 The Δextinction at 540 nm versus the waiting time and the peak wavelength versus the waiting time in 5 days. Some changes of the peak wavelength and the Δextinction are recorded within two days. Gold nanoparticles keep their size after 2 days. ... 60 Fig. 4.17 The SEM image and size distribution diagram of gold nanoparticles after keeping 5 days. The size distribution is narrower with than without PVP and
x
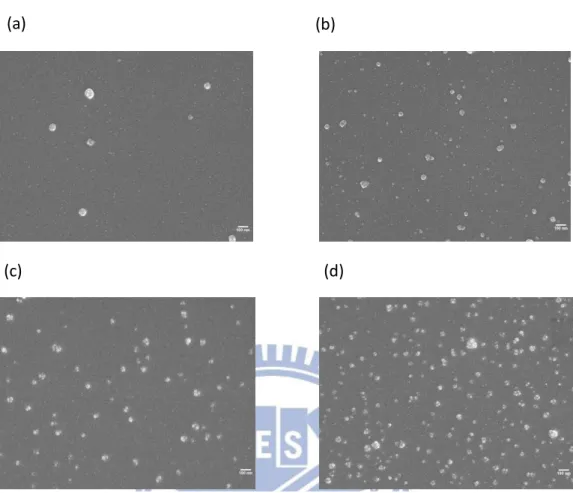
few aggregates are observed. ... 60 Fig. 4.18 The Δextinction at 540 nm increases under three conditions; with PVP, with 1-propanol, and without any chemicals. The solution with PVP becomes saturated in short time. ... 61 Fig. 4.19 The peak wavelength against irradiation time for four concentration of PVP. The peak wavelength declines with irradiation time and depends on PVP concentration. ... 62 Fig. 4.20 SEM images taken with different molar ratio of PVP/AgNO3; (a) 0.2, (b)
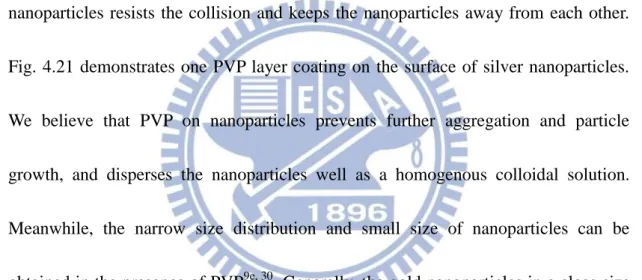
0.5, (c) 1, and (d) 2. The irradiation time is 30 min and pulse energy is 40 μJ/pulse. ... 63 Fig.4.21 TEM image of silver nanoparticle covered with PVP around the surface as a layer. The molar ratio of PVP/AgNO3 is 1 and irradiation time is 30 min. ... 66
1
1. Introduction
Various laser techniques have been developed widely since the 1960s due to the
unique properties of laser light. The high spatial coherence of laser light permits
directional irradiation and excellent focusing. The monochromaticity of laser light
allows us for highly selective narrow-band excitation 1. For pulsed lasers, the
extremely high energy density can be achieved within each laser pulse ranging from
the nanosecond to femtosecond scale. Until now, applications of their lasers are
expanded broadly in physics, chemistry, biology and industry. Laser-induced
crystallization is one of the important researches among applied laser developments.
Laser-induced crystallization can be divided to “Laser trapping crystallization” and “laser tsunami crystallization” according to different laser irradiation modes.
In “laser trapping crystallization”, molecules and/or clusters in solution are
trapped at the focal point by photon pressure of a focused intense near-infrared
continuous wave laser irradiation, the local concentration increases, and crystal
nucleation is eventually triggered. Generally, laser trapping technique is used for
manipulating micrometer-sized objects without any mechanical contact but with
interactions between photons and the target objects. Sugiyama et al. for the first time
2
On the other hand, in “laser breakdown-induced crystallization”, the focused
intense near-infrared femtosecond laser pulses irradiates into solution and induces
optical breakdown by multiphoton absorption of water involving nonlinear
phenomena like shockwaves, cavitation bubbles and jet flow. The local physical
perturbations of laser tsunami trigger nucleation, and crystallization.
Among various pulsed lasers, femtosecond laser attracts much attention because
of its high potential applications of short and high photon density pulse, for example,
in the research fields of imaging, processing1, 3, optical communication, and
biomedicine3-4 and so on. When the femtosecond laser pulses are focused through an
objective lens with high N.A. into water, an impulsive force is generated, which
propagates from the laser focal point to a micro-sized space. This force can detach
individual adherent cells from a substrate without considerable cell damage, and using
this laser-induced optical breakdown, the manipulation of a large living cell and
insertion of nanoparticles into cells have been demonstrated so far. However, these
studies have been carried out under the assumption that no chemical reaction takes
place by femtosecond lase irradiation, that is, only physical phenomena is considered.
On the other hand, one of the most profitable behaviors of short high-intensity
laser pulses is laser ablation. When the pulse laser with intensity above a threshold
3
ablation has been discussed on the basis of thermal, mechanical, photophysical,
photochemical, and defect model 1. The process starts through one-photon or
multiphoton absorption of target materials. If the excitation energy is converted to
heating instantaneously, temperature elevation causes rapid volume expansion and
following mechanical crash, resulting in thermal material ablation (vaporization) with
or without melting. Another phenomenon related to temperature elevation is
formation of thermally induced defects. This overall process is regard as “thermal ablation”. If photon energy is high enough, laser-light excitation can break chemical bondings with the assumption that bond change is faster than non-radiative relaxation.
The process is so-called “photochemical ablation”. When both thermal and
photochemical mechanisms contribute to the ablation, the generation of defects,
stresses, and volume changes influence the overall process, which is considered as “photophysical ablation”.
In this research, we consider the generation of chemical transient species through
the gold and silver nanoparticle fabrication by femtosecond laser irradiation. The
detail mechanisms processes during femtosecond laser irradiation shall be mentioned
4
1.1 Research purpose
In this work, we first aim the confirmation of the transient chemical species
generated by femtosecond laser irradiation of 800 nm into solution. We chose HAuCl4
and AgNO3 aqueous solution as starting samples, and confirm the generation of their
chemical species through the corresponding nanoparticle preparation of Au and Ag,
respectively. Since HAuCl4 and AgNO3.have surely no photon absorbance at 800 nm,
their nanoparticle formation should require the multiphoton reduction ofHAuCl4 and
AgNO3. There, we examine the laser energy dependence of gold and silver
nanoparticle formation and reveal the reduction process of HAuCl4 and AgNO3
through the multi-photon absorption. In addition, we confirm laser ablation behavior
of the formed nanoparticles by the further irradiation and try to control their mean size
and their distribution by optimizing various experimental conditions such as laser
energy, solution concentration, and additives.
1.2 Why metallic nanoparticle preparation is studied?
Noble metallic nanoparticles have collected much interest for past two decades
because they exhibit strong light scattering and absorption in visible region due to
5
of all the free electrons within the conduction band, leading to an in-phase oscillation.
For the particles with size of several tens of nanometers which is smaller compared to
incident light wavelength, excitation of surface plasmon resonance can be induced
with visible light. As a result, the particles possess strong light scattering and
absorption in visible region. On the other hand, the surface is very important for the
observation of the surface plasmon resonance, as it alters the boundary conditions for
the polarizibility of the metal and therefore shifts the resonance to optical frequencies5.
It means that the optical properties depend on the size and shape of metal and can be
applied to intense electromagnetic field enhancement 4a, 6.
Besides, the reduction of metal nanoparticle is much simple and easy to explore
transient species, because only reduction product, i.e., metal is enough to be
considered, while many complicated reactions take place in organic molecules. Metal
nanoparticles are relatively stable and convenient to measure and analyze by UV-Vis
absorption spectroscopy. Therefore, the fabricated metal nanoparticles are examined
to elucidate transient species and reactions due to femtosecond laser induced
6
1.3 General preparation method of metallic nanoparticles
1.3.1 Top-down method
1.3.1.1 Electron beam lithography
The electron beam lithography tool achieves an accurate control for ultrahigh
resolution mask-making, direct writing and metallic nanostructure fabrication 7. For
Fig.1.1 The gold nanoparticles with different sizes show various colors6.
Fig.1.2 The absorption spectra of surface plasmon of gold nanoparticle
7
metallic nanoparticles and nanowire fabrication of liftoff process, the designed pattern
is written with electron beam into a 100 nm thick PMMA (poly-methyl-methacrylate)
resist layer which is spin-coated on ITO (indium-tin oxide) doped glass substrate.
After the exposed resist layer is removed, the metal vapor is coated on the surface of
both unexposed the resist layer and exposed resist layer. Finally, the unexpected area
is taken off by liftoff process, and a designed nanostructure is obtained 8. Generally,
the electron beam lithography can provide the demand of well shape and specific
structure. The exact control is achieved by this method and used in photolithography.
Nonetheless, the limitations of electron beam lithography such as long working time
and low production yield results in restricted application and investigation.
1.3.1.2 Laser ablation
Pulsed laser ablation of a target of a solid substrate immersed in aqueous solution
Fig.1.3 The principle of e-beam lithography process for the fabrication
of nanostructure. (a) & (b) e-beam irradiation on PMMA resist layer with thickness of 100 nm, which spin-coated on ITO glass substrate. (c) Vacuum decomposition of metal, and (d) removal at unexposed area by the liftoff process8.
8
can induce the fragmentation resulting in reduction in the size over time, which process is regarded as “Top-down” method for the nanoparticle preparation9
. The
obtained nanoparticles can be fabricated mechanically, physically or chemically. The
most beneficial advantage of this method is the fact that high purity nanoparticle
without other residual ions is fabricated10. On the contrary, the disadvantage of this
method is the low production yield, which makes it difficult to accumulate sufficient
concentration of nanoparticles, and wide size distribution of nanoparticles is found.
1.3.2 Bottom-up reduction method
1.3.2.1 Chemical preparation method of metallic nanoparticle
The method of conventional metallic nanoparticles synthesis is chemical
reduction by adding reductants into the metallic ion solution. One of the most
well-known chemical reduction methods for gold nanoparticles is Turkevich method
established by Turkevich et al. and refined by Frens 11. The almost spherical
nanoparticles with wide tunable range of size can be obtained in the reducing process
in the presence of sodium citrate. The stabilization of nanoparticles is assisted by
surfactants which also determine geometrical shapes of the nanoparticle such as rod,
9
surfactant, cetyltrimethylammonium bromide (CTBA) mixed in ascorbic acid and
metallic ion solution. In addition, other reductants, for example amino acids, are
successfully reducing gold nanoparticles without any surfactants and the shape is
determined by the reductants. In this method, it is found that the relation between
gold/citrate ratio and final size. The obtained gold nanoparticles can be kept for a long
time and maintained stable state.
The other method discovered by Brust et al. can produce gold nanoparticles in a
two-phase system, liquid-liquid (water-toluene) 12. The chlorauric acid is mixed with
tetraoctylammonium bromide (TOAB) solution in toluene and sodium borohydride
solution. TOAB is not only the phase transfer agent but also the stabilizing agent.
Sodium borohydride in this system is a reducing agent and dodecanethiol is added to
the solution in order to prevent gold nanoparticles from aggregating. In this method,
the gold nanoparticles have a diameter distribution in the range of 1-3 nm and the size
distribution profile peak is 2-2.5 nm approximately.
For Turkevich method and Brust method, the gold particle size range is 12-100
nm and 2-10 nm respectively. It is hard to obtain high quality spherical gold
nanoparticles whose size is up to 50 nm. In 2009, a seed-based method was published
by Perrault et al. and it is important that this method can produce gold nanoparticles
10 tunable in the range from 50 nm to 200 nm 13.
1.3.2.2 Sonication method of metallic nanoparticle reduction
It is well known that sonication has been utilized and applied for several decades.
The synthesis method of sonication-induced nanoparticles reduction has been
developed in the field of sonochemistry and applied to Au, Ag, Pt, Tl, Fe, MnO2 and
CdS and so on14. The high intensity ultrasonic irradiation through aqueous solution generates a series of bubble formation called “cavitation”. The cavitation bubble formation includes 3 processes, bubble expansion, bubble collapse and light emission,
leading to extreme high temperature and pressure within the bubble 15. Initially, the
cavitation bubble absorbs energy offered by ultrasound and then expands toward the
maximum size in which the temporally low pressure is attained. The cavitation bubble
collapse creates sharply rising in temperature and pressure due to near-adiabatic
compression. Finally, the energy of the cavitation bubble converts to mechanical
energy, heat, chemical reaction and light emission. Barber et al. published that the
light emission from single bubble can include more than 107 photons per flash 16.
Flannigan and Suslick observed the emission spectra from which the temperature
upon 15,000 Kelvin was estimated through the collapsing bubble 17. During the
11
inside the bubble undergoes formation of radicals and ions, which may diffuse to the
solution along the border of bubble. This radicals and ions possess high reducing
ability 18.
When water is sonicated by ultrasound, dissociation of water to hydrogen radicals
and hydroxyl radicals take place due to extremely high temperature in collapsing
cavitation bubble. However, the lifetime of hydrogen radicals and hydroxyl radicals
are roughly as short as 10-7 second order. Hydrogen radicals and hydroxyl radicals are
possible to encounter with each other, resulting in recombination reactions whose
products are hydrogen, water and hydrogen peroxide. Hence, alcohol is added to the
solution as intermediate whose lifetime is much longer. Alcohol attacked by hydrogen
radicals and hydroxyl radicals at the cavitation bubble can form alcohol radicals and
act as a radical scavenger that can prevent recombination reaction owing to diffusion
in solution. No matter what kind of alcohols are involved in the reaction, such as
methanol, ethanol, 1-propanol or 1-pentanol, alcohol radicals show high performance
in reduction of metallic ions. It is reported that longer carbon chain alcohol owns
better reducing ability of gold nanoparticles by Caruso et al. 19. The average particle
size shows decreasing trend with increased in alcohol concentration and alkyl chain
12
1.3.2.3 Radiation-induced formation of metallic nanoparticle
The gamma ray irradiation induced synthesis of metallic nanoparticles, which is
based on formation of reactive transient species triggered by 60Co source. Reactive
transient species like electrons, hydrogen radicals and hydroxyl radicals can be
produced through water radiolysis. For the reduction of gold ions, alcohol ought to be
present necessarily in aqueous solution and scavenge reactive transient species
efficiently, which generates alcohol radicals with high reduction potential 20. Gold
nanoparticles synthesis is completed approximately after 10 hours irradiation in the
presence of methanol at a dose rate of 1.8 ╳ 104 rad/h 21.
Another method of radiation-induced formation of metal nanoparticles is UV
photoactivation. The UV photoactivation technique is able not only to reduce noble
metal ions solution but also to stimulate the growth of seed-base nanoparticles along certain direction or on their surface like “core-shell” type nanoparticles 22
. The UV
photoactivation usually occurs with the functional groups such as sodium alginate
which acts as a stabilizer and a reducing agent 23. On the other hand, the nanoparticles
enlargement is achieved in the seed nanoparticles solution by UV light irradiation.
When the UV light irradiation is collimated through the seed nanoparticle solution,
their distribution grew up along the direction of UV light and hence this method can
13
formation of bimetallic nanoparticles for the preparation of “core-shell” structure nanoparticles is come out by UV light irradiation 24.
There are certain advantages utilizing these radiolysis techniques as compared to
conventional chemical and photochemical methods: (1) Excess reducing agent and
undesired oxidation products are not necessary. (2) Reaction rate has been already
established because the number of reducing equivalents is well defined. (3)
Absorption of irradiation in the presence of light-absorbing solutes and products is
14
2. Principle
2.1 Plasmon resonance
The scientific investigations on the optical properties of metal nanoparticles
originated from Faraday in 18th century. When a small spherical metal nanoparticle is
irradiated by an electromagnetic wave, the oscillating electric field shifts electrons in
conduction band collectively with respect to fixed positive charge, causing conduction
electrons to oscillate coherently. Fig. 2.1 is schematically showing the displacement of
the conduction electron charge cloud relative to the nuclei. A restoring force is formed
due to Coulomb attraction between the negative and positive charges on the opposite
side. The electron cloud is displaced relative to the nuclei resulting in the oscillation
of electrons and nuclei. This collective oscillation of conduction electrons is called “plasmon resonance” 6a, 25
.
The oscillation frequency is determined by 4 factors; the density of electrons, the
effective electron mass, and the shape and size of charge distribution. For silver, the
plasmon frequency is also influenced by other electrons, making it difficult to
calculate the plasmon frequency. In order to relate the plasmon frequency to the metal
dielectric constant which is a function of wavelength, we consider the interaction of
15
these circumstances, the electric field of light is constant and the interaction is
governed by electrostatics. The wavelength-dependent dielectric constants of the
metal particles, 𝜖𝑖 and of the surrounding medium, 𝜖0 are depicted in electrostatic
theory. To determine the electromagnetic field surrounding the particles, we have to
solve the Laplace equation, ∇2φ = 0, where φ is the electric potential and the electric field of incident electromagnetic wave E is related to φ by E = −∇φ. The boundary conditions are that φ is continuous at the sphere surface and that the normal component of the electric displacement D is also continuous.
For a sphere, the Laplace equation solution exhibits that the polarizability is α = g𝑑𝑎3
with
g𝑑 = (𝜖𝑖 – 𝜖0) (𝜖0+ 2𝜖0)
and 𝑎 is the radius of sphere. The more complete Maxwell equation solution can
contribute to extinction and Rayleigh scattering by the sphere. This leads to extinction
and scattering efficiencies given by
𝑄𝑒𝑥𝑡 = 4𝑥𝐼𝑚(g𝑑) 𝑄𝑠𝑐𝑎 =8 3 𝑥4|g𝑑| 2 where 𝑥 = 2π𝑎(𝜖0)1/2/𝜆
16
The efficiency is the ratio of the cross-section to the geometrical cross-section π𝑎2. g𝑑 is an important factor for determining the wavelength dependence of these cross-sections because the metal dielectric constant 𝜖𝑖 is strongly dependent on
wavelength.
2.2 Femtosecond laser
Amplified Ti:sapphire femtosecond laser is the combination of a mode-locked
Ti:sapphire laser, Empower laser and Ti:sapphire regenerative amplifier system. A
mode-locked Ti:sapphire laser (wavelength: 700-900 nm, repetition rate: 80 MHz,
pulse duration: 160 fs, Tsunami, Spectra Physics) as a seed laser provides the input
pulse to the amplified Ti:sapphire femtosecond laser. A diode-pumped continuous
wave visible laser (wavelength: 532 nm, Millenia Pro, Spectra Physics) supplies 7 W
to pump Ti:sapphire rod in the cavity of mode-locked Ti:sapphire laser which is
controlled by an electronics module (Model 3955, Spectra Physics). The full width at
17
half maximum (FWHM) of the spectrum and central wavelength of the laser light are
determined to 12.5 nm and 800 nm, respectively. Acousto-optics modulator (AOM)
ensures proper mode-locked pulsing at the period of laser operation. The output
wavelength can be tuned by a slit wavelength selector and overall cavity dispersion
balance as well as shortest output pulse can be adjusted by a prism dispersion
compensation control.
The high peak power compressed pulse coming from the amplified Ti:sapphire
femtosecond laser is ascribed to 3 individual step; stretcher, amplifier, and compressor.
Firstly, the low-power, short-duration pulse from Tsunami seed laser is stretched so
that it lasts longer time based on the principle of group velocity dispersion (GVD) or informally “chirp”. The short pulse is lengthened by the device which can delay longer wavelengths, leading to the generation of wide wavelength spreading but
reduction of peak power pulse. Secondly, a synchronous energy pulse of Empower
laser amplifies the energy of the stretched pulse. Thirdly, the compressor uses a
horizontal retroreflector to force the longer wavelengths to take longer path, causing
pulse duration tends to original length. The amplified laser pulse possesses high peak
power and short duration time simultaneously. These 3 step are completely performed
in Ti:sapphire regenerative amplifier system (Spitfire Pro, Spectra Physics).
18
nonlinear optical effect, self-focusing, may cause permanent damage on the crystal,
because the refractive index of the crystal is modified as a result of beam focusing and
intensification further. Self-focusing limits the peak power of a pulse in the
Ti:sapphire crystal lower than 10 GW/ cm2. So, chirped pulse amplification (CPA) is
developed to allow the amplified pulse to pass through Ti:sapphire crystal safely
below the damage threshold, meanwhile, to maintain this peak power. The 3 steps
mentioned above are included in chirped pulse amplification.
Fig.2.2 A picture of mode-locked Ti:sapphire laser, Tsunami.
19
Fig.2.4 The mode-locking principle in Tsunami.
Fig.2.5 A picture of Ti:sapphire regenerative amplifier system, Spitfire
Pro.
20
2.3 Optical breakdown
Optical breakdown is associated to the laser ablation which happens above a
certain threshold in air or liquid. The critical optical breakdown threshold for air
calculated by Paschen curve is 30 kV/cm at 1 atm. In water, a much higher voltage of
the well-accepted value of 30,000 kV/cm is necessary because of the larger density of
water 26. At the first, because the energy of single photon is insufficient to excite a
molecule from ground state to excited electronic state, the energy of absorption by the
molecule must be more than that of one photon. The accumulation of the energy of
photons equals to the total energy of absorption between two states. Focusing intense
pulse laser into water causes multiphoton absorption of water, although water does not
absorb the light of the laser wavelength 27. When increasing pulse laser energy
intensity, a great deal of fraction of atoms and molecules undergoes ionization. As a
consequence, a very high concentration of active intermediate species (e.g., ions,
electrons, radicals, atoms, photons, and excited states) is produced around the focal
position. Optical breakdown of water via multiphoton absorption is a nonlinear
phenomenon in which cavitation bubble generation, shockwave propagation, and jet
21
Fig.2.7 Images of femtosecond laser-induced optical breakdown in water
with various time delays28a.
Fig.2.8 Evolution of the radius of the laser-produced plasma, pressure wave,
and cavitation bubble as a function of time (● plasma/bubble radius, ❑ pressure wave)28a.
22
Fig.2.9 Absorption coefficient spectrum of water, together with the wavelength positions of the most widely used lasers27.
Fig.2.10 The diameter of cavitation bubble in water plotted as a function of
time28b.
23
3. Experiments
3.1 Sample preparation
3.1.1 HAuCl
4solution
Hydrogen tetrachloroaurate (HAuCl4) solution was prepared by dissolving gold
chloride trihydrate (Au 49.5%, Sigma-Aldrich) powder in deionized water. 0.5 mM
aqueous HAuCl4 of 2 ml were poured in a quartz cell (10 mm path length, Starna) and
extra 0.1 ml 1-propanol was added. HAuCl4 solution in quartz cell is shown in Fig.3.1
and the solution is pale yellow.
24
3.1.2 AgNO
3solution
Silver nitrate (AgNO3) (99.0%, Sigma-Aldrich) powder was dissolved in 2 ml
polyvinylpyrrolidone (PVP) (molecular weight: 10,000; Sigma-Aldrich) solution
which contained 20 mg PVP. The AgNO3 solution concentration was adjusted to 1
mM and put into a quartz cell. AgNO3 solution in quartz cell and
polyvinylpyrrolidone (PVP) chemical structure are shown in Fig.3.2. The solution is
transparent.
3.2 Instruments
3.2.1 Femtosecond laser
The experimental setup is shown in Fig. 3.3-Fig. 3.6. Linearly polarized
femtosecond laser pulses from amplified femtosecond laser (wavelength: 800 nm,
pulse duration: 160 fs, Spitfire Pro, Spectra Physics) are transmitted to an inverted
Fig.3.2 AgNO3 solution in a quartz cell (left) and polyvinylpyrrolidone (PVP)
25
microscope (IX-71, Olympus) via an objective lens (10X, N.A. 0.25, PlanN,
Olympus). Pulse energy can be adjusted by a half-wave plate, a polarizing beam
splitter, and a variable neutral density filter. Pulse energy is measured beyond an
objective lens by a power meter (842-PE, Spectra Physics). The repetition rate and
polarization of femtosecond laser pulse train is controlled by a Pockels Cell which
acts as a quarter waveplate, respectively. The conditions of all the experiments are
maintained at room temperature (24 ̊C) and one atmosphere.
Fig.3.4 A picture of inverted microscope and other attachments. Fig.3.3 Laser light source and microscopic system.
26
Fig.3.6 Transmittance spectrum of the objective lens used in the
inverted microscope.
3.2.2 UV-Vis absorption spectroscope
The UV-Vis absorption spectra are measured by a spectrophotometer (V-670,
wavelength: 190-2700 nm, JASCO). The light source comes from a deuterium lamp
and a halogen lamp. The scanning range starts from 800 nm to 200 nm and the cell
path length is set as 10 mm. Deionized water in quartz cell is measured as a baseline
before sample scanning.
27
3.2.3 Scanning Electron Microscope
The equipment of scanning electron microscope (SEM) (JSM-7401F, JEOL)
incorporates a cold cathode field emission gun, ultra high vacuum, and sophisticated
digital technologies for high resolution imaging of nanostructure. The SEM
measurement taken at 10 kV enables to observe the real surface structure while the
patented gentle beam method helps to eliminate charging of non-conductive sample.
The silicon wafer was segmented to approximately 1 cm2 piece. The plasmon
processing could remove organic contaminations and particles on the surface for
adherence of nanoparticles. After that, the silicon wafer section was sunk in 1 M
hydrochloric acid for 10 min for removing metal ions. The treated silicon wafer could
be used after washing by deionized water and drying by nitrogen gas. The sample
solution was dropped down on the treated silicon wafer and was dried repeatedly and
the frequency depended on the concentration of sample solution. Finally, we attached
the silicon wafer on the copper holder on which a copper conductive tape (TED
PELLA) and a carbon conductive tape (TED PELLA) were pasted. The graphite paint
(PELCO) spread in the edge of silicon wafer smoothly in order to increase electric
28
3.2.4 Transmission Electron Microscope
Transmission electron microscope (TEM) (JSM-2100F, JEOL) is a field emission
microscope. The highest image quality can be achieved in the 200 kV class with a
probe size under 0.5 nm. The preparation for TEM measurement is that a copper grid
(200 mesh, TED PELLA) was sunk in the sample solution for few seconds. Then the
29
4. Laser-induced reduction of HAuCl
4and AgNO
3in
solution
The HAuCl4 solution was prepared from diluting 100 mM aqueous HAuCl4
solution. The solution volume was 2 ml and extra 0.1 ml 1-propanol was added. The
HAuCl4 solution was irradiated by femtosecond laser through 10X objective lens in
the range of energy from 0.3 to 40 μJ/pulse for 180 min. The focal position was
adjusted at the center of a quartz cell in the height of 5 mm from bottom. The
extinction spectra were measured before laser irradiation and at the irradiation time of
5, 10, 20, 30, 60, 90, 120, and 180 min. The Δextinction was calculated as subtraction
between the laser exposed spectrum and the ion solution spectrum. The figure of Δextinction at 540 nm versus irradiation time was utilized since gold nanoparticles possess strong absorption and scattering around this wavelength. The peak
wavelength was selected at the maximum Δextinction value (peak) around 500 nm to
600 nm. The figure of peak wavelength versus irradiation time demonstrates the
particle size change on the basis of nanoparticle size dependence with absorption
band.
The color of HAuCl4 solution is pale yellow. While laser focuses into the solution,
30
after a period of irradiation. The figures of HAuCl4 solution before and after
femtosecond laser irradiation are shown in Fig. 4.1. It is known that the gold
nanoparticles are generated since the extinction of gold nanoparticles is approximately
located at 540 nm, which makes solution show red. Further irradiation causes the
color become deeply.
4.1 HAuCl
4concentration dependence of gold nanoparticle
preparation
The HAuCl4 solution was prepared from diluting 100 mM aqueous HAuCl4
solution and extra 0.1 ml 1-propanol was added. The three different concentration
HAuCl4 solutions (0.5, 1, and 2 mM) were irradiated by femtosecond laser through
10X objective lens at 20 μJ/pulse for 180 min. The extinction spectra were measured
Fig.4.1 The pictures of HAuCl4 solution before (left) and after (right) femtosecond
31
before laser irradiation and at the irradiation time of 5, 10, 20, 30, 60, 90, 120, and
180 min.
The Δextinction enhancement at 540 nm versus irradiation time in 2 mM HAuCl4
solution is lower than that in 0.5 mM and 1 mM HAuCl4 solution as shown in Fig. 4.2.
The obtained gold nanoparticles under the condition of 2 mM are much easy to
aggregate rather than the nanoparticles in 0.5 mM and 1 mM, which are examined by
SEM images.
The figure of peak wavelength versus irradiation time is shown in Fig. 4.3. The
peak wavelength initially shifts to shorter wavelength within 30 min and then keeps at
constant wavelength. Finally the peak shifts to longer wavelength gradually owing to
the high concentration of gold nanoparticles. The formation of large nanoparticles in
Fig.4.2 The Δextinction at 540 nm shows linear increase versus irradiation
32
high concentration becomes prominent due to nanoparticle growth and aggregation.
However, the peak wavelength in 2 mM HAuCl4 solution shifting to longer
wavelength drastically after 30 min irradiation exceeds other two concentrations. This
indicates that gold nanoparticle aggregation and particle growth are the main path in 2
mM HAuCl4 solution after 30 min irradiation. The SEM images taken in 2 mM
HAuCl4 solution demonstrate wide particle distribution and large average size. On the
other hand, large nanoparticles can scatter and absorb more light strongly, thus the Δextinction ought to be enhanced massively due to the influence of aggregation and particle growth. Nevertheless, large nanoparticles fabricated in 2 mM HAuCl4
solution never reflect the deserved enhancement of Δextinction, indicating the
fabrication in 2 mM HAuCl4 solution is relatively inefficient.
Fig.4.3 The peak wavelength versus irradiation in 0.5, 1, and 2 mM HAuCl4
solutions. The nanoparticle size changes with the evolution of irradiation time.
33
4.2 Laser energy dependence of gold nanoparticle
preparation
0.5 mM HAuCl4 solutions with the addition of 1-propanol were irradiated for
180 min at 5, 10, and 40 μJ/pulse individually. The corresponding condition is that 0.5 mM HAuCl4 solutions without1-propanol were irradiated for 180 min at 5, 10, and 40
μJ/pulse individually. The Δextinction versus wavelength at the three pulse energies are shown in Fig. 4.4. We find the enhancement of Δextinction is dependent on the
laser pulse energy. The Δextinction at higher laser energy increases quickly and
34 (a)
(b)
(c)
Fig.4.4 The Δextinction increases with the irradiation time at the pulse
energy; (a) 5 μJ/pulse, (b) 10 μJ/pulse, and (c) 40 μJ/pulse. Rapid increase in the Δextinction is observed at higher energy.
35
Fig 4.5 shows that the Δextinction around 540 nm in the presence/absence of
1-propanol at the pulse energy; 5, 10, and 40 μJ/pulse. At 5 μJ/pulse, the Δextinction
at 540 nm maintains zero in the absence of 1-propanol for 180 min irradiation but
increases linearly in the presence of 1-propanol. The color of solution in the absence
of 1-propanol is as same as the original solution. At 10 μJ/pulse, despite the Δextinction at 540 nm in the absence of 1-propanol initially maintains zero, long time irradiation still triggers the enhancement of Δextinction. After 150 min irradiation, the Δextinction starts to increase slightly. At 40 μJ/pulse, it takes 20 min at least to form gold nanoparticles in the absence of 1-propanol. No matter the HAuCl4 solution
involves 1-propanol or not, both spectra illustrate convex curve in the evolution of
long time irradiation due to the extinction saturation. Numerous gold ions are reduced
to gold nanoparticles and less gold ions are left in the solution, so the reduction rate
begins to decline step by step. As a result, the reduction cannot support the
enhancement of Δextinction and laser ablation becomes a dominant process, which
leads to particle size reduction. The decline of Δextinction after saturation attributes to
36 (a)
(b)
(c)
Fig.4.5 The Δextinction around 540 nm in the presence/absence of
1-propanol increases with the irradiation time at the pulse energy of (a) 5 μJ/pulse, (b) 10 μJ/pulse, and (c) 40 μJ/pulse.
37
0.5 mM HAuCl4 solutions with the addition of 1-propanol were irradiated for
180 min at 0.3, 5, 10, and 20 μJ/pulse individually. Fig. 4.6 shows the Δextinction
versus irradiation time at 540 nm among 4 pulse energies. Except the experiment at
0.3 μJ/pulse, the Δextinction at 540 nm increases linearly among the three different
energies and illustrates the laser energy dependence. The energy threshold of
cavitation bubble generation for the mixture of aqueous HAuCl4 solution with
1-propanol is roughly 0.4 μJ/pulse. Below 0.4 μJ/pulse, no any secondary bubble can
be observed via 10X objective lens and CCD camera. The Δextinction around 540 nm at 0.3 μJ/pulse seems to approach to zero, but actually a little of enhancement (~0.006) can be observed after 180 min irradiation, even though the energy (0.3 μJ/pulse) is
lower than threshold of cavitation bubble generation. It is depicted that gold
nanoparticles fabrication is able to be done without cavitation bubble generation. Such
low energy still enables to trigger the reduction of gold nanoparticles, which urges us
to consider the reduction mechanism without the cavitation bubble collapse-induced
radicals.
38
Fig. 4.7 illustrates the peak wavelength against irradiation time among three
energies. No peak wavelength can be found accurately at 0.3 μJ/pulse. All the three
curves have a similar concave tendency and can be divided to 3 sections according to
the progress of peak wavelength shifting. Firstly, the initial peak wavelength appears
at long wavelength after sample exposes to laser for 5 to 10 min. The initial peak
wavelength shifts to shorter wavelength drastically within 30 min irradiation.
Secondly, the peak wavelength keeps at constant wavelength during 30 to 90 min
irradiation. It means that the average size of gold nanoparticles in this period is the
same approximately. Finally, the peak wavelength shifts to longer wavelength slightly
after 90 min irradiation. In this section, the gold nanoparticle concentration is so high
that aggregation and particle growth takes place apparently. In addition, the laser
energy plays an important role on the affection of peak wavelength shift. The
Fig.4.6 The Δextinction increase at 540 nm with irradiation time shows energy
39
magnitude of laser energy can decide the gold nanoparticle size and size distribution
because of laser ablation. Small gold nanoparticles are obtained at high laser energy
and vice versa. Hence, laser energy is an indispensable parameter on particle size
selection and an important physical phenomenon.
The Δextinction at 540 nm versus energy is shown in Fig. 4.8. The irradiation time
in each energy from 1 to 12 μJ/pulse is 30 min. The points plotted nonlinearly imply
that gold nanoparticle fabrication is based on nonlinear optical phenomena. The fitting
curve is second order equation, which strongly supports the assumption of two
photons absorption of HAuCl4 solution.
Fig.4.7 The relation between peak wavelength and irradiation time depends on the
40
4.3 Irradiation time dependence of gold nanoparticle
preparation
0.5 mM HAuCl4 solution with the addition of 1-propanol was irradiated for 210
min at 40 μJ/pulse. The peak wavelength against irradiation time was recorded and shown in Fig. 4.9. The initial peak wavelength appears at long wavelength and shifts
to shorter wavelength drastically within 60 min irradiation. Then, the peak
wavelength shifts to longer wavelength slightly after 60 min irradiation. The solution
achieves saturated at 130 min approximately and then the peak wavelength starts to
decline. We suppose that the initial peak wavelength shifting to shorter wavelength
indicates the gold nanoparticle size decreases in the beginning reduction. The initial
Fig.4.8 The Δextinction at 540 nm versus laser pulse energy. The fitting curve
41
particle size is quite large due to localized high concentration of nanoparticles or
atoms around focal point. The high dense atoms or nanoparticles in a tiny volume
cause particle aggregation and growth severely. This size reduction process can be
described by laser ablation which changes the particle structure over time. The peak
wavelength shifting toward longer wavelength until 110 min is due to particle growth
and aggregation in the environment of high gold nanoparticle concentration. As the
course of irradiation, the gold ions in solution are exhausted gradually and fewer ions
exist in the ultimate process. While the formed gold atoms cannot be supplied to
further aggregate as a particle rapidly in the solution, the competitive process, laser
ablation on gold nanoparticles becomes dominant and leads to size reduction.
The SEM images and size distribution diagrams shown in Fig. 4.10 can coincide
with the figure of peak wavelength against irradiation time as shown in Fig. 4.9. At
least 120 particles in each condition were estimated and then we could plot diagrams
and calculate the average size. Fig. 4.10 (a1) and (a2) are SEM images taken on 10 min irradiation at 40 μJ/pulse. Fig. 4.10 (b1), (c1), and (d1) are SEM images taken on 60, 120, and 180 min irradiation and the corresponding size distribution diagrams are
seen in Fig. 4.10 (b2), (c2), and (d2). Fig. (a1) and (a2) show that large and small
nanoparticles coexist in the beginning of irradiation, demonstrating aggregation and
42
gold nanoparticle distribution and the average size is 32 nm. The size distribution of
gold nanoparticles by 120 min irradiation is shown in Fig. 4.10 (c2). The average size
is 37 nm and the particle size shifts to both sides, forming double peaks; some
particles become smaller, others become larger. Fig. 4.10 (d2) shows that size
distribution tends to concentrate on small scale and gold nanoparticles average size is
15 nm. These SEM images and size distribution diagrams precisely provide the direct
view on particles shape and association to spectra.
Fig.4.9 The peak wavelength against irradiation time at 40 μJ/pulse. The
43
(a1) (a2)
(b1) (b2)
(c1) (c2)
(d1) (d2)
Fig.4.10 SEM images taken at the irradiation time of (a1) & (a2) 10 min, (b1) 60
min, (c1) 120 min, and (d1) 180 min. (b2), (c2), and (d2) are the size distribution estimated from the corresponding SEM images of (b1), (c1), and (d1).
44
4.4 AgNO
3and Polyvinylpyrrolidone (PVP) concentration
dependences of silver nanoparticle preparation
100 mM AgNO3 aqueous solution was mixed in polyvinylpyrrolidone (PVP)
solution. The concentration of AgNO3 and PVP is 1 mM and 10 mg/ml respectively.
The preparation of the sample in the presence of 1-propanol was that 100 mM AgNO3
solution diluted to 1 mM AgNO3 solution of 2 ml and extra 0.1 ml 1-propanol was
added. The sample in the absence of PVP and 1-propanol was 1 mM AgNO3 solution.
The pulse energy was set at 40 μJ/pulse and the irradiation time was 180 min. The
figure of Δextinction versus irradiation time at 425 nm was utilized since silver
nanoparticles possess strong absorption and scattering in this wavelength.
We observe that the Δextinction at 425 nm rises only in the presence of PVP as
shown in Fig. 4.11. Fig. 4.12 illustrates that the color of AgNO3 solution in the
presence of PVP changes from transparent to orange and the preparation of silver
nanoparticles is quite efficient on the basis of extinction spectra. The color is
unchanged in the both cases while the sample solutions are in the absence of PVP.
However, the spectra demonstrate a little enhancement around 425 nm (~0.02) after
180 min irradiation, indicating silver nanoparticles are fabricated exactly. But, the
45
silver nanoparticle fabrication in the absence of PVP is inefficient. Hence, PVP is
decided to involve in the reduction and we will discuss the role of PVP in the sequent
experiments.
Fig.4.12 The pictures of AgNO3 solution before (left) and after (right) femtosecond
laser irradiation.
Fig.4.11 The Δextinction of AgNO3 solution at 425 nm versus irradiation time
under the three conditions; with PVP, with 1-propanol, and without any chemicals. A large extinction change was found in the presence of PVP.
46
AgNO3 aqueous solution was mixed in 20 mg/ml PVP solution and the
concentration of AgNO3 is adjusted to 0.25, 0.5, and 1 mM respectively. Fig. 4.13
shows Δextinction at 425 nm versus irradiation time among three AgNO3
concentrations at 40 μJ/pulse. It is obviously demonstrated that silver nanoparticles
fabrication is proportional to AgNO3 concentration. The factor of particle size which
may influence the extinction intensity can be excluded because the curves of peak
wavelength among different AgNO3 concentration are not consistent with Δextinction
enhancement at 425 nm. We can directly regard Δextinction enhancement at 425 nm
as the contribution of silver nanoparticles concentration. Much more silver
nanoparticles are obtained in higher concentration of AgNO3 solution, which presents
AgNO3 concentration dependence.
Fig.4.13 The Δextinction at 425 nm versus irradiation time among 0.25, 0.5, 1
mM AgNO3 concentration at 40 μJ/pulse. AgNO3 concentration dependence is
47
1 mM AgNO3 aqueous solution was mixed in 2, 5, 10, and 20 mg/ml PVP
solution respectively. The molar ratio of PVP/ AgNO3 is 0.2, 0.5, 1, and 2. The pulse
energy was set at 40 μJ/pulse and the irradiation time is 180 min.
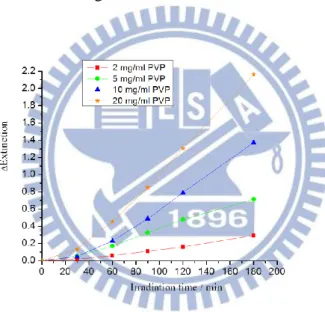
Fig. 4.14 shows Δextinction at 425 nm versus irradiation time among four
concentration of PVP. The Δextinction at 425 nm enhancement accompanies with the
irradiation time and expresses positive correlation to PVP concentration. More silver
nanoparticles are obtained in higher PVP concentration29.
Fig.4.14 The Δextinction at 425 nm versus irradiation time among four
concentration of PVP. The yield of silver nanoparticles depends on PVP concentration.
48
4.5 Discussion
4.5.1 Laser energy dependence of gold nanoparticle
preparation efficiency and bubbling threshold
The amount of reduced gold nanoparticles is dependent on the laser energy,
which is confirmed directly from laser energy dependence experiment. The
concentration of reduced atoms ought to be correlated to the photon intensity. On the
other hand, the HAuCl4 solution with 1-propanol possesses efficient optical reduction,
which implies that 1-propanol involves the reduction or acts as a stabilizer despite
1-propanol cannot reduce gold ion directly without laser irradiation. The gold
nanoparticle fabrication in the presence of 1-propanol at low laser energy exhibits an
apparent distinction compared to that in the absence of 1-propanol. It is inefficient
that the fabrication in the absence of 1-propanol at low laser energy, which is
illustrated in Fig. 4.5 (a) and (b). However, the distinction becomes close while the
laser energy is gradual rising. The increasing pulse energy shortens the incubation
time in which gold atoms aggregate to nanoparticles. Gold atom concentration is not
high enough to aggregate as a nanoparticle during incubation so no extinction signal
can be measured. It means that reduction occurs sequentially during laser irradiation
49
For long irradiation time, the saturated solution can be achieved while we
observe that the Δextinction is climaxed. At this time, the reduction rate of gold
nanoparticles is nearly equal to the laser ablation rate of gold nanoparticles. The
reduction rate starts to slow down because the concentration of gold ions is not
enough to support further reduction. High percentage of gold ions has already
converted to gold nanoparticles and meanwhile, laser ablation becomes the dominant
path. We can suppose that the competition between reduction and ablation which
exists simultaneously guides to the investigation of controlled nanoparticle size.
So, laser ablation continues working on the nanoparticles and its magnitude is
determined by the pulse energy. It is the evidence that the location of the peak
wavelength is according to the magnitude of pulse energy, indicating the strength of
laser ablation influences the nanoparticle size. Large nanoparticles may prior to be
ablated owing to high absorption for long diameter nanoparticles. Therefore, the
average size of nanoparticles declines with the increase of pulse energy.
Indeed, gold nanoparticle fabrication above bubbling threshold is observed
exactly. When the pulse energy is 0.3 μJ/pulse lower than bubbling threshold (0.4 μJ/pulse approximately) for the sample solution, eventually a little of enhancement (~0.006) around 540 nm can be observed after 180 min irradiation, indicating gold
50
gold nanoparticles by radicals generated during cavitation bubble collapse is
published in sonochemistry.
4.5.2 Irradiation time dependence of gold nanoparticle size
We find that the peak wavelength is not constant but variable with the progress
of irradiation time. We must consider two reasons together in the meantime; laser
ablation, and aggregation or particle growth. Laser ablation working on nanoparticles
persists till the end of laser irradiation and it relates to particle size intensely. The
constitution of smaller nanoparticles increases with irradiation time. One obvious
particle size reduction is observed after the solution achieves saturated. The size
distribution becomes narrow and tends to small size apparently due to the
fragmentation of large nanoparticles. The procedure can be regarded as the top-down
method which is analog to fabrication of nanoparticles by laser ablation.
The total surface free energy in the solution is fixed at constant and the surface
free energy of each particle is not proportional to its particle size. While the particle
concentration of colloidal solution achieves the critical condition, the decrease of total
surface free energy as a driving force reverses to the equilibrium state toward large
particle development. The frequent collision of particles causes aggregation which