國 立 交 通 大 學
電子物理系
碩士論文
正交結構鉺錳氧薄膜之結構與磁
各向異性研究
Structure and magnetic properties in
orthorhombic ErMnO
3thin films
研究生:張凱婷
指導教授:莊振益 教授
正交結構鉺錳氧薄膜之結構與磁各向異性研究
Structure and magnetic properties in orthorhombic
ErMnO
3thin films
研 究 生:張凱婷 Student:Kai-Ting Chang
指導教授:莊振益 Advisor:Prof. Jenh-Yih Juang
國 立 交 通 大 學
電 子 物 理 學 系
碩 士 論 文
A Thesis
Submitted to Department of Electrophysics College of Science
National Chiao Tung University in partial Fulfillment of the Requirements
for the Degree of Master
in Electrophysics
July 2009
Hsinchu, Taiwan, Republic of China
正交結構鉺錳氧薄膜之結構與磁各向異性研究
研究生:張凱婷 指導教授:莊振益 教授
國立交通大學 電子物理學系碩士班
中文摘要
本研究選用鑭鋁氧(110)與鈦酸鍶(100)兩種基板,利用雷射濺鍍分別
製備b軸與c軸垂直基板的正交結構鉺錳氧薄膜,並研究其結構與磁特性。
我們發現三個磁性轉折點,第一個轉折點發生於42K為尼爾溫度,是由錳的
反鐵磁磁序引起的;第二轉折點可能為錳的自旋重新排列所導致的,成長
於兩種基板上的鉺錳氧其第二個轉折溫度有很大的不同;最後一個出現在
低溫的轉折係因稀土元素鉺所引發的。其中,尼爾溫度和鉺的轉折不會因
成長的基板而有所不同,然而錳的自旋重新排列轉折在不同的基板上卻有
10K的差距,這可能是由於成長於不同基板上取向附生的應力所造成的差
異。此外我們也針對低氧壓環境下製備薄膜會造成的影響做了討論。
Structure and magnetic properties in orthorhombic
ErMnO
3thin films
Student: Kai-Ting Chang Advisor: Prof. Jenh-Yih Juang
Department of Electrophysics
National Chiao Tung University
Abstract
We have investigated the structure and magnetic properties of b and c-axis-oriented
multiferroic orthorhombic ErMnO3 (o-ErMO) films deposited on LaAlO3(110) and
SrTiO3(001) substrate, respectively, by pulsed laser deposition. Three distinctive magnetic
transitions were observed for o-ErMO films grown on both LAO and STO substrates. The
first one locating around 42K is apparently associated to the antiferromagnetic ordering of Mn
moment and, thus, it is assigned as the Neel temperature (TN). The second transition was
observed near 18K for o-ErMO/LAO(110), which is markedly different from the transition at
28K for o-ErMO/STO(001). The last transition was dominated by the moments from erbium
ions at lower temperatures. The two AFM transitions of Mn3+ and Er3+ moments appear to be rather insensitive to the substrates on which the films were grown. However, there is a
different substrates were used. This discrepancy seems to be more relevant to the strain
arising from film/substrate epitaxy. Besides, in order to clarify the effect of low oxygen partial
pressures on the magnetic structure, we also compare the structure and magnetic properties of
Acknowledgement
在即將結束碩班生涯的此刻,我要由衷地感謝許多人對我的提攜與照
顧。首先要感謝指導教授莊振益老師,不厭其煩的教導並指導我往正確的
方向,總讓我恍然大悟獲益匪淺。此外也很感謝溫增明老師、吳光雄老師、
林俊源老師、徐嘉鴻老師、羅志偉老師,除了提供我很多實驗上的想法之
外,從老師們身上我也學到了很多做研究的態度與方法。
兩年的光陰,實驗室共同生活的點滴,學術上的討論、言不及義的閒
扯、熬夜趕實驗的辛酸,謝謝大家的陪伴使我不孤單。感謝昌學長、宗漢
學長、訓全學長、家宏學長,從不吝於分享你們經驗與想法,總適時的拉
我一把,讓我在危機中總能化險為夷。也感謝珈芸、嘉恬、長彧、宗叡、
佩茹、家彬、錦華,在實驗上與生活中的諸多幫忙。
感謝我的好朋友們:純芝、佩蓁、佩芳、敬耀,有你們的陪伴,讓我
的碩士生活更色彩繽紛。最後要感謝家人的支持與鼓勵,讓我得以完成學
業。
Table of Contents
Abstract (In Chinese)
i
Abstract (In English)
ii
Acknowledgement
iv
Table of Contents
v
List of Tables
vi
List of Figures
vii
Chap.1 Introduction
1
1.1. Background
1
1.2. Motivation
5
Chap.2 Fundamental physical properties of RMnO
3manganites 6
2.1 Superexchange
6
2.2 Double Exchange
8
2.3 Crystal Field Effect
9
2.4 Jahn-Teller Effect
11
2.5 Crystal structure of orthorhombic RMnO
313
2.6 Model for magnetic structure of orthorhombic RMnO
314
Chap.3 Experiments
18
3.1 Sample Preparation
18
3.1.1 Target Fabrication
18
3.1.2 Pulsed Laser Deposition (PLD)
18
3.2 Characterization of Thin Film
20
3.2.1 X-ray diffraction (XRD)
20
3.2.2 α step profilometer
21
3.2.3 X-ray reflectivity (XRR)
22
3.2.4 Four-circle diffractometer (Φ scan)
22
3.2.5 Superconducting Quantum Interference Device (SQUID) 23
3.2.6 X-ray Absorption Near Edge Spectroscopy (XANES)
24
Chap.4 Results and Discussion
27
4.1 The structural and magnetic properties of target
27
4.2 The characterization of o-ErMO thin film
30
4.2.1 The structural properties
30
4.2.2 The magnetic properties
43
4.3 The effect of low oxygen pressure during deposition
52
Chap.5 Summary
55
List of Tables
Table 1.1 Classification of ferroelectrics ...2 Table 4.1 The FWHM for the films grown at various substrate temperature and different
oxygen pressure... 32 Table 4.2 The optimized thin film deposition conditions were settled at substrate temperature
880℃ with PO2=0.06 torr. The fitting parameters and in-plane mismatch between o-ErMO thin film and substrate were listed... 35
List of Figures
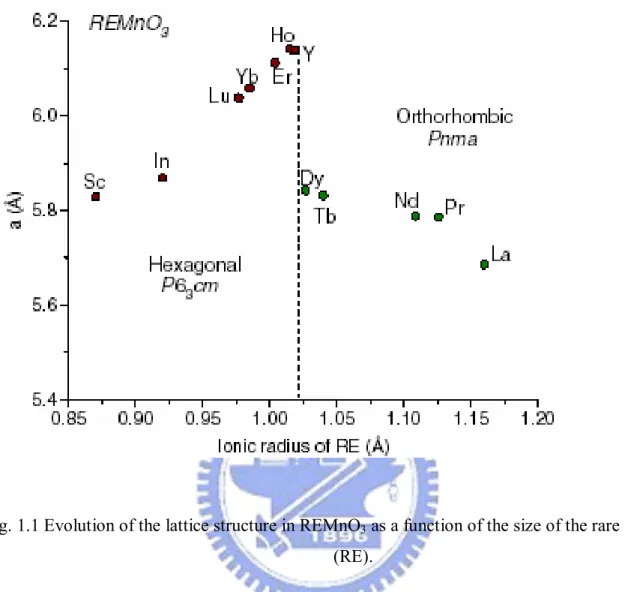
Fig. 1.1 Evolution of the lattice structure in REMnO3 as a function of the size of the rare
earth (RE)...3
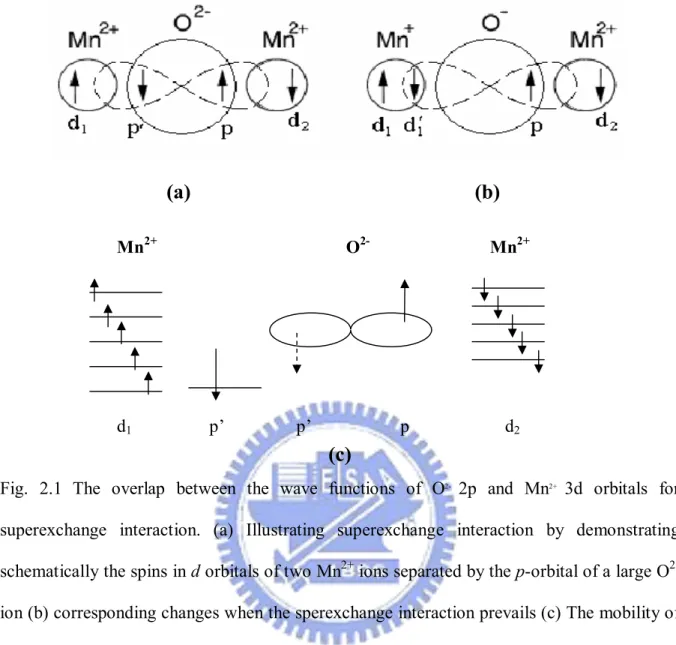
Fig. 2.1 The overlap between the wave functions of O2- 2p and Mn2+ 3d orbitals for superexchange interaction. (a) Illustrating superexchange interaction by demonstrating schematically the spins in d orbitals of two Mn2+ ions separated by the p-orbital of a large O2- ion (b) corresponding changes when the sperexchange interaction prevails (c) The mobility of electrons improves if the localized spins are polarized...7
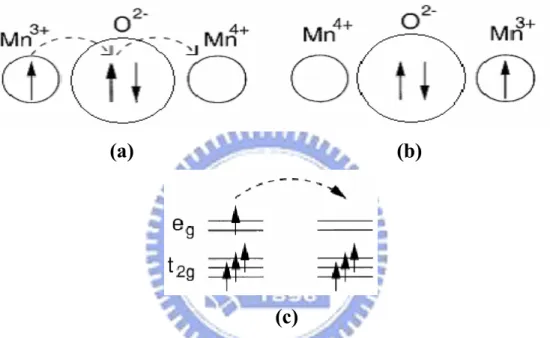
Fig. 2.2 (a)(b)The hopping processes of the double exchange (c) The mobility of electrons improves if the localized spins are polarized ...9
Fig. 2.3 The electronic distribution of five d orbitals... 10
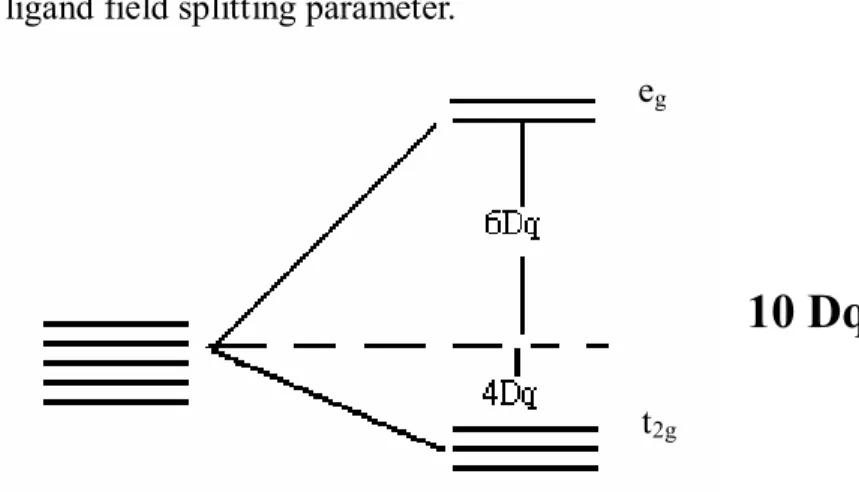
Fig. 2.4 Split energies of 3d orbitals in octahedral crystal field ... 11
Fig. 2.5 Energy splittings of the Mn 3d orbitals due to Jahn-Teller effect ... 12
Fig. 2.6 The perovskite structure ... 13
Fig. 2.7 The phase diagram of orthorhombic RMnO3... 14
Fig. 2.8 A-type magnetic structure...15
Fig. 2.9 (a) The spiral magnetic structure with spins rotating in the (b,c)-plane (b) polarization (P) lies in the plane of the spiral, but perpendicular to its propagation vector Q ...16
Fig. 2.10 The E-type magnetic structure the arrows indicate the spins of Mn3+...16
Fig. 2.11 (a) The sinusoidal spin density wave, in which spins point along one direction but vary in magnitude (b) The sinusoidal spin structure ...17
Fig. 3.1 The configuration of PLD system ... 19
Fig. 3.3 The configuration of α step profilometer... 21
Fig. 3.4 Four-circle diffractometer...23
Fig. 3.5 Superconducting Quantum Interference Device ...24
Fig. 3.6 The schematic demonstration of the typical processes involved in XAS...25
Fig. 3.7 The label of the absorption edges... 26
Fig. 4.1 The XRD θ-2θ patterns of h-ErMO powder as a function of sintering temperature ... 27
Fig. 4.2 The XRD θ-2θ patterns of h-ErMO from database ...28
Fig. 4.3 (a) Temperature dependence of the inverse susceptibility χ-1(T); (b) difference in M(T) between field-cooled (FC) and zero-field-cooled (ZFC) of h-ErMO powder Inset of (b) shows the temperature dependent magnetization M(T) ...29
Fig. 4.4 XRD pattern of o-ErMO/LAO(110) (a)(b) At different substrate temperatures (c)(d) At different oxygen pressures ...31
Fig. 4.5 The φ-scans of the o-ErMO/LAO (110) thin film deposited at PO2=6×10⁻⁴ torr ... 33
Fig. 4.6 In-plan arrangements between the o-ErMO thin films and LAO(110) substrate ... 34
Fig. 4.7 The φ-scans of the o-ErMO/LAO thin film deposited at PO2=6×10⁻² torr....34
Fig. 4.8 The AFM image of o-ErMO/LAO thin film deposited at PO2=6×10⁻² torr...35
Fig. 4.9 Split energies of d orbitals of Mn3+ in o-RMnO3 and the red rows represent the unoccupied states... 36
Fig. 4.10 The polarization-dependent O K-edge XAS spectra of o-ErMO/LAO(110) deposited at PO2=6×10⁻² torr thin film recorded at room temperature for three different polarizations: E//a-axis, E//b-axis, and E//c-axis...38
Fig. 4.11 The polarization-dependent Mn L2,3 edge XAS spectra of o-ErMO/LAO(110) deposited at PO2=6×10⁻² torr thin film recorded at room temperature for three different polarizations: E//a-axis, E//b-axis, and E//c-axis... 39 Fig. 4.12 XRD patterns of o-ErMO/STO(001) deposited at different substrate temperatures
... 40 Fig. 4.13 The φ-scans of the o-ErMO/STO(001) thin film deposited at PO2=6×10⁻² torr and
Ts=880℃ ...41 Fig. 4.14 In-plan arrangements between the o-ErMO thin films and STO(001) substrate
... 42 Fig. 4.15 The AFM image of o-ErMO/STO(001) thin film deposited at PO2=6×10⁻² torr and
Ts=880℃ ...42
Fig. 4.16 The temperature dependent magnetization of o-ErMO/LAO(110) with external field applied along respective crystal orientation... 43
Fig. 4.17 The inverse susceptibility χ-1(T) probed for H//a-axis and H//b-axis display a
transition near 18K ... 44 Fig. 4.18 The temperature dependent magnetization of o-ErMO/STO(001) with the external
field applied parallel and perpendicular to film plane...45 Fig. 4.19 The inverse susceptibility χ-1(T) probed for H//ab-plane display two transition near
45K and 28K ... 46 Fig. 4.20 The field dependent magnetization with H//c at different fixed temperature for
o-ErMnO/STO(001) deposited at PO2=6×10⁻² torr ...49 Fig. 4.21 The field dependent magnetization with H//c at different fixed temperature... ... 50 Fig. 4.22 Comparing the magnetization of o-ErMO/LAO(110) with that of o-YMnO3 and
Fig. 4.23 The field dependent magnetization with H//c at different fixed temperature... ... 53 Fig. 4.24 ZFC and FC M(T) of o-ErMO/LAO(110) deposited at PO2=6×10⁻⁴ torr with external
Chap.1 Introduction
1.1. Background
Multiferroics are materials displaying the coexistence of ordered magnetism and
ferroelectricity. One interesting characteristic of these materials is that the electric properties
can be controlled by applied magnetic field and vice versa [1-3]. In general, since the different
requirements of ferroelectricity and magnetism in filling of their d shells make these two
ordered states often mutually exclusive, few materials exhibit mutltiferroics [4]. Cheong et al.
has summarized and classified materials into ‘‘proper’’ or ‘‘improper’’ ferroelectrics according
to the mechanism resulting in ferroelectricity [5]. The proper ferroelectrics result from the
structural instability toward the polar state associated with the electric pairing. On the other
hand, the ferroelectricity whose polarization is caused by a complex distortion or an
accidental by-product of some other ordering is called ‘‘improper’’. Among these,
orthorhombic RMnO3, whose polarization is induced by magnetic orderings and hence strong
couplings between magnetism and ferroelectricity is expected, is the front runner candidate
for potentially useful applications within these multiferroicities. Therefore, understanding the
coupling between the magnetism and ferroelectricity and sketching various kinds of potential
novel applications using multiferroic RMnO3 have evoked tremendous research interest
Table 1.1 Classification of ferroelectrics [5]
The RMnO3 system is structurally divided into a couple of subsystems. As shown in Fig
1.1 [9], the RMnO3 with larger rare earths, R=La-Dy, have stable orthorhombic structure in
pbnm space group, whereas the RMnO3 with smaller rare earths, R=Sc, Y and Ho-Lu, have
stable hexagonal structure in p63cm space group. Nonetheless, metastable orthorhombic
perovskites of smaller rare earths can possibly be prepared by means of high temperature,
high pressure process [10, 11], soft chemistry procedures [12, 13] as well as being prepared in
form of thin films that are stabilized by epitaxial strain from the substrate [6-8]. These
methods of manipulating the desired structure transition in RMnO3 provide a chance to search
for more materials with potentially stronger couplings between magnetism and
ferroelectricity.
Classification of ferroelectrics
Mechanism of inversion symmetry Materials
Breaking
Covalent bonding between 3d0 BaTiO3
transition metal (Ti) and oxygen
Proper Polarization of 6s2 lone pair of Bi or Pb BiMnO3, BiFeO3,
Pb(Fe2/3W1/3)O3
Structural transition K2SeO4, Cs2CdI4
‘Geometric ferroelectrics’ hexagonal RMnO3
Charge ordering LuFe2O4
Improper ‘Electronic ferroelectrics’ Magnetic ordering Orthorhombic RMnO3 ‘Magnetic ferroelectrics’ RMn2O5, CoCr2O
Fig. 1.1 Evolution of the lattice structure in REMnO3 as a function of the size of the rare earth
(RE).
Within RMnO3 family, TbMnO3 and DyMnO3 indeed have been demonstrated to exhibit
a rather weak magnetism-induced polarization (P=0.1μC/cm2) due to the weak coupling between non-collinear magnetic phase and ferroelectricity [1, 14]. In these cases, the primary
physical mechanism is that, with the lowering of temperature, the incommensurate, collinear
sinusoidal magnetic order locks into a non-collinear spiral magnetic order which gives rise to
the spontaneous polarization. Nevertheless, the spiral magnets are not the only source of
magnetism-induced ferroelectricity. The collinear E-phase magnetic structure has also been
can be about two orders of magnitude larger than that exhibited in the helical magnets [15,
16]. Indeed, large magnetoelectric effects and spontaneous electric polarization have been
reported in the E-type orthorhombic HoMnO3 and YMnO3 [2, 3].
Furthermore, what role the rare earth plays in stabilizing the ferroelectricity is another
interesting topic under discussion. In orthorhombic HoMnO3, the considerable increase in
polarization below 15K, where the Ho magnetic moment has a major change, suggests that
the spontaneous polarization may involve rare earth moment [2]. A similar feature is shown in
DyMnO3, where the transformation of Dy magnetic moment form incommensurate structure
to commensurate one causes ferroelectric polarization [17]. Besides, the lack of long-range
magnetic order of Mn spins which is due to the paramagnetic fluctuation of Er3+ ion has been reported in orthorhombic ErMnO3 [18]. Thus, the effects of rare earth elements could also be
essential.
Understanding the complex mechanism of the coupling between magnetism and
ferroelectricity remains a challenge, especially when the additional strain introduced to
stabilize the desired crystal structure is involved. One way to refine our understanding of the
effective magnetoelectric coupling in RMnO3 systems is to explore how the structure,
magnetic order, and rare earth affect ferroelectricity in orthorhombic RMnO3 in a more
systematic manner.
1.2. Motivation
In this study, we investigated the properties of orthorhombic ErMnO3 (o-ErMO), which
is a collinear E-type AFM material at low temperatures. Since it has been predicted that
relatively strong ferroelectricity could arise in a collinear E-type magnetic structure [15] and
an additional magnetic structure transition in o-ErMO has been confirmed and was also
speculated as the ICM-AFM to E-type AFM transition through the heat capacity measurement
[11], thus, o-ErMO is expected to exhibit enhanced behavior of magnetelectric coupling. In
addition, as mentioned above, for RMnO3 with the rare earth ionic size of R smaller than that
of Dy thermodynamically stable structure is hexagonal structure. Therefore, for example, the
o-ErMO samples studied previously were all prepared either by soft chemical procedures or
by high-pressure synthesis and were all inevitable polycrystalline in nature. That had limited
the capability to directly test the predicted properties along different orientations. As the
difficulties in obtaining the single crystal o-ErMO are unavoidable, we prepared o-ErMO thin
films to try to address the relevant issues. As shown in Fig. 1.1, since ErMnO3 just locates
beside HoMnO3, which is on the verge of the transition point, it is more likely to obtain pure
o-ErMO. Finally, o-ErMO provides a chance to study the role of the rare earth in affecting the
magnetism and the associated ferroelectricity. In brief, the primary motivation of this study is
to search for a potential prototype material exhibiting the intriguing magnetism-induced
Chap.2
Fundamental physical properties of RMnO
3manganites
In this study, we want to investigate the magnetism in o-ErMO, so we have to penetrate
the fundamental basis for magnetic behavior in the manganites. The main source of
magnetism in manganites is the result of the interaction among spins of magnetic Mn ions
with partially filled d shells. The magnetic coupling between Mn d electrons via O p-orbital
strongly depends on the d-orbital configurations. For example, superexchange and double
exchange are primary interactions between spins of Mn ions and how they work is relevant to
the d-orbital configurations. In the o-ErMO, Mn3+ ions linking atiferromagnetically are due to the superexchange, while the electron hopping from Mn2+ ions to Mn3+ producing ferromagnetic interaction is attributed to double exchange.
2.1 Superexchange
Superexchange is the magnetic coupling between two next-to-nearest neighboring
magnetic positive ions through a non-magnetic anion. For example, the antiferromagnetic
coupling occurs in Mn-O-Mn chain of MnO6 octahedron crystal structure [19]. Fig 2.1
illustrates superexchange interaction by demonstrating schematically the spins in d orbitals of
two Mn2+ ions separated by the p-orbital of a large O2- ion (Fig. 2.1 (a)), and the corresponding changes when the sperexchange interaction prevails (Fig. 2.1 (b)).
(a) (b)
Mn2+ O2- Mn2+
d1 p’ p’ p d2
(c)
Fig. 2.1 The overlap between the wave functions of O2- 2p and Mn2+ 3d orbitals for
superexchange interaction. (a) Illustrating superexchange interaction by demonstrating schematically the spins in d orbitals of two Mn2+ ions separated by the p-orbital of a large O2- ion (b) corresponding changes when the sperexchange interaction prevails (c) The mobility of electrons improves if the localized spins are polarized.
Since the distance between the Mn2+ ions is too large to result in direct interaction between them, the effect of kinetic exchange needs to be mediated via the covalent interaction
between the Mn2+ ion and the O2- ion orbitals. The hybridization of d and p orbitals nominally allows the p’ electron to partially reoccupy the d1 state of Mn2+ ions. According to Hund’s
rule, the spin of the electron in p’ orbital of O2- ion must be antiparallel to the spins of the electrons in d1 orbital of Mn2+ ions. Besides, the remaining electron in p state has to be
antiparallel to the former one (electron in p’) based on Pauli Exclusion Principle. Finally, the
spins of the other Mn2+ ion (electrons in d2) should be antiparallel to the spin of the remaining
electron of O2- ion (electron in p) due to the interaction between them. Therefore, the neighboring manganese ions are effectively coupled by the bridging of oxygen ion and form
antiferromagnetic ordering.
2.2 Double Exchange
Double-exchange, originally proposed by Clarence Zener [20], is a mechanism that
explains how electrons exchange between two species and why materials are ferromagnetic.
For instance, the eg orbitals of Mn ions could directly interact by the 2p orbitals of O as a
result of the electron hoppings among Mn3+-O2-Mn4+ chain. The degeneracy of the d states of transition metal manganese is lifted and split into a double (eg) and a triplet (t2g)by crystal
field. Hence, the configurations of Mn3+ and Mn4+ are denoted as t2g3eg1 and t2g3eg0,
respectively. One electron in the p-orbital of O2- ion hops onto the empty eg orbital of Mn4+
ion and another electron in the eg orbital of Mn3+ ion concurrently hops onto the p-orbital of
O2- ion.
This process is effectively equivalent to the effect that the electron directly hops form Mn3+ to Mn4+ and could be described as followings,
Mn
1↑3+O
2↑,3↓Mn
4+→ Mn
4+O
1↑,3↓Mn
2↑3+moments of these hopping electrons must be parallel to each other, leading to the
ferromagnetic alignment in two manganeses. However, the geometric shape of the
environment would affect the virtue of hopping. Namely, the effect is enhanced as the angle
between the orientations of the two spins is decreased [21]. The effectiveness is zero for
antiparallel spins, whereas the effectiveness is the largest for parallel ones.
(a) (b)
(c)
Fig. 2.2 (a)(b)The hopping processes of the double exchange (c) The mobility of electrons improves if the localized spins are polarized.
2.3 The Crystal Field Effect
The presence of an electrical field between the neighboring ions will affect the energies
of the valence orbitals of the local ions. Since the localized electrons in d or f states are
influenced by the electrostatic field arising from the surrounding ions, the effect was called
crystal field. In this study, we only focus on the effect of octahedral crystal fields on
the point charges, all p orbitals of Mn ions have the same degree of interaction with the
ligands. Thus, p orbitals remain degenerate. However, the extra repulsion between the
electrons in p orbitals and the point charges of the ligands raised the energies of p orbitals.
Fig. 2.3 The electronic distribution of five d orbitals [22]
On the other hand, repulsion between the electrons of the O2- ions and the electrons in
3d orbitals of the Mn ion in the MnO6 octahedron not only increases but also splits the energy
of these orbitals. In this octahedral field effect, the 3dx2-y2 and 3d3z2-r2 orbitals belong to the eg
symmetry group, while the 3dxy, 3dxz, and 3dyz orbitals belong to the t2g symmetry group. Two
of 3d orbitals (3dx2-y2 and 3d3z2-r2) have lobes which point directly towards the point charges of
3dxz, and 3dyz) have lobes which point toward the direction between the charges, and so have a
weaker electrostatic repulsion. Furthermore, the energy difference between the two sets of
orbitals from the 3d shell in the crystal field is 10Dq, where energy conservation suggests that
the energies of the t2g orbitals be lowered by 4Dq and the eg orbitals be raised by 6Dq [23].
Where 10Dq is ligand field splitting parameter.
eg
10 Dq
t2gFig. 2.4 Split energies of 3d orbitals in octahedral crystal field
2.4 The Jahn-Teller Effect
For highly symmetrical molecules, there always exists at least one non-totally
symmetric vibration that makes electronically degenerate states unstable. This instability
would distort the crystal, reduce its symmetry and lower its energy to break the degeneracy.
The appearance of this distortion is the Jahn-Teller effect [24]. Assuming that the octahedron
is elongated along the z-axis, then, since the repulsion between the electron in 3d3z2-r2orbital
and the ligand decreases, the energy of 3d3z2-r2orbital is lower. On the contrary, as an electron
in 3dx2-y2 orbital is repelled by the shortened ligands on the x- and y-axis, the energy of 3dx2-y2
is repelled by the closer ligands on the x- and y-axis, whereas 3dyz and 3dxz, similar to 3d3z2-r2,
are lowered in energy since the electrons occupying these states experience weaker repulsion
from the longer ligands on the z-axis. Hence, the t2g state would also split into two states.
Similarly, the compression on the z-axis will lower the energy level of the 3dx2-y2 and 3dxy
orbitals and raise the energy of the 3d3z2-r2, 3dyz and 3dxz levels. The processes are depicted
schematically in Fig. 2.5 shown below.
x2-y2 3z2-r2
3z2-r2 x2-y2 xy yz, xz yz, xz xy
Fig. 2.5 Energy splittings of the Mn 3d orbitals due to Jahn-Teller effect [25]
It is also worth noting that the Jahn-Teller distortions are relatively strong in complexes
with d4 (high spin) and d9 configuration in comparison with d1, d2, d4 (low spin), d5 (low spin),
not direct toward ligands so the splittings is smaller.
2.5 Crystal structure of the orthorhombic manganites (RMnO
3)
Orthorhombic RMnO3 belongs to perovskite-structure oxides, ABO3, which have the
prototypical cubic structure shown in Figure 2.6. The cubic perovskite structure is
characterized by a cation, B, residing at the center of the octahedron, which is surrounded by
six oxygen anions, with another cation, A, locating at the corner of the unit cell. Where A and
B are R and Mn, respectively [26]. As shown in Fig. 2.6, six oxygen anions bond with Mn to
form an octahedron. The degenerate energy states of 3d orbitals would split into two energy
levels (eg and t2g) due to the influence of crystal field. The degeneracy of these two levels
would be lifted again due to the Jahn-teller distortion. The lattice constants, bond length
between Mn and O and bond angle of Mn-O-Mn would be adjusted as a consequence of the
Jahn-Teller effect experienced by different rare earth elements. There is a tendency that the
smaller ions size is, the stronger the Jahn-Teller effect is [27].
rare earth O
Mn
Moreover, the serial compounds of orthorhombic RMnO3 are usually described by Pbnm
and Pnma space groups. In addition to primitive, there are three parts of the space group
symbol indicating the symmetry with respect to the x, y, and z axis directions, respectively.
Thus, for example, the space group symbol Pnma indicates a primitive lattice with an n-glide
plane perpendicular to the x axis, a mirror plane perpendicular to the y axis, and an a-glide
plane perpendicular to the z axis. In this work, we use Pbnm type to depict the crystal
symmetry, but these two types could be converted to each other.
2.6 Models for magnetic structure of orthorhombic RMnO
3Fig. 2.7 The phase diagram of orthorhombic RMnO3 [11]
The magnetic structure evolves with the ion size of rare earth elements according to the
phase diagram reported by Makoto Tachibana et al. [11] For R=La-Sm, A-type
antiferromagnetic (AF) order is induced by in-plane orbital order below the Neel temperature,
TN, which decreases gradually with reducing ion size. For R=Eu and Gd, a sinusoidal
A-type structure will modulate with temperature on cooling. This IC structure also subsists
with increasing q (0<q≦0.5) for smaller ions. However, the A-type AF structure does not
remain steady as the ion size is smaller than that of Gd. The IC structure transforms to a spiral
structure as temperature decreasing for R= Tb and Dy, while it locks to the E-type AF
structure with q= 0.5 for R=Ho-Lu. Several common magnetic structures relevant to the
orthorhombic RMnO3 are listed as follows:
The A-type magnetic structure
In this case, the spins exhibit ferromagnetic (FM) order within the ab plane and
antiparallel antiferromagnetic (AF) interplanar couplings.
Fig. 2.8 A-type magnetic structure [17,26] the arrows indicate the spins of Mn3+
The spiral magnetic structure
An incommensurate spiral structure has spins rotate in one plane, which breaks spatial
inversion symmetry to induce polarization. For example, the spins rotate in the bc plane in
(a) (b)
Fig. 2.9 (a) The spiral magnetic structure with spins rotating in the (b, c)-plane [28] (b) polarization(P) lies in the plane of the spiral, but perpendicular to its propagation vector Q [29]
The E-type magnetic structure
The E-type AF structure, where the existence of large polarization is predicted, is
characterized by FM and AF arrangement along the a and b axes with q = 0.5, respectively.
The interplanar coupling is also AF coupling in this case.
Fig. 2.10 The E-type magnetic structure [17, 26] the arrows indicate the spins of Mn3+
The sinusoidal magnetic ordering
The sinusoidal spin order, similar to the E-type one, has a wave vector propagating
along the b axis and has zigzag chains of parallel spins on the ab plane directing along the a
neighboring zigzag chains with incommensurate wave q (0<q<0.5).
Fig. 2.11 (a) The sinusoidal spin density wave, in which spins point along one direction but
Chap.3 Experiments
3.1 Sample Preparation
3.1.1 Target Fabrication
The hexagonal ErMnO3 bulk prepared by solid-state reaction methods were used as
target for pulsed laser deposition. We start with mixing the MnCO3 (99.95%) and Er2O3
(99.9%) powders with proper proportions and preheat the mixture at 1100℃ for 8 hours to
fully facilitate reactions among the constituents. The solidified mixture was then pressed,
ground and sintered at 1350℃ for 36 hours. After repeating the above process three times, we
pressed the product into pellet for final sintering process conducted at 1350℃ for 36 hours.
To promote the crystalline quality of the sintered pellet, the increment of heating and cooling
was kept at 5℃ per minute during the process.
3.1.2 Pulsed Laser Deposition (PLD)
PLD [30] is essentially a physical vapor deposition process viable for fabricating thin
films with complicated stoichiometry. In PLD process, a high energy laser pulse is focused on
the surface of a solid target to explosively evaporate the target material. After absorbing
strong electromagnetic radiation, local area of the solid target is instantaneously vaporized to
form a laser plume which would be deposited on chosen substrate. When grown on proper
substrates and under appropriate conditions, the structure of ErMnO3 transforms from
deposition conditions, the films were grown by 248nm KrF excimer laser with laser energy
density modulating from 2 to 4 J/cm2, repetition rate varying from 3 Hz to10 Hz, substrate temperature (Ts) changing from 700℃ to 880℃, and oxygen pressure ranging between 0.1
torr to 10-4 torr.
Fig.3.1 The configuration of PLD system
A schematic diagram of the PLD system is shown in Fig. 3.1, and the detailed
procedures for preparing the o-ErMO films are described below:
1. Clean the substrate in acetone, methanol, and DI water under ultrasonic vibration for 5
minutes, respectively.
3. Attach the substrate on the stainless steel plate by silver paste.
4. Heat the plate at 150 ℃ ill the silver paste is solidified. t
5. Clean the surface of substrate by nitrogen gas.
6. Put the plate in the chamber of PLD system with thermal couple imbedded.
7. Pump the chamber till the base pressure is lower than 10-6torr for 1 hour at least.
8. Heat the substrate to the preset temperature.
9. Aerate the chamber with oxygen to the expected pressure.
10. Set the power, repetition rate and counts of excimer pulsed laser.
11. Start to deposit the film on the substrate.
12. Cool the thin film in 400 torr O2 environment to room temperature with the heater off.
13. Take out the sample.
3.2 Characterization of Thin Film
3.2.1 X-ray diffraction (XRD)
We analyzed the crystal structure of ErMnO3 by X-ray diffraction (XRD) measurements.
XRD [31] is a rapid analytical technique to measure the average spacing between layers or
rows of atoms, determine the orientation of crystal and find the crystal structure of an
Fig. 3.2 The schematic illustration of the XRD process
Where d is the distance between successive parallel planes, θ is the angle between the incident
X-ray and the normal of the lattice plane, n is an integer, and λ is the wavelength of the X-ray.
XRD can also be used as a tool for the preliminary analysis of composition. The simple
schematic illustration of XRD is shown in Fig. 3.2.
3.2.2 α-step profilometer
Fig. 3.3 The configuration of α step profilometer
Alpha-step profilometer is an instrument probing the surface profile of a surface and is
used to measure the thickness of thin film. This instrument consists of a stylus that is dragged
the topography of the sample, and the height profile is recorded. According to the height
profile, the thickness and roughness are assessed.
3.2.3 X-ray reflectivity (XRR)
X-ray reflectivity (XRR) is a technique for precise measurement of the thickness of a
thin layer. When impinged on a sample below the critical incidence angle, which is related to
the material of the film, XRR exhibits total external reflection. In contrast, as the angle of
reflection is increased to exceed the critical angle, X-ray penetration occurs and the X-ray
reflected from the buried interface interfere with surface reflected radiation to give rise to
interference fringes. Therefore, the thickness and interfacial roughness of the sample could be
measured. Because this technique does not rely upon material crystalline, it can be used to
characterize amorphous as well as crystalline layers. In this study, we obtain the thickness of
thin film by the periodicity of the obtained Kiessig fringe.
q T
2 Where T is the thickness
and Δq is periodicity of Kiessig fringe.
3.2.4 Four-circle diffractometer (Φscan)
Four-circle diffractometer, where the four circles are θ, χ, Φ, and 2θ, was used to
determine the texture, lattice parameters, and epitaxial relationship between film and substrate.
It is an instrument frequently used in X-ray crystallography to determine the shape and
symmetry of the unit cell of the film. After placed in the goniometer head with an arbitrary
radiation as a function of beam and sample orientation. If the dimensions of the unit cell were
known, they can be used to calculate the settings of the four angles needed to observe a
specific orientation.
Fig. 3.4 Four-circle diffractometer
3.2.5 Superconducting Quantum Interference Device (SQUID)
SQUID [32] is a delicate equipment integrating electronic, mechanical,
low-temperature, and vacuum techniques for measuring magnetization with extremely high
sensitivity and precision. SQUID combines two Josephson junctions connecting in parallel. It
is used to measure extremely weak signals and its sensitivity is about 10-8 emu with 0.1T external magnetic field applied. The Josephson junction often consists of a tunnel barrier
sandwiched between two superconducting electrodes. A much more sensitive direct current
electrons tunneling through the junctions demonstrate quantum interference, dependent on the
strength of the external magnetic field within a loop. Since demonstrating resistance in
response to even slight variations in a magnetic field, DC SQUID is presently the most
sensitive magnetometer available.
Fig. 3.5 Superconducting Quantum Interference Device
3.2.6 X-ray Absorption Near Edge Spectroscopy (XANES)
X-ray absorption spectroscopy (XAS) is an essential tool to detect electronic structures
of specific atoms in a solid. When the x-rays hit a sample, the oscillating electric field of the
electromagnetic radiation interacts with the electrons bound in an atom. The radiation will be
Fig. 3.6 The schematic demonstration of the typical processes involved in XAS
When the energy of the incident photons is just sufficient to cause excitations of the
core electrons in the absorbing atom to a continuum state by dipole selection rule with no spin
changes, absorption edge will occur. The resulting core hole is filled by the capture of an
electron from another shell followed by the emission of a fluorescent photon, most of which
further excites the Auger electron. Then, the spectrum of fluorescence photon and Auger
electrons can delineate the change in relevant electronic structure. The energies of the
absorbed radiation at these edges correspond to the binding energies of electrons in the K, L,
M, etc., shells of the absorbing elements. The absorption edges are labeled in the order of
increasing energy K, LI, LII, LIII, MI, corresponding to the excitation of an electron from the 1s
Fig.3.7 The label of the absorption edges
An x-ray absorption spectrum is generally divided into four regimes: 1) pre-edge (E <
E0); 2) x-ray absorption near edge structure (XANES), where the energy of the incident x-ray
beam is E = E0 ± 10 eV; 3) near edge x-ray absorption fine structure (NEXAFS), in the region
between 10 eV up to 50 eV above the edge; and 4) extended x-ray absorption fine structure
(EXAFS), which starts approximately from 50 eV and continues up to 1000 eV above the
edge. Where E is the energy of photoelectrons and E0 is the binding energy. We only focus
Chap.4 Results and Discussion
4.1 The structural and magnetic properties of target
The hexagonal ErMO3 (h-ErMO) bulk prepared by solid-state reaction method was
used as target for PLD to deposit o-ErMO thin films. In order to make high quality thin film,
it is essential to fabricate good quality target. Before pressing the ErMnO3 to produce sample
pellet, we tuned the heating temperature from 1100℃ to 1400℃ to optimize the sintering
condition. As shown in Fig. 4.1, the XRD pattern of h-ErMnO3 powder sintered at different
temperatures indicated that 1350℃ was the most suitable temperature for target due to the
extent of independence of the peaks and the fineness of them.
10 20 30 40 50 60 70 80 1100C 1200C ( 208 ) (402) (225 ) (314 ) (224) (108) (008) (117) (2 2 2 ) (304) (2 2 1 ) (2 20) ( 206 ) (1 1 6 ) (2 1 4 ) (3 0 2 ) (300 ) (106) (115) (212) (204) (114 ) (202) (1 04) (112) (004 ) (111) (110) (1 0 2 ) database (0 0 2 ) 1300C In te n si ty [a .u .] 2[degrees] 1350C 1400C
Fig. 4.2 The XRD θ-2θ patterns of h-ErMO from database
Temperature dependent magnetization M(T), inverse susceptibility χ-1(T) and difference in M(T) between field-cooled (FC) and zero-field-cooled (ZFC) of h-ErMnO3
powder scraped from the target are shown in Fig. 4.3. In addition to structural properties, the
Neel temperature, observed at 74K in magnetization M(T), also exhibits the characteristic of
(a)
(b)
Fig. 4.3 (a) Temperature dependence of the inverse susceptibility χ-1(T); (b) difference in M(T)
between field-cooled (FC) and zero-field-cooled (ZFC) of h-ErMO powder Inset of (b) shows
the temperature dependent magnetization M(T)
0 20 40 60 80 100 0.0 0.5 1.0 1.5 2.0 2.5 3.0 H=100Oe ZFC FC ( 1 0 3 e m u -1 -g -O e ) T(K) 74K 0 50 100 150 200 250 300 -1 0 1 2 3 4 ( 1 0 -4 e mu -g -1 -O e -1 ) T(K) fczfc H=100Oe 74K 0 50 100 150 200 250 300 0 2 4 6 8 10 12 14 ZFC FC ( 1 0 -3e m u -g -1-O e -1) T(K) H=100 Oe
4.2 The characterization of o-ErMO thin film
4.2.1 The structural properties
When grown on proper substrates and under appropriate conditions, the orthorhombic
structure of ErMnO3 can be stabilized by the epitaxial strain between film and substrate
during PLD process. To optimize the deposition conditions, the films were grown by using
KrF excimer laser with laser energy density modulating from 2 to 4 Jcm-2, repetition rate varying from 3 Hz to10 Hz, substrate temperature changing from 700℃ to 880℃, and oxygen
pressure ranging between 0.1 torr to 6×10⁻⁴ torr. Fig. 4.4 show the XRD θ-2θ patterns of o-ErMO films deposited on LaAlO3 (110) [LAO (110)] substrate at different substrate
temperatures (Ts) and various oxygen pressures (PO2). The (020) peak diffraction peak of
o-ErMO appears to shift toward lower 2θ angles with increasing Ts, indicating that the b
lattice constant is increasing, presumably due to the relation of compressive strain along
b-axis. Similar trend was also observed with decreasing oxygen partial pressure during
deposition. One of the possible reasons for this is that at low PO2 environment, since colliding with fewer particles, the evaporated particles arriving the substrate surface are left with higher
kinetic energy and higher mobility on the substrate. A kin to those deposited at higher
substrate temperatures, the higher surface mobility of the arriving particles might
accommodate to the substrate better and lead to less in-plane tensile strain between substrate
10 15 20 25 30 35 40 45 50 55 60 65 70 75 80 700C 2degree 10 15 20 25 30 35 40 45 50 55 60 65 70 75 80 800C 10 15 20 25 30 35 40 45 50 55 60 65 70 75 80 0 -E rM O (0 2 0 ) 850C In te n s it y ( a .u .) 10 15 20 25 30 35 40 45 50 55 60 65 70 75 80 L A O (2 2 0 ) L A O (1 1 0 ) 880C 5 10 15 20 25 30 35 40 45 50 55 60 65 70 75 80 2degree 6torr 5 10 15 20 25 30 35 40 45 50 55 60 65 70 75 80 6torr 5 10 15 20 25 30 35 40 45 50 55 60 65 70 75 80 In te n s it y ( a .u .) 6torr 5 10 15 20 25 30 35 40 45 50 55 60 65 70 75 80 L A O ( 2 2 0 ) L A O ( 1 1 0 ) 0 -E rM O (0 2 0 ) 0.1 torr
stretching in a and c direction will be somewhat eased and result in increasing lattice constant
of the b-axis. (a) (b) PO2= 6×10⁻² torr (c) (d) Ts=880℃
Fig. 4.4 XRD pattern of o-ErMO/LAO(110)
(a)(b) At different substrate temperatures (c)(d) At different oxygen pressures
The full width at half maximum intensity (FWHM) of the rocking curves taken at
30 31 32 33 34 35 880 C 850 C 800 C 700 C L A O( 1 1 0 ) 0 -E rM O( 0 2 0 ) In te n s it y ( a .u .) 2degree 30 31 32 33 34 0 -E rM O (0 2 0 ) L A O (1 1 0 ) 0.1 torr 610-2 torr 610-3 torr 610-4 torr In te n s it y ( a .u .) 2 (degree)
o-ErMO(020) diffraction peak of all samples grown at different pressures and different
temperatures are listed in Table 4.1. These data were obtained by fitting the measured (020)
peaks of o-ErMO with Gaussian function. The progressive improvements of the FWHM with
either increasing substrate temperatur or decreasing oxygen pressure indicate that the
crystalline quality of the film is improved with the same trend. The smallest FWHM was 0.47°
for the film grown at 880℃ and 6×10⁻⁴ torr; thus, this condition was chosen as optimal condition in the beginning.
Table 4.1 The FWHM for the films grown at various substrate temperature and different oxygen pressure
PO2= 6×10⁻² torr Ts=880℃
However, φ-scans of the o-ErMO(110) peak for PO2=6×10⁻⁴ torr indicated three pairs of twofold symmetry, where one was well aligned with the twofold symmetry of LAO(100) and
the others shifted 70 degrees with respect to the preceding twofold symmetry (Fig. 4.6). This
result revealed that the film for P =6×10⁻⁴ torr exhibits a twin-like structure with diagonal Pressure (to rr) FWHM(°) 1×10⁻¹ 0.774 6×10⁻² 0.691 6×10⁻³ 0.489 6×10⁻⁴ 0.466 Temperature (℃) FWHM(°) 700 0.996 800 0.817 850 0.726 880 0.687
line coincidence. By comparing with previous results [6, 7], depositing films in low PO2 circumstance was the main reason to cause this twin-like structure. In order to compromise
the film quality against epitaxial relations between film and substrate, the optimal condition
was modified to Ts= 880℃ and PO2=6×10⁻² torr. At these modified conditions, φ-scans of the
film (Fig. 4.7) showed that the film deposited at PO2 = 6×10⁻² torr was a perfectly twofold symmetry indicating the film is having an excellent orthorhombic structure with three crystal
orientations distinctively aligned with the substrate. Fig. 4.8 shows the spindle-like grains of
o-ErMO in the AFM image, suggesting that the film align in the specific crystallographic
directions of LAO (LAO[001]//o-ErMO(001) and LAO[1-10]//o-ErMO[100]). Thus, it was
clear that a-axis could be differentiated from c-axis by anisotropic shape of the grain
morphologies.
PO2=6×10⁻² torr PO2=6×10⁻⁴ torr
PO2=6×10 -4 torr -50 0 50 100 150 200 250 300 350 400 In te n s it y ( a .u .)
phi scan of o-ErMnO3(110)
phi scan of LaAlO3(100)
degree)
Fig. 4.6 The φ-scans of the o-ErMO/LAO (110) thin film deposited at PO2=6×10⁻⁴ torr
PO2=6×10⁻² torr
Fig. 4.7 The φ-scans of the o-ErMO/LAO thin film deposited at PO2=6×10⁻² torr
-50 0 50 100 150 200 250 300 350 400
phi scan of LaAlO3(100) phi scan of o-ErMnO3(110)
(degree) In ten si ty (a .u .)
PO2=6×10⁻² torr
[001]ErMO&[001]LAO
[100]ErMO&[1-10]LAO
Ra=0.521 nm
Rq=0.711 nm
Fig. 4.8 The AFM image of o-ErMO/LAO thin film deposited at PO2=6×10⁻² torr. The arrows indicate the growth direction of grain.
Table 4.2 The optimized thin film deposition conditions were settled at substrate temperature 880℃ with PO2=0.06 torr. The fitting parameters and in-plane mismatch between o-ErMO
thin film and substrate were listed as follows:
a (Å) b (Å) c (Å) V (Å3) o-ErMnO3on LAO(110) 5.25 5.78 7.45 227.37
Powder 5.23 5.80 7.34 222.70
LAO(110) substrate 5.35 7.56
in-plane mismatch with
substrate 2.23% 3.04%
Comparing to lattice constants reported for the o-ErMO powders with a =5.23 Å,
b=5.80 Å, and c=7.34 Å, the obtained lattice constants a =5.25 Å, b=5.78 Å, and c=7.49 Å for
the present o-ErMO/LAO(110) films evidently indicated an in-plane stretch along the a- and
c-axis. This is not surprising considering that the thickness of the films was about 130 nm as
derived from the periodicity of Kiessig fringe from X-ray reflectivity measurement.
x2-y2 3z2-r2 xy,yz,zx 3x2-r2 y2-z2 xy,yz,zx
Fig.4.9 Split energies of d orbitals of Mn3+ in o-RMnO3 and the red rows represent the
unoccupied states
Next, we discuss the electronic structure of the epitaxially-stabilized o-ErMO films. In
manganites, the energy levels split into two symmetry groups (eg and trg) as a result of crystal
field and then the degeneracy of symmetry group is broken again due to Jahn-Teller Effect. As
the theoretical calculation and XAS spectra in TbMnO3 and DyMnO3 revealed, the energy
level would display as Fig. 4.9 for consideration to the in-plane strong bonding anisotropy.
Additionally, according to the results reported by Chen et al. [35], the spectra could be
the hybridization of O 2p and Mn 3d states. On the other hand the feature near 535 eV is due
to O 2p states hybridized with Er 5d states and the final feature near 542 eV is ascribed to a
band mixed with Mn 4sp and Er 6s states. Here, we will only focus our attention on the region
of O 2p states hybridized with Mn 3d states, which is believed to be more relevant to the
magnetic orderings and associated magnetoelectric effects. As shown in Fig. 4.10, the
corresponding features could be represented as eg ↑(d3x2-r2), t2g ↓(dxy,yz,xz), eg ↓(d3z2-r2) and eg ↓(dx2-y2) , which are associated with transitions from the O 1s core level into empty O 2p states induced by hybridization with unoccupied majority-spin bands of Mn. The fact that the XAS
spectra display marked anisotropy when probed along respective crystalline axis further
indicate that the structure of ErMnO3 indeed orthorhombic and the crystalline axes of these
Fig. 4.10The polarization-dependent O K-edge XAS spectra of o-ErMO/LAO(110) deposited
at PO2=6×10⁻² torr thin film recorded at room temperature for three different polarizations: E//a-axis, E//b-axis, and E//c-axis
525 530 535 540 545 550 555 E//a E//b E//c F L u o re s c e n c e Y ie ld ( a rb . U n it s )
Photon Energy (eV) Mn 3d Er 4d Mn 4sp/ Er 5sp 528 529 530 531 532 533 t 2g(dx2-y2) t2g(d3z2 -r2) t2g(dxy yz zx) E//a E//b E//c F L u o re s c e n c e Y ie ld ( a rb . Un it s )
Photon Energy (eV) eg(dx2
Fig. 4.11The polarization-dependent Mn L2,3 edge XAS spectra of o-ErMO/LAO(110
deposited at PO2=6×10⁻² torr thin film recorded at room temperature for three different polarizations: E//a-axis, E//b-axis, and E//c-axis
Fig. 4.11 shows polarization-dependent Mn L2,3 edge absorption spectra of o-
ErMO/LAO thin film collected with E//a, E//b, and E//c and that of standard MnO, Mn2O3,
and MnO4 powders. There was only slight difference in Mn L2 peak for electric field applying
along various directions, while the shape of Mn L3 peak for E//b was more similar to trivalent
manganese, indicating that the ionic valence of Mn spin in o-ErMO was trivalent and its
projection on b-axis was more than on other directions. Although there was no neutron
640 660 E//a E//b E//c Mn2+ Mn3+ Mn4+
T
o
tal E
lect
ro
n
Y
ield
(
ar
b
. u
n
it
s)
Photon Energy (eV)
MnO Mn2O3 MnO2 Mn-L3 Mn-L2
Mn-L2,3 XAS spectra
0 10 20 30 40 50 60 70 80 2degrees 0 5 10 15 20 25 30 35 40 45 50 55 60 65 70 75 80 85 0 10 20 30 40 50 60 70 80 In te n s ilt y [ a .u .] 0 10 20 30 40 50 60 70 80 0 10 20 30 40 50 60 70 80 o -E rM O (0 0 6 ) o -E rM O (0 0 4 ) o -E rM O (0 0 2 ) S T O (0 0 3 ) S T O (0 0 2 ) 700C 750C 800C 850C 880C S T O (0 0 1 )
diffraction data to illustrate the magnetic structure of o-ErMO, it was well established that the
Mn3+ spins in o-HoMO and o-YMO aligned in b-axis by neutron diffraction measurement. Thus, more projection on b-axis could be understood. Besides, the main Mn L2,3 peaks for
E//b polarization in XAS spectra of o-ErMO/LAO lies at a lower energy than for polarizations
E//a and E//c. The diverseness in spectra for these polarizations shows a great anisotropy in
Mn 3d-O-2p hybridization, which is consistent with the results of O K-edge absorption
spectra in Fig. 4.10.
PO2=6×10⁻² torr
Fig. 4.12 XRD patterns of o-ErMO/STO(001) deposited at different substrate temperatures In addition to depositing on LAO (110) substrates, we have also tried to grow o-ErMO
o-ErMO (00l ) increases with increasing substrate temperature, we chose 880℃ and 6×10⁻² torr as the optimal deposition conditions (Fig. 4.12). The XRD data evidently confirmed the
formation of pure o-ErMO with c-axis oriented normal to the film surface; nevertheless, a and
b lattice constants are so similar that they randomly grown on the diagonal lines of STO (001).
As sown in Fig. 4.13, the phi scan displayed two pairs of twofold symmetry attributed the
in-plane a- and b-axis mixing mosaic alignment with substrate while keep the c-axis
orientation intact. This is, presumably, due to the similarity between the a- and b-axis lattice
constants. The circular grains of o-ErMO/STO(001) displayed in the AFM image (Fig. 4.15),
indeed, are not as anisotropic as those seen in o-ErMO/LAO(110) films.
Fig. 4.13 The φ-scans of the o-ErMO/STO(001) thin film deposited at PO2=6×10⁻² torr and Ts=880℃
-50 0 50 100 150 200 250 300 350 400
phi scan of SrTiO3(111)
phi scan of o-ErMnO3(202)
In te n s it y ( a rb . u n it ) (degree)
Fig. 4.14 In-plan arrangements between the o-ErMO thin films and STO(001) substrate
Ra=0.833 nm
Rq=1.066 nm
Fig. 4.15 The AFM image of o-ErMO/STO(001) thin film deposited at PO2=6×10⁻² torr and Ts=880℃.
0 25 50 75 0.5 1.0 1.5 2.0 2.5 3.0 H//a H//b H//c H=100 Oe ( 1 0 -2 -e m u -c m -3 -O e -1 ) T(K) 18K 42K 3.5K
4.2.2 The magnetic properties
Fig. 4.16 shows the temperature dependent magnetization M(T) of o-ErMO/LAO(110)
measured by the zero-field-cooled (ZFC) scheme with an external field 100 Oe (H=100 Oe)
applied along three respective crystal orientations. As shown in figure, all ZFC M(T) curves
of o-ErMO display an antiferromagnetic transition of Mn moment near 42K, which is
consistent with previous results [11,18]. Another transition in magnetic ordering from Er3+ is clearly seen around 3.5K, in which antiferromagnetic ordering measured with H//c-axis is
different from ferromagnetic ordering with H//b-axis. Last of all, both the ZFC M(T) probed
with H//c-axis and the inverse susceptibility χ-1(T) probed with H//a-axis and H//b-axis (Fig.
4.17) display a transition near 18K, presumably due to spin reorientation (TSR) of Mn
moment.
Deposited at PO2=6×10⁻² torr
Fig. 4.16 The temperature dependent magnetization of o-ErMO/LAO(110) with external field applied along respective crystal orientation
0 25 50 75 100 1 25 150 0.0 0.5 1.0 1.5 2.0 2.5 3.0 3.5 4.0 4.5 5.0 5.5 H//a (FC ) H//a (ZFC) H//b (FC ) H//b (ZFC) H//c (FC) H//c (ZFC ) H=100 Oe (1 0 -2 -e m u -c m -3 -Oe -1 ) T(K)
Fig. 4.17 The inverse susceptibilityχ-1(T) probed for H//a-axis and H//b-axis display a
transition near 18K
However, as shown in Fig. 4.18, ZFC M(T) of o-ErMO/STO(001) probed with H=100
Oe applied parallel and perpendicular to plane exhibited somewhat different from that of
o-ErMO/LAO(110). When the field was applied along the c-axis of o-ErMO/STO(001), the
anomalies in M(T) were observed at 44, 28 and 3.5K, probably attributed to antiferromagnetic
transition and TSR of Mn moments and Er3+ ordering, respectively. In comparison, when the
field was applied along the ab-plane of o-ErMO/STO(001), there is no transition could be
unambiguous identified. 0 1 0 20 3 0 4 0 5 0 4 0 6 0 8 0 10 0 12 0 -1 (e m u -1 -c m 3 -O e ) T (K ) H //a H = 1 0 0 O e 1 8 K 4 1 .8 K 3 .6 K 0 10 20 30 40 50 20 40 60 80 100 120 140 160 180 200 220 240 -1 (e m u -1 -c m 3 -O e ) T(K) H//b H=100Oe 16K 42K 3.5k
0
10
20
30
40
50
60
1
2
3
4
5
H//c ZFC
H//ab-plane ZFC
H=100 Oe
(1
0
-2-e
m
u
-c
m
3-O
e
-1)
Temperature(K)
28K 44K 0 50 100 150 200 250 300 0 2 4 6 H//c (FC) H//c (ZFC) H//ab-plane (FC) H//ab-plane (ZFC) H=100 Oe (e m u -c m 3 -O e -1 ) Temperature(K) Deposited at PO2=6×10⁻² torrFig. 4.18 The temperature dependent magnetization of o-ErMO/STO(001) with the external field applied parallel and perpendicular to film plane
0 10 20 30 40 50 0.2 0.4 0.6 0.8 -1 (1 0 2 -e m u -1 -c m 3 -O e ) Temperature (K) H//ab-plane H=100 Oe 28K
Fig. 4.19 The inverse susceptibilityχ-1(T) probed for H//ab-plane display two transition near
45K and 28K Spin reorientation of Mn moment
Three distinctive magnetic transitions were observed for o-ErMO films grown on both
LAO and STO substrates (Fig. 4.18). The first one locating around 42K is apparently
associated to the antiferromagnetic ordering of Mn moment and, thus, it is assigned as the
Neel temperature (TN). The second transition was observed near 18K for o-ErMO/LAO(110),
which is markedly different from the transition at 28K for o-ErMO/STO(001). The last
transition was dominated by the moments from erbium ions at lower temperatures. The two
AFM transitions of Mn3+ and Er3+ moments appear to be rather insensitive to the substrates on which the films were grown. However, there is a 10-Kelvin difference in the spin
reorientation transition identified for the Mn-moment when different substrates were used.
In order to understand this intriguing observation, we first ask what the possible origin
of the TSR is. The lock-in transition could be one source of TSR. The wave vector (0, kb, 0) of
the AFM ordering of the Mn moment is with kb≈0.415 for temperature immediately below TN.
Kb gradually increasing with decreasing temperature and locks into a temperature independent
constant 0.433 at 28K, which was called the lock-in temperature (TL) [18]. The 28-Kelvin
transition was also seen in temperature dependent dielectric constant ε(T) and specific heat
Cp(T) [11]. However, since lock-in transition was primarily involved with the periodicity of
magnetic ordering and that of underlying lattice, thus it seldom displays a marked
manifestation in M(T) measurements previously. The recent investigations performed on
strain-stabilized films, on the other hand, not only have clearly revealed the lock-in transition
in the M(T) measurement but also have implied the prominent also played by the strain in the
magnetic behavior and associated ferroelectricity [7, 8, 37, 38]. The influence of strain on
Mn-O-Mn bonds presumably is the primary reason in modifying the magnetic properties.
With this in mind, we tried to compare the M(T) curves for films grown on these two
different substrates. The M(T) of o-ErMO/LAO(110) shows a marked hysteresis in ZFC-FC
data as compared with that of o-ErMO/STO(001). One of the possible origins of this
irreversibility might have resulted from the spin-glass behavior. It could be also due to
magnetic canting and uncompensated spins of structural origin. Although the susceptibility
comparison is, nevertheless, indicating that the spins in o-ErMO/LAO(110) are more disorder
than that in o-ErMO/STO(001).
Finally, we notice that since for o-ErMO/STO(001) the a- and b-axis of the film
crystalline orientation is mixed in-plane, the resultant M(T) when measured with field applied
in plane is indeed displaying characteristics consistent with that reported for o-ErMO powder.
The fact that no TSR was seen in polycrystals and powders of o-RMnO3 (R=Y,Ho-Lu) and
even TN only could be seen in the compounds (YMnO, LuMnO) where the rare earth does not
contribute any magnetic moment [3, 18, 38, 39]. It indicates that although the transition of Mn
moments in M(T) is easily overwhelmed by the paramagnetic signal of the rare earth moments.
As a result, it can not be revealed easily in M(T). The present results, however, suggest that
epitaxial might be helpful to display the transition of Mn moments.
The magnetic ordering for the Er3+ moments
After discussing the magnetic properties of TSR, we also want to comprehend the
feature of Er3+. As shown in Fig. 4.16 and Fig. 4.18, the ordering of Er3+ moments is clearly seen around 3.5K, in which antiferromagnetic ordering measured with H//c-axis is different
from ferromagnetic ordering with H//b-axis. It seems reasonable to conjecture that the spins
of Er3+ were antiferromagnetic arrangement along c axis and leaned toward b-axis. Although not perceived in the M(T) of o-ErMO due to mixture of data with three distinct crystal

![Table 1.1 Classification of ferroelectrics [5]](https://thumb-ap.123doks.com/thumbv2/9libinfo/8549070.188041/14.892.145.799.187.755/table-classification-of-ferroelectrics.webp)
![Fig. 2.5 Energy splittings of the Mn 3d orbitals due to Jahn-Teller effect [25]](https://thumb-ap.123doks.com/thumbv2/9libinfo/8549070.188041/24.892.121.733.450.904/fig-energy-splittings-mn-orbitals-jahn-teller-effect.webp)
![Fig. 2.7 The phase diagram of orthorhombic RMnO 3 [11]](https://thumb-ap.123doks.com/thumbv2/9libinfo/8549070.188041/26.892.323.659.524.828/fig-phase-diagram-orthorhombic-rmno.webp)
![Fig. 2.8 A-type magnetic structure [17,26] the arrows indicate the spins of Mn 3+](https://thumb-ap.123doks.com/thumbv2/9libinfo/8549070.188041/27.892.147.657.513.871/fig-type-magnetic-structure-arrows-indicate-spins-mn.webp)
![Fig. 2.10 The E-type magnetic structure [17, 26] the arrows indicate the spins of Mn 3+](https://thumb-ap.123doks.com/thumbv2/9libinfo/8549070.188041/28.892.137.738.504.882/fig-type-magnetic-structure-arrows-indicate-spins-mn.webp)
