Induced γ f R Crystal Transformation in Blends of Polyamide 6 and
Liquid Crystalline Copolyester
Jia-Chong Ho and Kung-Hwa Wei*
Department of Materials Science and Engineering, National Chiao Tung University, Hsinchu, Taiwan 30049, ROC
Received October 12, 1999; Revised Manuscript Received April 13, 2000
ABSTRACT: The equilibrium melting temperatures and the induced γ f R crystal transformation in blends of random liquid crystalline copoly(oxybenzoate-ethylene terephthalate) at molar ratio 60/40 (P64) and polyamide 6 (PA6) under different thermal treatments were investigated with differential scanning calorimetry and wide-angle X-ray diffraction, respectively. It was found that the equilibrium melting temperatures of P64/PA6 blends depended strongly on the amount of P64, and the presence of a small amount of P64 in PA6, around 5%, induced additional crystallization of the R-form crystal in the quenched PA6. Moreover, the onset temperature for the γ f R crystal transformation in the 5/95 P64/PA6 blend was reduced by 30 °C as compared to that in the pure PA6 case (160 °C vs 130 °C).
Introduction
Thermotropic liquid crystalline polymers (TLCPs) usually contained rigid-rod chemical structures and therefore possessed unique properties such as low melt viscosity and high modulus in the oriented direction in the solid form. Blending TLCPs with amorphous or crystalline polymer to form in-situ organic polymer composites appeared to be very attractive because of advantages in lowering the viscosity of amorphous or crystalline polymer during processing and in reinforcing the final mechanical properties of the matrix polymer.1-4 However, liquid crystalline polymer chains are very stiff; the enthalpy of mixing a rigid-rod polymer with a flexible-chain polymer was mostly positive, and the entropy gained in the mixing was too small to compen-sate for the enthalpy. This generally led to phase-separated systems. Consequently, miscibility in liquid crystalline/amorphous or liquid crystalline/crystalline polymer blends was rarely found. To our knowledge, there were only four cases reported. They are blends of copoly(oxybenzoate-ethylene terephthalate) (POB-PET)/polycarbonate (PC),5-9 POB-PET/poly(butylene terephthalate) (PBT),10POB-PET/poly(hexamethylene terephthalate) (PHMT),11and POB- PET/poly(ethylene terephthalate) (PET).12,13 Miscibility in the cases of POB-PET /PC, POB-PET/PBT, and POB-PET/PHMT was found to increase with the extent of transesterifi-cation between POB-PET and PC, PBT, or PHMT.
Polyamide is a versatile polymer and is mainly used in carpets and garments. The glass transition temper-ature (Tg), the crystallization temperature (Tc), and the melting temperature (Tm) of polyamide 6 (PA6) are 50, 70, and 220 °C, respectively. Polyamide 6 exhibited polymorphism structures that contained two types of stable crystal form: monoclinic R-form and monoclinic (or pseudohexagonal) γ-form,14-17which are very sensi-tive to the way of preparing samples. Previous studies have also shown that a partially disordered structure of PA6, mesomorphic β-form, could be obtained by cooling the samples rapidly from the melt state,18while
the R-form crystal of PA6 was resulted from slow cooling from the melt state.19The γ-form crystal of PA6 can be transformed into the R-form crystal by annealing PA620 or by drawing and then by annealing PA621 or by treating PA6 with a phenol aqueous solution.22 Con-versely, the R-form of PA6 can be transformed to the γ-form by treating PA6 with iodine.16,23
The polymorphic structures of polyamide resulted from the different spatial arrangement in the hydrogen bonding between the oxygen in the carbonyl group of one polyamide molecular chain and the hydrogen at-tached to the nitrogen in the neighboring polyamide molecular chain. The γ-form polyamide crystal was constituted by polyamide molecules adopting the paral-lel-chain-arrangement hydrogen bondings, whereas the polyamide molecules in the monoclinic R-form crystal have taken the more stable antiparallel-chain-arrange-ment hydrogen bondings. The R-form is more stable than the γ-form because of shorter hydrogen bondings. The third form, mesomorphic β-form, although unstable, also existed. The formation of a stable crystal form by polyamide molecules was determined by the flexibility of their molecular chains. For containing even numbers of methylene group in the repeating unit of polyamide, polyamide 2n, the packing interaction between the methylene groups in polyamide 2n determined their crystal structures. For 2n e 6, the R-form crystal of polyamide 2n is more stable, while for 2n g 6, the γ-form crystal of polyamide 2n is more stable.24In practice, PA6 can exhibit either the R-form crystal under slow cool-ing19or the mesomorphic β-form under quenching from the melt state18as a result of the large difference in the crystallization time in achieving the crystal form. Copoly(oxybenzoate-ethylene) at molar ratio 60/40 (P64) is a random liquid crystalline polymer having Tg, Tc, and Tmat 61, 110, and 194 °C, respectively. The crystallinity of P64 was very small if any present.25In this study, we would like to investigate the equilibrium melting points of binary blend of semiflexible P64 and semicrystalline PA6 and the induced crystal transfor-mation of PA6 with differential scanning calorimetry and with wide-angle X-ray diffraction, respectively.
* To whom correspondence should be addressed: Tel 886-3-5731871; FAX 886-3-5724727.
10.1021/ma991702f CCC: $19.00 © 2000 American Chemical Society Published on Web 06/22/2000
Experimental Section
The liquid crystalline copolyester of POB-PET at mole ratio 60/40 (P64) was obtained from Unitika Ltd, Japan. Polyamide 6 (PA6), trade name of Zytel, was purchased from DuPont. The solution blending of P64 and PA6 was carried out by completely dissolving the two polymers in 50 mL of o-chlorophenol at 60 °C to form a ca. 2 wt % solution. Different weight fractions of P64/PA6 were prepared, and they are 2/98, 5/95, 10/90, 20/80, 30/70, 40/60, 50/50, 60/40, 70/30, and 80/ 20. The polymer solutions were then cast onto glass slides and were dried under vacuum at 100 °C for 72 h in an oven for removing the solvent. The thermal gravimetric analysis of the dried blends showed no appreciable weight loss up to 350 °C, indicating a complete removal of the solvent. In the equilib-rium melting temperature measurement, the samples were heated from 25 to 270 °C at a heating rate of 40 °C /min under nitrogen in a DuPont 2910 DSC. Subsequently, the samples were quenched to 100, 105, 110, 115, 120, 125, 130, 140, 150, and 160 °C and were maintained at these crystallization temperatures for 5 min. Then, the samples were directly heated to 270 °C at a rate of 20 °C /min. The peak temperature of the melting endothermic peak was taken as the melting temperature. To determine whether there was ester-amide exchange between P64 and PA6 in heat treatments during the equilibrium melting point measurements and in the wide-angle X-ray diffraction samples, a 13C nuclear magnetic resonance (NMR) analysis was carried out on the blends annealed at 270 °C for 0, 10, and 30 min. The NMR instrument used was a Bruker DMX-600 (600 MHz) spectrometer. In the samples preparation, both the freshly prepared and the annealed 50/50 P64/PA6 were dissolved in mixed solvent of phenol/deuterated chloroform (80/20 by volume), and tetra-methylsilane as the standard was used in the 13C NMR analyses. For the wide-angle X-ray diffraction analysis, the specimens were heated from room temperature to 270 °C and were maintained at 270 °C for 1 min for wiping out the previous thermal history of these samples. Then, the speci-mens were quenched in liquid nitrogen and were subsequently put at room temperature for 1 day. Afterward, the samples were allowed to crystallize at different temperatures for 5 min, and the samples were quenched in liquid nitrogen again and were then equilibrated at room temperature. Wide-angle X-ray diffraction of these samples was performed with a MAC Science MXT-3 X-ray diffractometer using Cu KR radiation with a voltage 50 kV and a current of 250 mA. The diffraction patterns were recorded with a step size of 0.02° from 2θ ) 5 to 35°.
Results and Discussion
In this study, the possibility of ester-amide exchange between P64 and PA6 during the samples’ annealing at high temperatures must be examined to clarify that the effect of P64 on the crystal form transformation of PA6 was purely a physical one. The partial13C NMR spectra of the 50/50 P64/PA6 blends which were freshly prepared, annealed at 270 °C for 10 min, and annealed at 270 °C for 30 min are shown in Figure 1,a, b, and c, respectively. In Figure 1a, the Ca peak at 175.6 ppm represented the amide group in PA6, and the Cbpeak at 166.8 ppm and the Cc peak at 165.0 ppm were contributed by the carbonyl group in PET and POB, respectively. In Figure 1b, the13C NMR spectrum of the 50/50 P64/PA6 blend annealed at 270 °C for 10 min is exactly the same as that of the freshly prepared 50/50 P64/PA6 blend. The partial13C NMR spectrum of the 50/50 P64/PA6 blend annealed at 270 °C for 30 min displayed a new peak, Cη, which was caused by the new
resultant peaks of dyads terephthalate-amide or oxy-benzoate-amide as shown in Figure 1c. These results were obtained from a highly sensitive 600 MHz NMR spectrometer. The samples for either the equilibrium
melting point measurement or the wide-angle X-ray diffraction analysis were subject to much less severe thermal conditions (270 °C for 1 min and below 205 °C for 5 min) than that of treating the samples at 270 °C for 10 min. Hence, it can be concluded that ester-amide exchange between P64 and PA6 did not occur in the samples in this study.
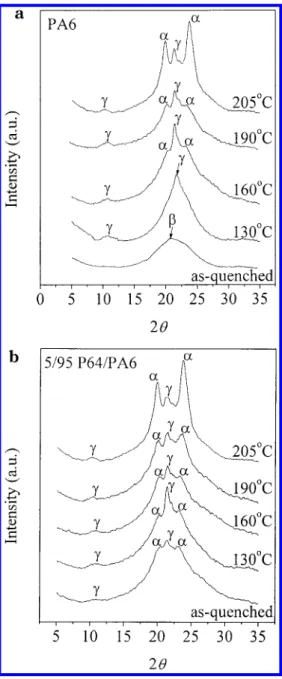
The initial state of the PA6 samples prepared by quenching was mostly the mesomorphic β-form, and the β-form can be transformed into the more stable crystal forms under annealing as evidenced by the X-ray diffraction curves of PA6 in Figure 2a. In Figure 2a, the broad diffraction peak at 2θ ) 22.2° represented the mesomorphic β-form in the quenched PA6. When the quenched PA6 was annealed at 130 °C for 5 min, a strong diffraction peak at 2θ ) 21.8° contributed by the γ-form crystal of PA6 appeared. Four additional diffrac-tion peaks appeared in the X-ray diffracdiffrac-tion curve of PA6 after the quenched PA6 being annealed at 160 °C for 5 min; two medium diffraction peaks at 2θ ) 20.4° and at 2θ ) 23.7°, a weak peak at 2θ ) 11.0°, and a strong peak at 2θ ) 21.8°. These two medium peaks were a distinctive feature of the R-form crystal of PA6, and both the weak and the strong peaks were caused by the γ-form crystal of PA6. After being annealed at 190 °C, the peaks by R-form crystal in PA6 grew larger, but the peak by γ-form remained the strongest one. The most prominent peak in the X-ray diffraction curves of PA6 was caused by the R-form crystal as the annealing temperature of PA6 increased to 205 °C. In a sharp contrast to the quenched PA6 case, the quenched 5/95 P64/PA6 blend consisted of both the γ-form and the R-form crystal as demonstrated in the X-ray diffraction curves in Figure 2b. The diffraction peak of P64, usually Figure 1. Partial13C NMR spectra of 50/50 P64/PA6 blends: (a) freshly prepared, (b) annealed at 270 °C for 10 min, and (c) annealed at 270 °C for 30 min.
at 2θ ) 18.5°, did not appear in the X-ray diffraction curve of the 5/95 P64/PA6 blend because of its low content in the blend. In Figure 2b, when the 5/95 P64/ PA6 blend was annealed at 130 °C, the diffraction peak by the γ-form become stronger due to the newly crystal-lized γ-form PA6. Annealing the 5/95 P64/PA6 blend at 160 °C, the R-form diffraction peaks became much larger. At 190 °C, the area under the double peaks displayed by the R-form was larger than that under the γ-form crystal peak. The R-form crystal became the dominant crystal form in the blend at 205 °C. By comparing the X-ray diffraction results of the pure PA6 and the 5/95 P64/PA6 blend, we obtained two conclu-sions. First, the γ-form crystal was the dominant crystal for the quenched PA6 being annealed below 130 °C, and the R-form crystal was the dominant crystal for the quenched PA6 being annealed above 205 °C, for short times. In the case of the 5/95 P64/PA6 blend, the R-form crystal was the major component in the blend when the blend was annealed at above 190 °C for short times. These results were essential in understanding the
melting behaviors of pure PA6 and the 5/95 P64/PA6 blend.
The equilibrium melting point in a semicrystalline polymer can be predicted by the Hoffman-Weeks equa-tion derived from the equilibrium thermodynamics,26,27 which is given in the following.28
where Tm′and Tm° are the measured melting temper-ature and the equilibrium melting tempertemper-ature, respec-tively, Tcis the crystallization temperature, and γ is the proportional factor between the initial lamellar thick-ness, l*, and the final lamellar thickthick-ness, l.
Figure 2. X-ray diffraction patterns of polymers annealed at
different crystallization temperatures for 5 min: (a) pure PA6 case; (b) 5/95 P64/PA6 blend case.
Figure 3. Hoffman-Weeks plots for (a) P64/PA6 blends with
P64 as the minor component and (b) P64/PA6 blends with P64 as the major component.
Tm′)Tc γ +
(
1-1
γ
)
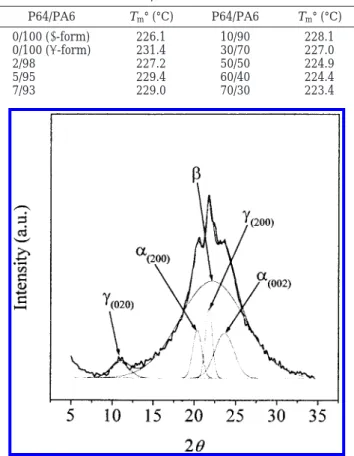
Tm° (1)γ is generally related to the crystallization temperature, the time, and the heating conditions up to the melting temperature. At γ ) ∞, Tm′is equal to Tm°, and the crystal is the most stable one. At γ ) 1, Tm′is equal to Tc, and the crystal is an inherently unstable one. Tm° is determined by the intersection point between the Tm′ ) Tcline and the Tm′vs Tcline. The Hoffman-Weeks plots of PA6 and P64/PA6 blends are shown in Figure 3a,b. In Figure 3a, the two dashed lines were constituted by the melting points of PA6 annealed at temperatures below 130 °C and above 205 °C. Two equilibrium melting points, 226.1 and 231.4 °C, were obtained by intersecting the two dashed lines with the Tm′) Tcline, and the high equilibrium melting point, 231.4 °C, is due to the R-form crystal of PA6, denoted as TmR°, and the low equilibrium melting point, 226.1 °C, is caused by the γ-form crystal of PA6, denoted as Tmγ°. Also in Figure 3a, the equilibrium melting points of P64/PA6 blends with P64 as the minor component were between Tmγ° and TmR° when they were annealed below 160 °C. The equilibrium melting points of P64/PA6 blends reach their maximum value when 5% P64 was present in the blend. However, the elevation of the equilibrium melting point due to the γ f R crystal transformation in P64/ PA6 blends decreased when the amount of P64 is more than 5%. As the amount of P64 is equal to or larger than that of PA6, the equilibrium melting points of the P64/ PA6 blends were always lower than Tmγ°, as shown in Figure 3b. This implied that the induced γ f R crystal transformation effect is compensated by the melting point depression of PA6 due to the presence of P64. In other words, there were two independent factors against each other in determining the equilibrium melting point of P64/PA6 blends. The first factor is the elevation in the equilibrium melting points of P64/PA6 blends
because of the γ f R crystal transformation, and the second factor is the melting point depression in P64/ PA6 blends. The melting point depression in the P64/ PA6 blends implied some miscibility existed between P64 and PA6. The complete equilibrium melting points of P64/PA6 blends are given in Table 1.
The extent of the effect of P64 on the γ f R crystal transformation of PA6 can be analyzed. The X-ray diffraction curve of polyamide 6 can be deconvoluted into five components by approximating peaks with Gaussian curves following the work by Gurato et al.20The five components consisted of (020)γ, (200)γ, (200)R, and (002)R
diffraction peaks appearing at 2θ ) 11.0°, 21.9°, 20.4°, and 24.0°, respectively, and a broad peak due to the mesomorphic β-form as shown in Figure 4. The crystal-linity indices, CI (%), were defined in the following.
where AR-form crystaland Aγ-form crystalare the area under
the R-form crystal peaks and the γ-form crystal peaks, respectively. Aβ-formis the area under the mesomorphic
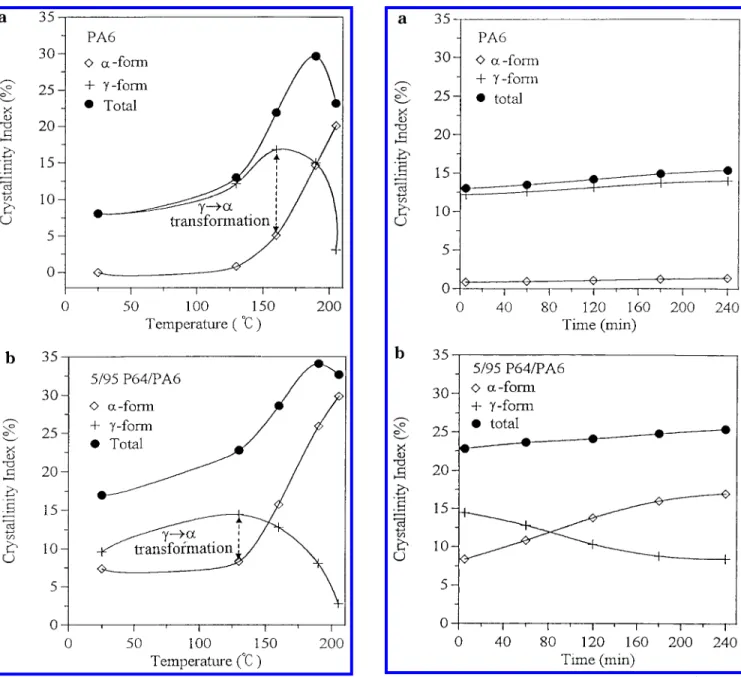
β-form peak. The CIR, CIγ, and CItotalin pure PA6 and in the 5/95 P64/PA6 blend annealed at different tem-peratures are presented in Figure 5. In Figure 5a, the CIRis close to none, and the CIγor the CItotalis 8.1% in the quenched PA6. The CIR, CIγ, and CItotal in PA6 increased slightly after being annealed at 130 °C. Fairly large increases in the CIRand in the CIγ of PA6 were
found by annealing PA6 at 160 °C. The existence of the maximum of CIγindicated that the onset of the γ f R
crystal transformation of PA6 occurred at 160 °C. The CIγdecreased sharply due to a large-scale γ f R crystal
transformation when the PA6 was annealed at 205 °C for 5 min. In Figure 5b, the CIR, CIγ, and CItotalin the quenched 5/95 P64/PA6 blend were 7.4%, 9.6%, and 17.0%, respectively, and the CItotalwas much larger than that in the pure PA6 case. The CIR in 5/95 P64/PA6 blend increased with the annealing temperature follow-ing the same pattern of the CIRin the case of pure PA6. The onset of the γ f R crystal transformations of the 5/95 P64/PA6 blend took place at 130 °C as manifested by the location of the maximum value of CIγ. From these
results, three conclusions can be drawn. First, the presence of a small amount of P64 in PA6, around 5%, induced additional crystallization of the R-form crystal in the quenched PA6. Second, the newly formed crystals in PA6 and in the 5/95 P64/PA6 blend possessed mostly the γ-form crystal when they were annealed at 130 °C for 5 min. Third, the onset temperature of the γ f R form transformation in the 5/95 P64/PA6 blend was 30 °C lower than that of the γ f R form transformation in the pure PA6 case, i.e., 160 °C vs 130 °C.
Table 1. Equilibrium Melting Temperatures of PA6 and P64/PA6 Blends P64/PA6 Tm° (°C) P64/PA6 Tm° (°C) 0/100 (γ-form) 226.1 10/90 228.1 0/100 (R-form) 231.4 30/70 227.0 2/98 227.2 50/50 224.9 5/95 229.4 60/40 224.4 7/93 229.0 70/30 223.4
Figure 4. Deconvolution curves of the X-ray diffraction curve
of PA6 annealed at 190 °C for 5 min.
CIR(%) )
∑
AR-form crystl∑
(AR-form crystl+ Aγ-form crystal) + Aβ-form× 100% CIγ(%) )∑
Aγ-form crystl∑
(AR-form crystl+ Aγ-form crystal) + Aβ-form× 100% CItotal(%) )∑
(AR-form crystl+ Aγ-form crystal)∑
(AR-form crystl+ Aγ-form crystal) + Aβ-form× 100% (3)The evolution of the γ f R crystal transformation in pure PA6 and in the 5/95 P64/PA6 blend annealed at 130 °C was also studied by the same peak deconvolution analysis, and the crystallinity indices are shown in parts a and b of Figure 6, respectively. In Figure 6a, the CItotal of pure PA6 annealed at 130 °C for 240 min increased only slightly form 13% to 15.4%, and the CIRwas about the same, around 1%, indicating the stability of the pure PA6 γ-form crystal at this temperature. In Figure 6b, the CItotalof the 5/95 P64/PA6 blend annealed at 130 °C for 240 min increased modestly form 22.8% to 25.4%. However, the CIRin the 5/95 P64/PA6 blend increased dramatically from 8.3% to 17.0%, while the CIγ
de-creased from 14.5% to 8.5%. The large difference in the two cases reconfirmed that the presence of P64 could strongly facilitate the γ f R crystal transformation in PA6 even at 130 °C, providing enough time was given.
Conclusions
The equilibrium melting temperatures of P64/PA6 blends strongly depend on the amount of P64. The
presence of a small amount of P64 in PA6, around 5%, induced additional crystallization of the R-form crystal in the quenched PA6 and resulted in melting point elevation of PA6. The onset temperature for the γ f R crystal transformation in the 5/95 P64/PA6 blend was reduced by 30 °C as compared to that in the pure PA6 case (160 °C vs 130 °C).
Acknowledgment. The authors appreciated the
financial support provided by the National Science Council through Project NSC88-2216-E-009-008.
References and Notes
(1) Kiss, G. Polym. Eng. Sci. 1987, 27, 410.
(2) Kolhi, A.; Chung, N.; Weiss, R. A. Polym. Eng. Sci. 1989, 29, 573.
(3) Brostow, W. Polymer 1990, 31, 979.
(4) Wei, K. H.; Kiss, G. Polym. Eng. Sci. 1996, 36, 713. (5) Wei, K. H.; Hwang, W. J.; Tyan, H. L. Polymer 1996, 37, 2087. (6) Wei, K. H.; Jang, H. C.; Ho, J. C. Polymer 1997, 38, 3521. (7) Wei, K. H.; Ho, J. C. Macromolecules 1997, 30, 1587. (8) Wei, K. H.; Tyan, H. L. Polymer 1998, 39, 2013. (9) Su, K. F.; Wei, K. H. J. Appl. Polym. Sci. 1995, 56, 79. Figure 5. Crystallinity indices of the R crystal, the γ crystal,
and the total crystal in polymers annealed at various temper-atures: (a) pure PA6 case; (b) 5/95 P64/PA6 blend case.
Figure 6. Crystallinity indices of the R crystal, the γ crystal,
and the total crystal in polymers annealed at 130 °C for different time: (a) pure PA6 case; (b) 5/95 P64/PA6 blend case.
(10) Kimura, M.; Porter, R. S. J. Polym. Sci., Polym. Phys. Ed.
1983, 21, 367.
(11) Laivins, G. V. Macromolecules 1989, 29, 3974.
(12) Nakai, A.; Shiwaku, T.; Wang, W.; Hasegawa, H.; Hashimoto, T. Macromolecules 1996, 29, 2259.
(13) Nakai, A.; Wang, W.; Ogasawa, S.; Hasegawa, H.; Hashimoto, T. Macromolecules 1998, 31, 5391.
(14) Holmes, D. R.; Bunn, C. W.; Smith, D. J. J. Polym. Sci. 1955,
17, 159.
(15) Donald, C.; Vogelsong, D. C. J. Polym. Sci., Part A 1963, 1, 1055.
(16) Arimoto, H. J. Polym. Sci., Part A 1964, 2, 2283.
(17) Arimoto, H.; Ishibashi, M.; Hirai, M. J. Polym. Sci., Part A
1965, 3, 317.
(18) Ziabicki, A. Kolloid-Z. 1959, 167, 132.
(19) Murthy, N. S.; Curran, S. A.; Aharoni, S. M.; Minor, H.
Macromolecules 1991, 24, 3215.
(20) Gurato, G.; Fichera, A.; Grandi, F. Z.; Zanetti, R.; Canal, P.
Makromol. Chem. 1974, 175, 953.
(21) Arimoto, H. Kobunshi Kagaku 1962, 19, 212. (22) Kinoshita, Y. Makromol. Chem. 1959, 33, 1.
(23) Ito, M.; Mizuochi, K.; Kanamoto, T. Polymer 1998, 39, 4593. (24) Dasgupta, S.; Hammond, W. B.; Goddard, W. A. III. J. Am.
Chem. Soc. 1996, 118, 12291.
(25) Jackson, W. J., Jr.; Kuhfuss, H. J. J. Polym. Sci., Polym.
Chem. Ed. 1976, 14, 2043.
(26) Kimura, M.; Porter, R. S. J. Polym. Sci., Polym. Phys. Ed.
1983, 21, 367.
(27) Xing, P.; Ai, X.; Dong, L.; Feng, Z. Macromolecules 1998, 31, 6898.
(28) Hoffman, J. D.; Weeks, J. J. J. Res. Natl. Bur. Stand. 1962,
66, 13.
MA991702F