Impact of NAFTA on U.S. Corn Trade with Mexico
A. A. Farhad Chowdhury*Department of Business, Mississippi Valley State University, U.S.A. Albert J. Allen
Department of Agricultural Economics, Mississippi State University, U.S.A.
Abstract
The objective of this paper is to assess the impact of NAFTA vis-à-vis other domestic and environmental forces in corn trading between the U.S. and Mexico. Regression analysis could not provide conclusive evidence that the post-NAFTA increase in corn trade was solely due to NAFTA. Severe drought in Mexico and its domestic policy reforms may have contributed to the increased volume of corn trade in the post-NAFTA era.
Key words: NAFTA; tariff barriers; tariff-rate quota; labor-output coefficients JEL classification: F13
1. Introduction
In an effort to create a free-trade zone among the North American countries, trade negotiations which began in 1991 among the U.S., Canada, and Mexico, known as the North American Free Trade Agreement (NAFTA), were implemented on January 1, 1994. The agreement wiped out tariff barriers (import duties, taxes on imported goods), non-tariff barriers (import quotas, licensing schemes), and technical barriers to trade completely or phased them out over a 5- to 15-year period (Rosson et al., 1999, p. 1). For Canada, NAFTA was a mere extension of the U.S.-Canada Free Trade Agreement (CFTA) of January 1, 1989, to which new trade agreements with Mexico were added.
Time series data for the period 1994–2001 (Figure 1) indicates that corn traded between the U.S. and Mexico and between the U.S. and Canada has increased substantially since the implementation of the NAFTA agreement. While NAFTA provided for an immediate elimination of all tariffs on corn trade with Canada, it eliminated tariffs more slowly with Mexico. The agreement converted Mexico’s ongoing tariff system into a tariff-rate quota system to be phased out over 15 years. Although it allowed a tariff free quota of 2.5 million metric tons of corn with an
Received August 26, 2003, revised January 28, 2005, accepted March 11, 2005.
*Correspondence to: Department of Business, Mississippi Valley State University, 14000 Highway 82
increase of 3 percent per annum to enter Mexico, the quota was exceeded by 3.0 million tons in 1996 due to a shortage in crop production caused by drought. In fact, no tariff has been imposed since 1994 (when the quota exceeded the free quota) because of the impact it may have had on tortilla prices (Nadal, 2000a, pp. 1-2).
Figure 1
Unlike Canada, Mexico’s inclusion of corn in NAFTA had an important bearing from the country’s social and economic perspectives. Mexico has always been strongly tied to corn. Not only can corn be considered the most important crop in Mexico, but it also generates Mexico’s most important staple food, and is the most important commodity in terms of employment generation. It provides
U.S. Corn Export to Mexico and Canada: 1985 - 2001
0 1 2 3 4 5 6 7 1985 1987 1989 1991 199Year3 1995 1997 1999 2001 M T (I n M ill ions) Export to Mexico (In Million MT) Export to Canada (In Million MT)
U.S. Corn Import from Mexico and Canada: 1985 - 2001
0 0.05 0.1 0.15 0.2 0.25 0.3 0.35 0.4 1985 1987 1989 1991 1993 1995 1997 1999 2001 Year MT ( In Mil li ons ) Import from Mexico (In Million MT) Import from Canada (In Million MT)
employment to over 3 million producers, constituting 8 percent of Mexicans and 40 percent of the total population working in the agricultural sector. Mexican corn has also been crucial to the development of a short growth cycle, drought resistance, yield increments, plague resistance, and increases in the protein content of grain for corn grown in tropical areas (Nadal, 2000b, pp. 1-2).
However, corn in Mexico showed enormous disparity in terms of labor/output coefficients and yields (Figure 2) with corn production in the U.S. and Canada. Corn can be produced in the U.S. at about 40% of the cost of production in Mexico, and average yield varies from 1.8 tons per hectare in Mexico to 8 tons per hectare in the U.S. (Raghavan, 2000, p. 3).
Figure 2
Despite a strong link between Mexico and corn, NAFTA negotiators included corn, deciding that doing so would allow the country to focus more on labor-intensive crops and free fiscal resource used in subsidizing inefficient corn producers. NAFTA negotiators also believed that including corn would enable the Mexican economy to maintain low wages, help control inflation, and increase its capacity for capital accumulation. However, some experts think that this approach is shortsighted, especially considering the fact that the impoverishment of farmers acts as an obstacle to growth as the economy can not provide higher paying jobs to corn producing farmers who migrate away from rural areas to urban areas. In actuality, the decision to open Mexican corn to U.S. imports has mostly benefited a group of
Corn Yield of USA, Canada, and Mexico
0 10,000 20,000 30,000 40,000 50,000 60,000 70,000 80,000 90,000 100,000 1984 1986 1988 1990 1992 1994 1996 1998 2000 Year
Hectogram per Hectare
USA Canada Mexico
powerful industrialists who have gained control for the country’s huge tortilla market and who were close to Mexico’s top decision makers at the time of the treaty. The U.S. is the world’s largest corn exporter. In the year 2001, its top corn export markets were Japan ($1.3 billion), Mexico ($567 million), Taiwan ($473 million), Egypt ($398 million), and Korea ($277 million). In the same year, its top importing country was Canada ($13 million), followed by Mexico ($4 million) (USDA.2002 in FAS, 2002). Most of the U.S. corn that is traded is yellow corn used for livestock feed. White corns are produced in an insignificant amount, mostly on contract basis, and are sold at a premium to yellow corn. Most of the demand for white corn comes from Mexico (Boland et al., 2000, pp. 1-5). The corn growers of Mexico are largely engaged in the production with white corn. There is a price difference between white and yellow corn, white corn being priced 25 percent higher in the international market. NAFTA, however, treats both of these varieties as the same commodity (Nadal, 2000b, p. 2).
2. Literature Review
Studies evaluating NAFTA’s impact on the trading of various agricultural products remain a relatively new area of research. Colyer (2001) examined the impact of NAFTA on all agricultural products and important commodities that are traded between U.S. and Mexico. His study failed to confirm absolutely the positive impact of NAFTA on agricultural trade between these two countries. Link and Zahniser (1999) concentrated more on general issues, including the impact of NAFTA on various agricultural commodities (beef and pork, cattle, cotton, sugar, vegetables, fruits and juices), employment, major structural changes, and efforts to resolve the conflict related to sanitary and psytosanitary (SPS) regulations. The paper provides an optimistic outlook concerning NAFTA’s effect on the overall benefit of trade expansion across the U.S., Mexico, and Canada. Rosson et al. (1999) focused on NAFTA’s impact on selected commodities (beef and cattle, poultry, wheat, rice, cotton, peanuts, fruits and vegetables, dairy products, sugar, processed food products) on trade between the U.S. and Mexico and predicted that there would be an overall trade gain but that some labor-intensive fruit and vegetable producers would be adversely affected.
3. Objectives of the Study
Although there has been a dramatic increase in corn trade between the U.S. and Mexico since 1994, assessment of NAFTA’s contribution to this growth is difficult to measure. The impact of multiple factors, such as a series of severe droughts, domestic policy reforms, and environmental forces affecting the price, demand, and supply conditions in each trading country might have affected such enormous growth (Link and Zahniser, 1999, p. 14). The objective of this study is therefore to assess the role of NAFTA vis-à-vis other domestic and environmental forces in corn trading between the U.S. and Mexico.
3.1 Method of the study General Model
International economists postulate that the composite relative price, the exchange rate, and per capita income are significant determinants of export and import trade volumes. Following the literature, the import and export demand equations take the log linear form as shown below:
log Mt = f [log(PM/PD)t, log EXRt, log Yt]
log Xt = f [log(PM/PXW)t, log EXRt, log Yt]
where M is import volume, (PM/PD) t and (PX/PXW)t are the composite relative
prices at time t with PM the import price, PD the domestic price level, PX the export price, and PXW the world export price level, EXRt is the nominal effective exchange
rate at time t, and Yt is the nominal per capita income at time t.
The expected sign of the coefficient for composite relative price is negative in both equations. The expected sign of the coefficient for the exchange rate in the import demand equation can be positive or negative depending on depreciation or appreciation of the domestic exchange rate. Similarly the coefficient for the exchange rate in the export demand equation is expected to be negative or positive depending on depreciation or appreciation of the domestic exchange rate. The sign of the coefficient for per capita income is expected to be positive in both equations. Model Specification
To accomplish the objective of this study, methods of pre- and post-NAFTA comparisons of trade volume and regression analysis similar to Colyer (2001) were followed. Colyer (2001) used the regression model with values or volumes of exports and imports of agricultural products as the dependent variable and trend, exchange rate, per capita income, and a dummy variable to represent post-NAFTA trade as explanatory variables. Further, he used the counterfactual approach to determine if the pre-NAFTA trend would have continued through the post-NAFTA period if NAFTA had not been implemented.
For this study, to determine the individual impact of NAFTA on the growth of trade volume, two sets of import and export models in complete and partial forms for the U.S. and Mexico were developed. For the complete model, the volumes of corn exports (EXP) and imports (IMP) were used as dependent variables and real exchange rate (EXR) (Mexican pesos in U.S. dollars), real per capita income (GDP), and a dummy variable representing post-NAFTA trade (NAFDM), taking the value 0 for 1986–1993 and 1 for 1994–2001, were used as explanatory variables. For the partial models, the same dependent variables were regressed on trend (TR) and the same dummy variable. Furthermore, to determine the impact of domestic policy reforms (reduction in price supports for corn, withdrawal of prohibition against feeding corn to livestock, and allowing more imports due to severe droughts),
another set of complete and partial models were developed by replacing the NAFTA dummy variable from the previous model with a policy reform dummy variable (POLDM), taking the value 0 in 1986–1994 and 1 in 1995–2001.
The objective of formulating the complete and partial models with the NAFTA dummy and the policy reform dummy as common explanatory variables in both models was to compare and confirm the intensity of the impact of NAFTA and domestic policy reform variables on corn trade volume with different degrees of freedom. The linear models for U.S. exports to and imports from Mexico are summarized below.
Partial Model (NAFTA Impact) EXP = f (TR, NAFDM) IMP = f (TR, NAFDM)
Partial Model (Policy Reform Impact) EXP = f (TR, POLDM)
IMP = f (TR, POLDM) Complete Model (NAFTA Impact)
EXP = f (NAFDM, EXR, GDP) IMP = f (NAFDM, EXR, GDP) Complete Model (Policy Reform Impact)
EXP = f (POLDM, EXR, GDP) IMP = f (POLDM, EXR, GDP) 3.2 The data
Secondary time series annual export and import data for the U.S. and Mexico covering the years 1986–2001 were electronically acquired from the Food and Agricultural Organization (FAO) and Foreign Agricultural Trade of the U.S. (FATUS) databases. Data for real per capita income and exchange rates were acquired from the World Bank database. Because quarterly data was not available, this study used 16 years of annual data beginning 1986 and ending 2001. This allowed for an equal number of years in pre-NAFTA (1986–1993) and post-NAFTA (1994–2001) periods for the study. As result of this balance in the period lengths, the possibility the bias in estimates for two periods is reduced. For example, if 1975 were chosen as the starting year instead, the pre-NAFTA period would have had 19 years, and parameter estimates would more heavily weight the pre-NAFTA period.
3.3 Analysis and findings
The findings of the pre- and post-NAFTA comparisons of U.S. exports to and imports from Mexico are presented in the Table 1. This comparison indicates that there has been a substantial increase in the volume of U.S.-Mexico corn trade in the NAFTA era. U.S. exports to Mexico averaged 4.74 million MT in the post-NAFTA period, an increase of 107 percent. U.S. imports from Mexico increased by an average of 5032 MT. The differences in the volume of trade between pre- and post-NAFTA are highly significant. The increased U.S. imports from Mexico largely reflected the white corn imports, which are produced predominantly by the Mexican producers. The limited production of white corn by U.S. growers may have contributed to the substantial increase in imports from Mexico.
Table 1: Pre- and Post-NAFTA Comparison of Corn Trade between the U.S. and Mexico Trade Avg. Pre-NAFTA
(MT) Avg. Post-NAFTA (MT) Difference (MT) Calculated t Value Prob. of t Exports 2288500 4741408 2452908 3.227 .015 Imports 968 6000 5032 4.351 .003 Model Estimation
Each single equation regression model was estimated by ordinary least squares. The statistical and economic validity of the estimated equation was evaluated after estimation. Selected statistics such as adjusted coefficient of multiple determination (R2), t-statistics, and the Durbin-Watson (D.W.) statistics to test for autocorrelation
were applied to examine the validity of the model. A one-tailed test was used to determine the statistical significance of the estimated parameters. Economic validity was evaluated by comparing the sign of the estimated parameters with a priori expectations.
The estimated parameters of these models are presented in Table 2.
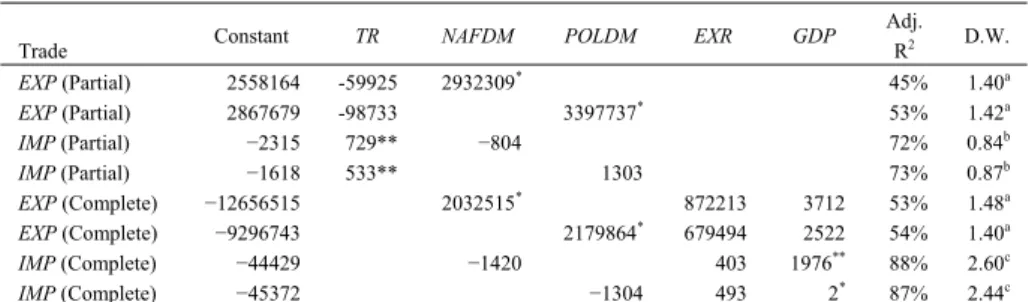
Table 2: Regression Results for U.S. Trade with Mexico
Trade Constant TR NAFDM POLDM EXR GDP
Adj. R2 D.W. EXP (Partial) 2558164 -59925 2932309* 45% 1.40a EXP (Partial) 2867679 -98733 3397737* 53% 1.42a IMP (Partial) −2315 729** −804 72% 0.84b IMP (Partial) −1618 533** 1303 73% 0.87b EXP (Complete) −12656515 2032515* 872213 3712 53% 1.48a EXP (Complete) −9296743 2179864* 679494 2522 54% 1.40a IMP (Complete) −44429 −1420 403 1976** 88% 2.60c IMP (Complete) −45372 −1304 493 2* 87% 2.44c
Notes: * and ** denote significance at 5 and 1% levels; a,b, and c denote inclusive evidence of positive,
positive, and inclusive evidence of negative autocorrelation at the 5% significance level.
EXP1986–2001 = 2558164 – 59925TR + 2932309NAFDM (–0.42) (2.24) EXP1986–2001 = 2867679 – 98733TR + 3397737POLDM (–0.77) (2.86) IMP1986–2001 = – 2315 + 729TR – 804NAFDM (3.56) (–0.43) IMP1986–2001 = – 1618 + 533TR + 1303POLDM (2.69) (0.71)
EXP1986–2001 = – 12656515 + 872213EXR + 3217GDP + 2032515NAFDM
(1.75) (1.08) (2.18)
EXP1986–2001 = – 9296743 + 679494EXR + 2522GDP + 2179864POLDM
(1.28) (0.82) (2.29)
IMP1986–2001 = – 44429 + 403EXR + 1976GDP – 1420NAFDM
(1.11) (6.21) (–1.25)
IMP1986–2001 = – 45372 + 493EXR + 2GDP – 1304POLDM
(1.08) (4.40) (–0.82)
In the partial models (TR and NAFDM or TR and POLDM) of U.S. exports to Mexico, the signs of the estimated coefficients for the NAFTA and the policy reform dummy variables were positive and statistically significant at the 5 percent level. In the partial model of U.S. imports from Mexico, neither the NAFTA nor the policy reform dummy variables were found to be significant. Here the trend variable was found to be significant at the 1 percent level and estimated to be positive. The NAFTA dummy and policy reform dummy variables were found to be significant at the 5 percent level with positive coefficients in both the complete models (NAFDM, EXR, GDP) of U.S. exports to Mexico. Neither the NAFTA dummy variable nor the policy reform variable was found to be significant in any of the complete models of U.S. imports from Mexico. In these models, the signs of the coefficients of real per capita GDP were expected to be positive and are significantly different from zero at the 1 percent level.
4. Conclusion
The pre- and post-NAFTA comparison indicates that U.S.-Mexico corn trade volume has increased significantly in the post-NAFTA era. The regression analysis does not provide conclusive evidence that such a substantial increase in the post-NAFTA era was solely due to trade liberalization through the post-NAFTA agreement. Although the NAFTA dummy variable was positive and significant in both the U.S.-Mexico export models, the policy reform dummy variable was also found positive and significant in the same export models when replacing the NAFTA dummy variable. Neither NAFTA nor Policy reform factors played a significant role in U.S. imports of corn from Mexico or Mexico’s exports of corn to U.S. Therefore, it can be concluded that that the significant post-NAFTA increase in U.S. exports to Mexico reflected the combined effects of NAFTA and other political and economic factors, such as severe drought in Mexico for which the country to import twice as
much corn as the original tariff-free quota under the NAFTA agreement, the reduction in the government’s high price supports in order to bring the corn price in line with U.S. and world prices, and the government’s withdrawal of an official ban on feeding corn to livestock.
References
Boland, M., K. Dhuyvetter, and M. Marshall, (2000), “Economic Issues with White Corn,” Agricultural Experiment Station and Cooperative Extension Service MF-2497, Kansas State University.
Colyer, D., (2001), “Impacts of NAFTA on U.S.-Mexico Agricultural Trade,” Agricultural and Resource Economics Review, West Virginia University. Foreign Agricultural Services (FAS) Database, (2002), U.S. Department of
Agriculture. http://www.fas.usda.gov/data.html.
Harrison, J., (1999), “NAFTA: The Record to Date,” World Agriculture and Trade Agricultural Outlook, Economic Research Service, USDA, 13-16.
Link, J. and S. Zahniser, (1999), “NAFTA: The Record to Date,” Agricultural Outlook, Economic Research Service, USDA.
Nadal, A., (2000a), “Mexican Corn: Genetic Variability and Trade Liberalization,” Programa Sobre Ciencia, Technologia Y Desarrollo, Documento De Trabajo No. 1-06.
Nadal, A., (2000b), “Corn and NAFTA: An Unhappy Alliance,” Seedling: The Quarterly Newsletter of Genetic Resources Action International, 17(2), 10-17. http://www.grain.org/publications/jun002-en.cfm.
Raghavan, C., (2000), “Mexico: NAFTA Corn Liberalization Farmers, Environment,” http://www.twnside.org.sg/title/mexico.htm.
Rosson, P., G. Besnon, K. Moulton, and L. Sanders, (1999), “North American Free Trade and U.S. Agriculture,” Agricultural Experiment Station and Cooperative Extension Service, Kansas State University.