The association between anthropometric
measurements and nutritional status in
chronic hemodialysis patients
Chiu YC
1
, Lin WC
1
, Yang SH
1,2
1
School of Nutrition and Health Sciences, Taipei
Medical University
2
Nutrition research center, Taipei Medical University
Abstract
Objective: Our study was to evaluate the association between
anthropometric measurements and nutritional status in chronic hemodialysis
(CHD) patients.
Method: 107 hemodialysis patients were recruited from Taipei Medical
University Hospital and Wanfang Hospital in 2010. Which were 53 males
and 54 females. The mean of age was 63.4 years and the mean of body
mass index (BMI) was 23.1. We used the BMI to classify subjects into three
groups, includes underweight ( BMI <18.5 ), normal weight ( 18.5 < BMI <
23.9 ) and overweight & obese ( BMI ≧ 24) groups.
Result: Overweight & obese group had higher phosphate and calcium ×
phosphate than underweight group. Normal weight and overweight & obese
groups had higher GNRI score than underweight group
.
Higher BMI groups
includes normal weight and overweight & obese groups had more well-
nourished (GNRI score > 90) but lower calorie and protein intake.
Conclusion: Higher BMI may reflect well-nourished in CHD patients, but they
have lower dietary intake.
Introduction
Hemodialysis (HD) patients with elevated body mass index
(BMI) demonstrate better nutritional status compared to normal
BMI or overweight patients. Our study was to evaluate the
association between anthropometric measurements and
nutritional status in chronic hemodialysis (CHD) patients.
Results
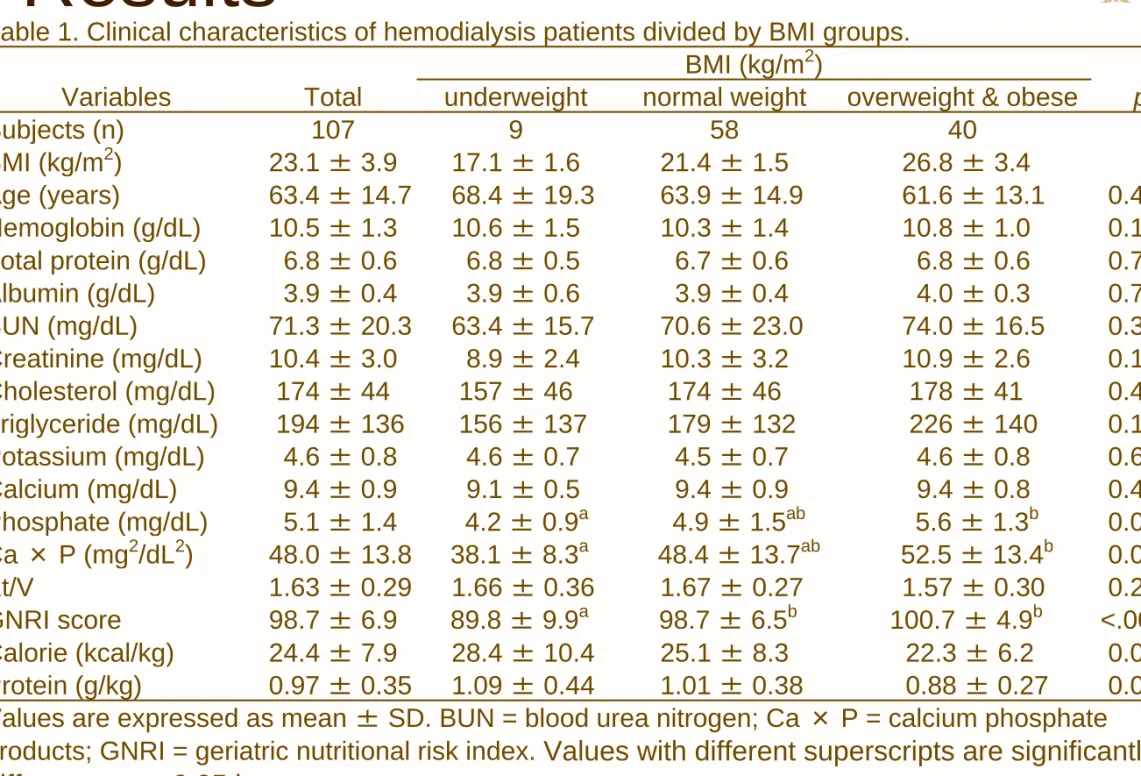
Table 1. Clinical characteristics of hemodialysis patients divided by BMI groups. BMI (kg/m2)
Variables Total underweight normal weight overweight & obese p
Subjects (n) 107 9 58 40 BMI (kg/m2) 23.1 ± 3.9 17.1 ± 1.6 21.4 ± 1.5 26.8 ± 3.4 Age (years) 63.4 ± 14.7 68.4 ± 19.3 63.9 ± 14.9 61.6 ± 13.1 0.426 Hemoglobin (g/dL) 10.5 ± 1.3 10.6 ± 1.5 10.3 ± 1.4 10.8 ± 1.0 0.174 Total protein (g/dL) 6.8 ± 0.6 6.8 ± 0.5 6.7 ± 0.6 6.8 ± 0.6 0.744 Albumin (g/dL) 3.9 ± 0.4 3.9 ± 0.6 3.9 ± 0.4 4.0 ± 0.3 0.741 BUN (mg/dL) 71.3 ± 20.3 63.4 ± 15.7 70.6 ± 23.0 74.0 ± 16.5 0.345 Creatinine (mg/dL) 10.4 ± 3.0 8.9 ± 2.4 10.3 ± 3.2 10.9 ± 2.6 0.167 Cholesterol (mg/dL) 174 ± 44 157 ± 46 174 ± 46 178 ± 41 0.439 Triglyceride (mg/dL) 194 ± 136 156 ± 137 179 ± 132 226 ± 140 0.168 Potassium (mg/dL) 4.6 ± 0.8 4.6 ± 0.7 4.5 ± 0.7 4.6 ± 0.8 0.643 Calcium (mg/dL) 9.4 ± 0.9 9.1 ± 0.5 9.4 ± 0.9 9.4 ± 0.8 0.463 Phosphate (mg/dL) 5.1 ± 1.4 4.2 ± 0.9a 4.9 ± 1.5ab 5.6 ± 1.3b 0.013 Ca × P (mg2/dL2) 48.0 ± 13.8 38.1 ± 8.3a 48.4 ± 13.7ab 52.5 ± 13.4b 0.007 Kt/V 1.63 ± 0.29 1.66 ± 0.36 1.67 ± 0.27 1.57 ± 0.30 0.237 GNRI score 98.7 ± 6.9 89.8 ± 9.9a 98.7 ± 6.5b 100.7 ± 4.9b <.0001 Calorie (kcal/kg) 24.4 ± 7.9 28.4 ± 10.4 25.1 ± 8.3 22.3 ± 6.2 0.062 Protein (g/kg) 0.97 ± 0.35 1.09 ± 0.44 1.01 ± 0.38 0.88 ± 0.27 0.097 Values are expressed as mean ± SD. BUN = blood urea nitrogen; Ca × P = calcium phosphate
products; GNRI = geriatric nutritional risk index.
Values with different superscripts are significantly
different at p < 0.05 by t test.
Results
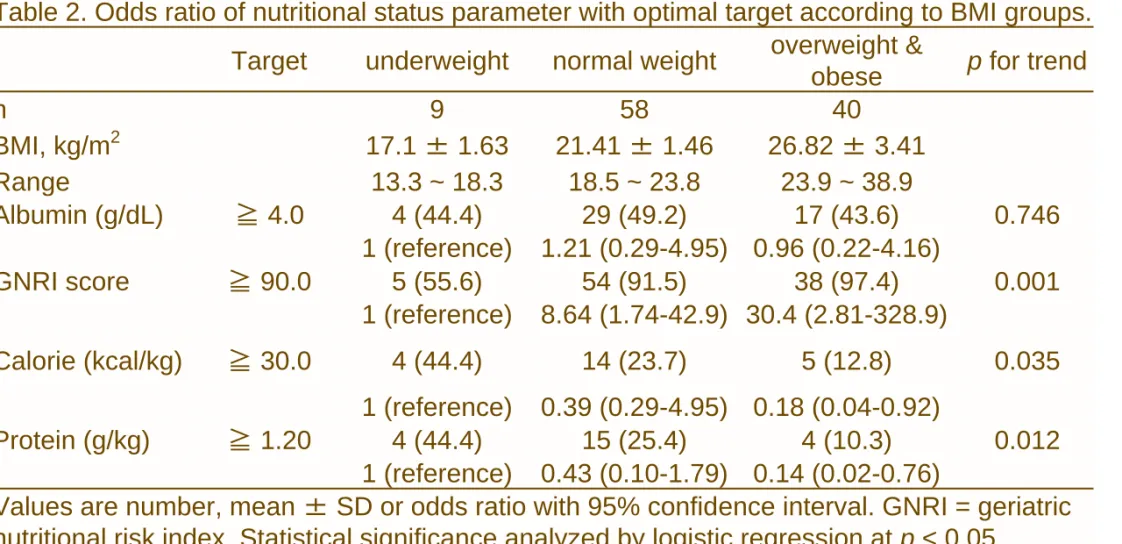
Table 2. Odds ratio of nutritional status parameter with optimal target according to BMI groups. Target underweight normal weight overweight &
obese p for trend
n 9 58 40 BMI, kg/m2 17.1 ± 1.63 21.41 ± 1.46 26.82 ± 3.41 Range 13.3 ~ 18.3 18.5 ~ 23.8 23.9 ~ 38.9 Albumin (g/dL) ≧ 4.0 4 (44.4) 29 (49.2) 17 (43.6) 0.746 1 (reference) 1.21 (0.29-4.95) 0.96 (0.22-4.16) GNRI score ≧ 90.0 5 (55.6) 54 (91.5) 38 (97.4) 0.001 1 (reference) 8.64 (1.74-42.9) 30.4 (2.81-328.9) Calorie (kcal/kg) ≧ 30.0 4 (44.4) 14 (23.7) 5 (12.8) 0.035 1 (reference) 0.39 (0.29-4.95) 0.18 (0.04-0.92) Protein (g/kg) ≧ 1.20 4 (44.4) 15 (25.4) 4 (10.3) 0.012 1 (reference) 0.43 (0.10-1.79) 0.14 (0.02-0.76)
Values are number, mean ± SD or odds ratio with 95% confidence interval. GNRI = geriatric nutritional risk index. Statistical significance analyzed by logistic regression at p < 0.05.
Result
Overweight & obese group had higher phosphate and calcium ×
phosphate than underweight group. Normal weight and overweight
& obese groups had higher GNRI score than underweight group
.
Higher BMI groups includes normal weight and overweight & obese
groups had more well-nourished (GNRI score > 90) but lower
calorie and protein intake. We suggested that overweight & obese
was told to decrease calorie and protein intake by dietitians.
Conclusion