Asia Pac J Clin Nutr 2007;16 (4):766-776 766
Original Article
Meal distribution, relative validity and reproducibility
of a meal-based food frequency questionnaire in
Taiwan
Li-Ching Lyu
PhD1, Chi-Fen Lin
BS1, Fang-Hsin Chang
BS1, Heng-Fei Chen
MS1,
Chiao-Chen Lo
MS1and Hong-Fa Ho
PhD21
Department of Human Development and Family Studies, National Taiwan Normal University, Taipei, Taiwan 2
Department of Industrial Education, National Taiwan Normal University, Taipei, Taiwan
Food frequency questionnaire is an important assessment tool for public health nutrition research. We describe the development history and conducted the validity and reproducibility studies for a meal-based Chinese food frequency questionnaire (Chinese FFQ) by five meal sequences. A total of 51 subjects were recruited to collect dietary information twice (6 months apart) with one 24-hr recall, 7-day food records and the Chinese FFQ. Combining data from both time sets, Chinese FFQ showed strong correlations of macro and micronutrients with 7-day records (n=60, r=0.29-0.50, p<0.05), but not with 24-hr recalls (n=60, r=0.01-0.23, p>0.05). The repro-ducibility of this Chinese FFQ (n=22) was consistently high for most nutrients, with Spearman correction coeffi-cients between 0.42 for vitamin A to 0.79 for vitamin B12. From a larger sample of 231 subjects who completed the Chinese FFQ and one 24-hr recall, we found the energy distributions of breakfast, lunch, dinner, afternoon and evening snacks combined from Chinese FFQ were 20%, 37%, 37% and 6%, and from 24-hour recalls were 19%, 36%, 44% and 1%, respectively. These results showed acceptable reproducibility and relative validity of this meal-based Chinese FFQ.
Key Words: meal distribution, relative validity, reproducibility, meal-based food frequency questionnaire, Taiwan
INTRODUCTION
Nutritional epidemiology is a rapidly growing science and relies largely on dietary assessment methods for the estima-tion of the "exposure" variables that may be related to disease risk. Much inspiration comes from the direct rele-vance of this type of research to crucial health problems of modern societies, such as cancers,1 cardiovascular diseases, 2 osteoporosis,3 cataracts,4 diabetes5 and congenital malfor-mations.6 All of these diseases/conditions have been the objects of research in nutritional epidemiology globally, and some of the findings have already been applied in ways that may improve public health. However, the major diffi-culty of nutritional epidemiology lies in the extremely complex nature of diet.7 Because short-term recall and diet record methods are generally expensive and inappropriate for assessment of individual usual past diet, investigators have sought alternative methods for measuring long-term dietary intakes. After Burke8 developed a detailed dietary history interview that attempted to assess an individual’s usual diet, in the 1950’s and 60’s researchers in Europe, such as Heady9 and the USA, such as Hankin10 have been independently converging toward food frequency methods.
For many years, the development of an appropriate food frequency questionnaire (FFQ) as a long-term dietary assessment tool to facilitate diet-disease association studies, has been conducted in various populations including North America,11 South America,12 Europe13 and China.14 The
development process is extremely complex and highly technically oriented. Baghurst in a workshop of the second Berlin meeting on nutritional epidemiology reported that there is need of a period of over 10 years, for the develop-ment of data collection techniques and attendant computer analysis programs for diet history methods.15 In Taiwan, we have been utilizing the meal-based FFQ idea in an attempt to assess the usual dietary consumption for study-ing individuals for various case-control and family studies since 1998 .16-18 In this study, we first describe the devel-opment history of the meal-based Chinese FFQ used in Taiwan. Second, we documented the relative validity and reproducibility study of the Chinese FFQ.
MATERIALS AND METHODS
Development of three versions of Chinese FFQ
Since 1998, we have developed early drafts of the first version of the Chinese food frequency questionnaire
Corresponding Author: Li-Ching Lyu, MPH, PhD, Professor,
Department of Human Development and Family Studies, National Taiwan Normal University, #162 Sec.1, Hoping E. Road, Taipei, Taiwan 10610
Tel/ Fax: 886-2-23648850 Email: t10010@ntnu.edu.tw
Manuscript received 8 January 2007. Initial review completed 4 February 2007. Revision accepted 24 May 2007.
767 LC Lyu, CF Lin, FH Chang, HF Chen, CC Lo and HF Ho (Chinese FFQv1), particular attention being paid to
decid-ing food groupdecid-ing, frequency, and portion size. We se-lected food items based on observations of meal patterns in urban Chinese (mainly Taipei, Taiwan) and also refer-enced the popular items of mixed dishes from National Health and Nutrition Examination Survey in Taiwan (per-sonal communication). This Chinese FFQv1 was devel-oped by a meal sequence consisting of breakfast (foods eaten before eleven o’clock in the morning); lunch (be-tween eleven in the morning and two in the afternoon); afternoon snacks (between two and five in the afternoon); dinner (between five to nice o’clock in the afternoon); and evening snacks (after nine in the evening). Five catego-ries of frequency were: less than once per month; 1-3 times per month; 1-3 times per week; 4-6 times per week; and more than once per day. Three portion sizes of small, medium and large were listed in the Chinese FFQv1 and subjects selected one of the three choices.
The second version of this questionnaire (Chinese FFQv2) intends to assess usual dietary intakes over 6 months and consists of eight categories of frequency: never (less than once per month); once per month; 2-3 times per month; once per week; 2-3 times per week; 4-6
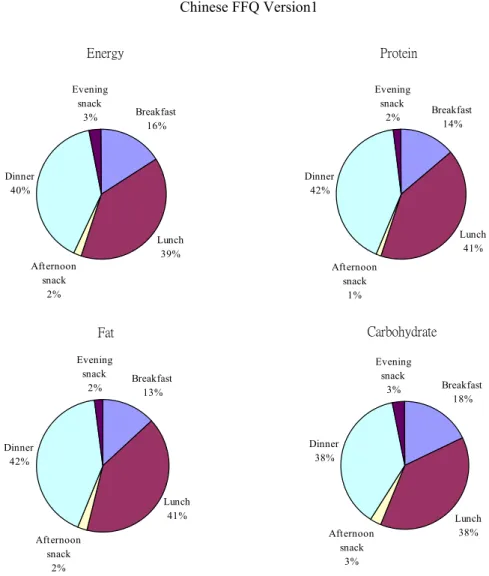
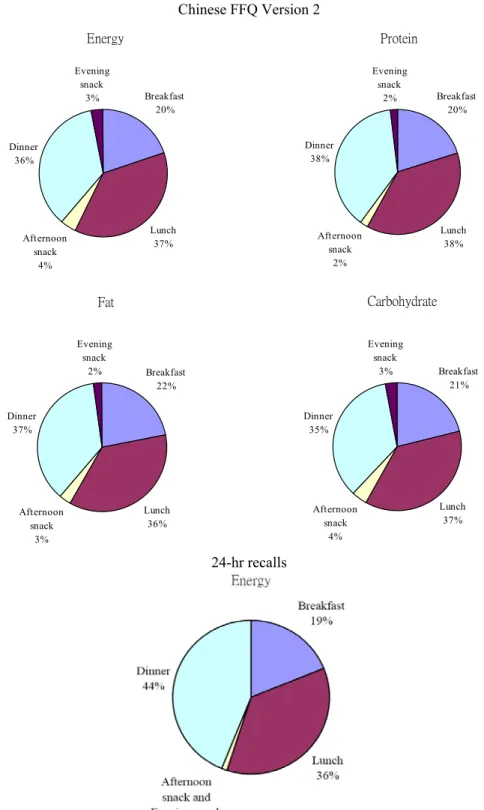
times per week; once per day and more than once per day. Three portion sizes of small, medium and large were listed in the Chinese FFQv2 and study subjects selected one of the three choices. This version of questionnaire has reduced and regrouped the food items from 482 items in the first version, to 216 items, without changing the en-ergy distributions from protein, fat and carbohydrate with comparison to group means by 24-hr recalls. The meal distributions for energy, protein, fat and carbohydrate calculated from 348 subjects by Chinese FFQv1, 231 sub-jects by Chinese FFQv2 and energy distribution from 40 subjects by 24-hour recalls are illustrated in Figure 1. The macronutrient distributions among five meals are comparable between the two versions, and the energy distribution is similar to results from 24-hour recalls. In 2002, we have developed the third version of the Chinese FFQ for assessing dietary patterns for pregnant women, further shortening the questionnaire by eliminating food items that more than 50% of subjects had never eaten in the second version of the Chinese FFQ. Table 1 shows the development and reduction of food items in five meal orders in the three versions of this Chinese food fre-quency questionnaire. Chinese FFQ Version1 Energy Protein Breakfast 16% Lunch 39% Afternoon snack 2% Dinner 40% Evening snack 3% Breakfast 14% Lunch 41% Afternoon snack 1% Dinner 42% Evening snack 2% Fat Carbohydrate Breakfast 13% Lunch 41% Afternoon snack 2% Dinner 42% Evening snack 2% Breakfast 18% Lunch 38% Afternoon snack 3% Dinner 38% Evening snack 3%
Validity and reproducibility of a meal-based Chinese FFQ 768
Validity and reproducibility of second version of Chi-nese FFQ
From Jan. 2001 to May 2002, we recruited 51 subjects (10 men and 41 women) from age 20 to 62, with a mean age of 29 years, to collect dietary information by the first set of one 24-hr recall, the 7-day food records and the Chinese FFQv2. We collected the second set of these three methods from Aug. 2001 to June 2002. The partici-pants were mostly university students and staff. A total of 39 subjects (8 men and 31 women) completed all three methods in the first set, and 22 subjects (2 men and 20 women) completed the second set, both with an average age of 29. The main drop out reason was the lack of Chinese FFQ Version 2 Energy Protein Breakfast 20% Lunch 37% Afternoon snack 4% Dinner 36% Evening snack 3% Breakfast 20% Lunch 38% Afternoon snack 2% Dinner 38% Evening snack 2% Fat Carbohydrate Breakfast 22% Lunch 36% Afternoon snack 3% Dinner 37% Evening snack 2% Breakfast 21% Lunch 37% Afternoon snack 4% Dinner 35% Evening snack 3% 24-hr recalls
Figure 1. Meal distributions of macronutrients for Chinese FFQ Version1, Chinese FFQ Version 2, and 24-hr recalls
Table 1. Reduction of food items by different ver-sions of Chinese FFQ
Version1 Version2 Version3
Breakfast 105 36 28 Lunch 135 64 54 Afternoon snack 40 27 16 Dinner 134 64 54 Evening snack 68 25 19 Others 0 1 1 Total 482 217 172
769 LC Lyu, CF Lin, FH Chang, HF Chen, CC Lo and HF Ho
willingness to conduct the 7-day food records. Figure 2 shows the study design and numbers of subjects who completed each method in the two sequences for the va-lidity and reproducibility of the Chinese FFQv2. The time range between the two sets was from 5 to 18 months, with an average of 7.5 months.
We collected one day 24-hour recall and Chinese FFQ by face-to-face interviews, the 7-day food records by self-administrated method after an instruction on household measures description. All food recall and records were processed by standardized procedures and coding manu-als for home recipes and commercial products were de-veloped and utilized to convert common portions to actual grams. Since 1998, we have developed an integrated da-tabase management system, not only to manage food composition table for more than 200 nutrients. This sys-tem also contains the recall and record calculation syssys-tem considering dates, number of days and meal separations. In addition, the Chinese Food Frequency Editing System contains the management of food list, frequency and por-tion size selecpor-tions to facilitate processing the various versions of Chinese FFQ. 19 The nutrients included in the analyses consisted of energy, protein, fat, carbohydrate, vitamin A, vitamin E, vitamin B1, vitamin B2, Niacin, vitamin B6, vitamin B12, vitamin C, calcium, phosphorus, iron, cholesterol and dietary fiber.
Statistical analyses
Demographic characteristics including age, sex and edu-cational levels of completed participants were compared from the first and second time periods and found not to be significantly different. Since the study sample was small, we combined dietary information from men and women and calculated mean and standard deviations for subgroup analyses. One outlier consumed more than 10,000 kcal from the first Chinese FFQv2 and was both included and eliminated from the data for analyses, both results were compared and documented. The paired t- test for testing repeated measures, Students’ t-test for group comparisons, and one-way analysis of variance (ANOVA) were used for comparing results from three dietary methods and two time periods. Both nonparametric Spearman coefficients from ranked data and Pearson coefficients were calculated for normally distributed dietary data or natural log trans-formed data.
RESULTS
To compare results from two sets of collected data, Table 2 shows the daily intakes of selective nutrients by three
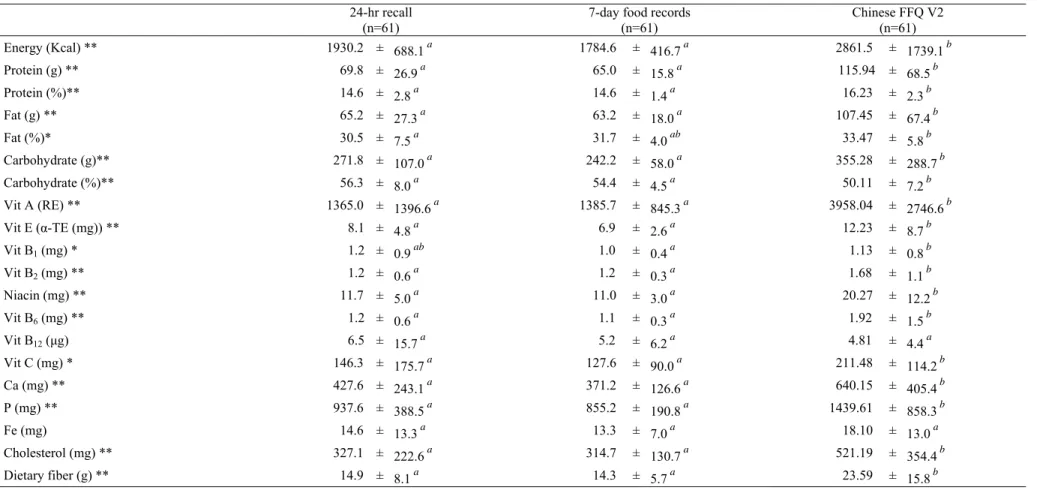
dietary assessment methods at two time periods from 22 subjects by paired t-test. The Chinese FFQv2 shows simi-lar daily intakes for every nutrient from two time points. However, the 24-hour recall and 7-day food records methods demonstrated decreased nutrient intakes, includ-ing energy, protein, fat, carbohydrate, vitamin A, vitamin E, vitamin B1, vitamin B2, niacin, vitamin B6, vitamin B12, vitamin C, calcium, phosphorus, iron, cholesterol and dietary fiber at the second time consistently, but only en-ergy, protein, carbohydrate, vitamin E, niacin, vitamin C, calcium, iron and dietary fiber from 24-hour recalls reached significant levels (p<0.05). However the percents of energy from protein, fat and carbohydrate are similar between the two time sets for all three methods (24-hour recall and 7-day record: 15%, 30%, 55%, Chinese FFQv2: 16%, 33%, 51%) indicating the percentage of major en-ergy contributors are fairly consistent between the two time sets. Table 3 shows the comparisons of these three methods combined the first and second sets (n=61). The Chinese FFQv2 demonstrated significantly higher intakes of energy, protein, protein (%), fat, fat (%), carbohydrate, vitamin A, vitamin B2, vitamin C, calcium, phosphorus, cholesterol and dietary fiber, and lower carbohydrate (%) compared to 24-hour recalls (p<0.05). In comparison with 7-day food records, the Chinese FFQv2 showed sig-nificantly higher intakes of energy, protein, protein (%), fat, carbohydrate, vitamin A, vitamin B1, vitamin B2, vi-tamin C, calcium, phosphorus, cholesterol and dietary fiber, and lower carbohydrate (%) (p<0.05). Even though vitamin B12 consumption was lower and iron intake was higher from the Chinese FFQv2 than the two other meth-ods, the level did not reach significance.
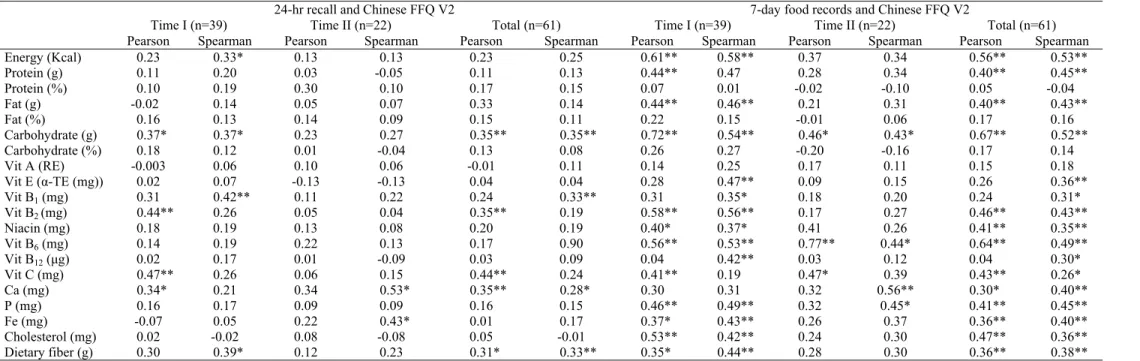
Correlation coefficients (r) indicating the relative valid-ity for the Chinese FFQv2 of selective nutrient intakes compared to 24-hour recalls and 7-day dietary records, are illustrated in Table 4. Dietary consumption by 7-day records showed high corrections with results from the Chinese FFQv2. Except for percents of energy from pro-tein, fat, carbohydrate and vitamin A, all other nutrients, including energy source nutrients: protein (r=0.45), fat (r=0.43) and carbohydrate (r=0.52), fat soluble vitamins including vitamin E (r=0.36), water soluble vitamins in-cluding vitamin B1, B2, B6, B12, C and niacin (r=0.26-0.49), minerals including calcium, phosphorus and iron (r=0.40-0.45), cholesterol (r=0.36) and dietary fiber (r=0.38) had significant correlations between these two methods. However, in comparison to 7-day food records, the relative validity of the CFFQv2 versus 24-hour recalls was lower. Only carbohydrate (r=0.35), vitamin B1 Figure 2. Design and subject number of validity and reproducibility study of the Chinese food frequency questionnaire
Validity and reproducibility of a meal-based Chinese FFQ 770
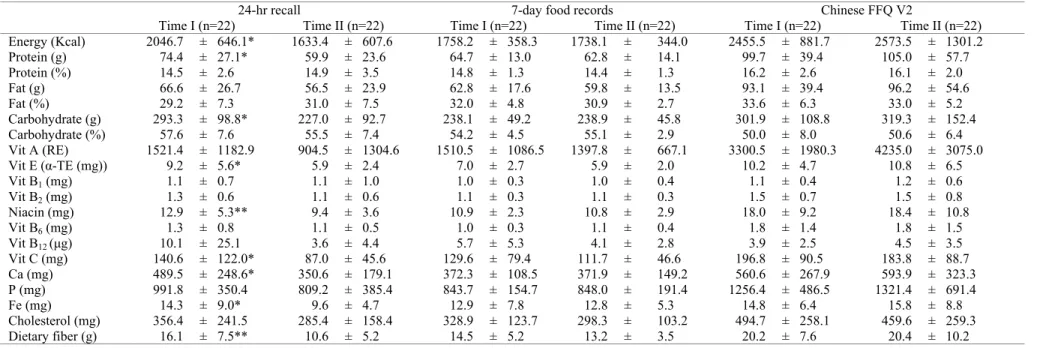
Table 2. Daily intakes of selective nutrients by three dietary assessment methods at two time periods
24-hr recall 7-day food records Chinese FFQ V2
Time I (n=22) Time II (n=22) Time I (n=22) Time II (n=22) Time I (n=22) Time II (n=22)
Energy (Kcal) 2046.7 ± 646.1* 1633.4 ± 607.6 1758.2 ± 358.3 1738.1 ± 344.0 2455.5 ± 881.7 2573.5 ± 1301.2 Protein (g) 74.4 ± 27.1* 59.9 ± 23.6 64.7 ± 13.0 62.8 ± 14.1 99.7 ± 39.4 105.0 ± 57.7 Protein (%) 14.5 ± 2.6 14.9 ± 3.5 14.8 ± 1.3 14.4 ± 1.3 16.2 ± 2.6 16.1 ± 2.0 Fat (g) 66.6 ± 26.7 56.5 ± 23.9 62.8 ± 17.6 59.8 ± 13.5 93.1 ± 39.4 96.2 ± 54.6 Fat (%) 29.2 ± 7.3 31.0 ± 7.5 32.0 ± 4.8 30.9 ± 2.7 33.6 ± 6.3 33.0 ± 5.2 Carbohydrate (g) 293.3 ± 98.8* 227.0 ± 92.7 238.1 ± 49.2 238.9 ± 45.8 301.9 ± 108.8 319.3 ± 152.4 Carbohydrate (%) 57.6 ± 7.6 55.5 ± 7.4 54.2 ± 4.5 55.1 ± 2.9 50.0 ± 8.0 50.6 ± 6.4 Vit A (RE) 1521.4 ± 1182.9 904.5 ± 1304.6 1510.5 ± 1086.5 1397.8 ± 667.1 3300.5 ± 1980.3 4235.0 ± 3075.0 Vit E (α-TE (mg)) 9.2 ± 5.6* 5.9 ± 2.4 7.0 ± 2.7 5.9 ± 2.0 10.2 ± 4.7 10.8 ± 6.5 Vit B1 (mg) 1.1 ± 0.7 1.1 ± 1.0 1.0 ± 0.3 1.0 ± 0.4 1.1 ± 0.4 1.2 ± 0.6 Vit B2 (mg) 1.3 ± 0.6 1.1 ± 0.6 1.1 ± 0.3 1.1 ± 0.3 1.5 ± 0.7 1.5 ± 0.8 Niacin (mg) 12.9 ± 5.3** 9.4 ± 3.6 10.9 ± 2.3 10.8 ± 2.9 18.0 ± 9.2 18.4 ± 10.8 Vit B6 (mg) 1.3 ± 0.8 1.1 ± 0.5 1.0 ± 0.3 1.1 ± 0.4 1.8 ± 1.4 1.8 ± 1.5 Vit B12 (μg) 10.1 ± 25.1 3.6 ± 4.4 5.7 ± 5.3 4.1 ± 2.8 3.9 ± 2.5 4.5 ± 3.5 Vit C (mg) 140.6 ± 122.0* 87.0 ± 45.6 129.6 ± 79.4 111.7 ± 46.6 196.8 ± 90.5 183.8 ± 88.7 Ca (mg) 489.5 ± 248.6* 350.6 ± 179.1 372.3 ± 108.5 371.9 ± 149.2 560.6 ± 267.9 593.9 ± 323.3 P (mg) 991.8 ± 350.4 809.2 ± 385.4 843.7 ± 154.7 848.0 ± 191.4 1256.4 ± 486.5 1321.4 ± 691.4 Fe (mg) 14.3 ± 9.0* 9.6 ± 4.7 12.9 ± 7.8 12.8 ± 5.3 14.8 ± 6.4 15.8 ± 8.8 Cholesterol (mg) 356.4 ± 241.5 285.4 ± 158.4 328.9 ± 123.7 298.3 ± 103.2 494.7 ± 258.1 459.6 ± 259.3 Dietary fiber (g) 16.1 ± 7.5** 10.6 ± 5.2 14.5 ± 5.2 13.2 ± 3.5 20.2 ± 7.6 20.4 ± 10.2 **p<0.01; *p<0.05
LC Lyu, CF Lin, FH Chang, HF Chen, CC Lo and HF Ho 771
Table 3. Comparisons of selective daily nutrient intakes by three dietary assessment methods
24-hr recall 7-day food records Chinese FFQ V2
(n=61) (n=61) (n=61) Energy (Kcal) ** 1930.2 ± 688.1a 1784.6 ± 416.7a 2861.5 ± 1739.1b Protein (g) ** 69.8 ± 26.9a 65.0 ± 15.8a 115.94 ± 68.5b Protein (%)** 14.6 ± 2.8a 14.6 ± 1.4a 16.23 ± 2.3b Fat (g) ** 65.2 ± 27.3a 63.2 ± 18.0a 107.45 ± 67.4b Fat (%)* 30.5 ± 7.5a 31.7 ± 4.0ab 33.47 ± 5.8b Carbohydrate (g)** 271.8 ± 107.0a 242.2 ± 58.0a 355.28 ± 288.7b Carbohydrate (%)** 56.3 ± 8.0a 54.4 ± 4.5a 50.11 ± 7.2b Vit A (RE) ** 1365.0 ± 1396.6a 1385.7 ± 845.3a 3958.04 ± 2746.6b Vit E (α-TE (mg)) ** 8.1 ± 4.8a 6.9 ± 2.6a 12.23 ± 8.7b Vit B1 (mg) * 1.2 ± 0.9ab 1.0 ± 0.4a 1.13 ± 0.8b Vit B2 (mg) ** 1.2 ± 0.6a 1.2 ± 0.3a 1.68 ± 1.1b Niacin (mg) ** 11.7 ± 5.0a 11.0 ± 3.0a 20.27 ± 12.2b Vit B6 (mg) ** 1.2 ± 0.6a 1.1 ± 0.3a 1.92 ± 1.5b Vit B12 (μg) 6.5 ± 15.7a 5.2 ± 6.2a 4.81 ± 4.4a Vit C (mg) * 146.3 ± 175.7a 127.6 ± 90.0a 211.48 ± 114.2b Ca (mg) ** 427.6 ± 243.1a 371.2 ± 126.6a 640.15 ± 405.4b P (mg) ** 937.6 ± 388.5a 855.2 ± 190.8a 1439.61 ± 858.3b Fe (mg) 14.6 ± 13.3a 13.3 ± 7.0a 18.10 ± 13.0a Cholesterol (mg) ** 327.1 ± 222.6a 314.7 ± 130.7a 521.19 ± 354.4b Dietary fiber (g) ** 14.9 ± 8.1a 14.3 ± 5.7a 23.59 ± 15.8b
Validity and reproducibility of a meal-based Chinese FFQ 772
Table 4. Correlation coefficients (r) between nutrients estimated by three dietary assessment methods
24-hr recall and Chinese FFQ V2 7-day food records and Chinese FFQ V2
Time I (n=39) Time II (n=22) Total (n=61) Time I (n=39) Time II (n=22) Total (n=61)
Pearson Spearman Pearson Spearman Pearson Spearman Pearson Spearman Pearson Spearman Pearson Spearman
Energy (Kcal) 0.23 0.33* 0.13 0.13 0.23 0.25 0.61** 0.58** 0.37 0.34 0.56** 0.53** Protein (g) 0.11 0.20 0.03 -0.05 0.11 0.13 0.44** 0.47 0.28 0.34 0.40** 0.45** Protein (%) 0.10 0.19 0.30 0.10 0.17 0.15 0.07 0.01 -0.02 -0.10 0.05 -0.04 Fat (g) -0.02 0.14 0.05 0.07 0.33 0.14 0.44** 0.46** 0.21 0.31 0.40** 0.43** Fat (%) 0.16 0.13 0.14 0.09 0.15 0.11 0.22 0.15 -0.01 0.06 0.17 0.16 Carbohydrate (g) 0.37* 0.37* 0.23 0.27 0.35** 0.35** 0.72** 0.54** 0.46* 0.43* 0.67** 0.52** Carbohydrate (%) 0.18 0.12 0.01 -0.04 0.13 0.08 0.26 0.27 -0.20 -0.16 0.17 0.14 Vit A (RE) -0.003 0.06 0.10 0.06 -0.01 0.11 0.14 0.25 0.17 0.11 0.15 0.18 Vit E (α-TE (mg)) 0.02 0.07 -0.13 -0.13 0.04 0.04 0.28 0.47** 0.09 0.15 0.26 0.36** Vit B1 (mg) 0.31 0.42** 0.11 0.22 0.24 0.33** 0.31 0.35* 0.18 0.20 0.24 0.31* Vit B2 (mg) 0.44** 0.26 0.05 0.04 0.35** 0.19 0.58** 0.56** 0.17 0.27 0.46** 0.43** Niacin (mg) 0.18 0.19 0.13 0.08 0.20 0.19 0.40* 0.37* 0.41 0.26 0.41** 0.35** Vit B6 (mg) 0.14 0.19 0.22 0.13 0.17 0.90 0.56** 0.53** 0.77** 0.44* 0.64** 0.49** Vit B12 (μg) 0.02 0.17 0.01 -0.09 0.03 0.09 0.04 0.42** 0.03 0.12 0.04 0.30* Vit C (mg) 0.47** 0.26 0.06 0.15 0.44** 0.24 0.41** 0.19 0.47* 0.39 0.43** 0.26* Ca (mg) 0.34* 0.21 0.34 0.53* 0.35** 0.28* 0.30 0.31 0.32 0.56** 0.30* 0.40** P (mg) 0.16 0.17 0.09 0.09 0.16 0.15 0.46** 0.49** 0.32 0.45* 0.41** 0.45** Fe (mg) -0.07 0.05 0.22 0.43* 0.01 0.17 0.37* 0.43** 0.26 0.37 0.36** 0.40** Cholesterol (mg) 0.02 -0.02 0.08 -0.08 0.05 -0.01 0.53** 0.42** 0.24 0.30 0.47** 0.36** Dietary fiber (g) 0.30 0.39* 0.12 0.23 0.31* 0.33** 0.35* 0.44** 0.28 0.30 0.36** 0.38** **p<0.01; *p<0.05
773 LC Lyu, CF Lin, FH Chang, HF Chen, CC Lo and HF Ho
(r=0.33), calcium (0.28) and dietary fiber (r=0.33) had significant correlations between the Chinese FFQv2 and 24-hour recalls (p<0.05). When one outlier consumed more than 10,000 kcal from the first Chinese FFQv2 and was eliminated from the final analyses, the Chinese FFQv2 still showed strong correlations of macro- and micronutrients, with 7-day records (n=60, r=0.29-0.50, p<0.05), but not with 24-hr recalls (n=60, r=0.01-0.23, p>0.05) (data not shown).
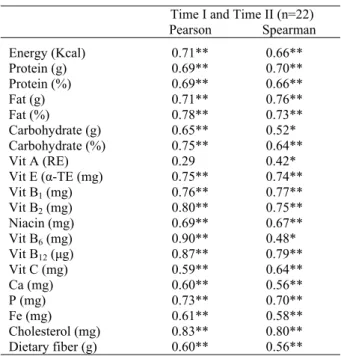
Table 5 shows the correlation coefficients representing the reproducibility of the Chinese FFQv2 from 22 sub-jects who completed the Chinese FFQv2 in the two time periods. Pearson correlation coefficients and Spearman correlation coefficients of all the selective nutrients be-tween two administrations of the Chinese FFQv2 were significant, except Pearson correlation coefficient of vi-tamin A (r=0.29, p>0.05). Generally speaking, the repro-ducibility of this Chinese FFQv2 was consistently high for most nutrients, with Spearman correction coefficients between 0.42 for vitamin A to 0.79 for vitamin B12. The macronutrients and micronutrients had a similar magni-tude of correlations.
DISCUSSION
The food frequency method is one of the three currently usable dietary methods, the other two being 24-hour recall and food record, (both actual diet assessment methods for measuring short-term intakes).20 In general, there are two major types of food frequency methods: first, the semi-quantitative questionnaire consisting of two major com-ponents, food group (food list) and food frequency. Sec-ond, the quantitative total diet questionnaire with three components includes food group, frequency, and portion size. These two types of FFQ have served their purposes similarly in practice, but with very different conceptual bases and process procedures. Moreover the
overesti-mated or underestioveresti-mated daily values calculated from various FFQ were depending upon the numbers of food items (double counting of similar food items or omitting foods not in the list), frequency category and portion size assignment, therefore this method generally was not used to estimate average daily intakes of nutrients.
We have developed the first and second versions of the meal-based Chinese food frequency questionnaire with five meal sequences and three portion sizes, and have utilized them for assessing dietary patterns in Taiwan. Our data showed that by comparing the group means to 7-day records and 24-hour recalls, the Chinese FFQv2 showed a slightly higher percent of energy from protein (16.2% vs. 14.7% and 14.6%) and fat (33.5% vs. 31.8% and 30.7%) and a lower percent of energy from carbohy-drate (50.0% vs. 54.2% and 56.0%). One of the possible reasons is that we did not include food items with starchy roots and tubers such as potatoes, sweet potatoes and taro products in the Chinese FFQv2. In 2002, we developed the third version of the Chinese FFQ for assessing dietary patterns for pregnant women, further shortening the ques-tionnaire and eliminating the portion size choices, be-cause pregnant women tend to increase meal quantities continuously along with the pregnancy. We also trained the interviewers to utilize the blank food items to docu-ment missing starchy root and tuberous food items in the Chinese FFQv3, if frequently eaten by the subjects.
Many researchers suggested that dietary studies should attempt to assess the whole diet, not one or a few nutri-ents. Total diet quantitative questionnaires such as Block21 and Hankin22,23 have developed in the USA, are good examples of this type of format, consisting of three major components: a long list of food groups; a frequency category; and a portion size category. There is a major difference between the "pure diet history method" and the "frequency method". The context of a diet history is al-ways in terms of a given meal, but the frequency method usually loses the variation by meals.24 It was our attempt to develop a method to retain the meal sequences that may play a role in increasing the precision of the Chinese FFQ method. Until the present, we have developed a for-mat for breakfast, lunch, afternoon snacks, dinner, eve-ning snacks, five time periods corresponding with each meal. These meal-based food frequency methods were developed and reported by O'Donnell in London,24 Wheeler et al. in Australia,25 and Fregapane and Asensio-Garcia in Spain.26 Our questionnaire was based on five time sequences of meal habits, while the format was to ask separately about the frequency of consumption of each recipe in the meal. Our data in figure 1 also sug-gested that precise estimations for dietary patterns and meal distributions by meal-based FFQ warrant further improvements in addition to the acceptable reproducibil-ity and relative validreproducibil-ity of this Chinese FFQ.
The design and analysis of validation and precision studies of the quantitative total diet FFQ method depends upon the purpose of the ultimate study in which the FFQ will be used to associate nutrient intake with disease oc-currence. Since studies of absolute validity of food fre-quency methods are limited, most studies have assessed only relative validity.23, 27-29 Block and coworkers re-ported the validity of two quantitative FFQ: one was her Table 5. Correlation coefficients (r) between
nutri-ents estimated by repeated Chinese FFQ V2 Time I and Time II (n=22)
Pearson Spearman Energy (Kcal) 0.71** 0.66** Protein (g) 0.69** 0.70** Protein (%) 0.69** 0.66** Fat (g) 0.71** 0.76** Fat (%) 0.78** 0.73** Carbohydrate (g) 0.65** 0.52* Carbohydrate (%) 0.75** 0.64** Vit A (RE) 0.29 0.42* Vit E (α-TE (mg) 0.75** 0.74** Vit B1 (mg) 0.76** 0.77** Vit B2 (mg) 0.80** 0.75** Niacin (mg) 0.69** 0.67** Vit B6 (mg) 0.90** 0.48* Vit B12 (μg) 0.87** 0.79** Vit C (mg) 0.59** 0.64** Ca (mg) 0.60** 0.56** P (mg) 0.73** 0.70** Fe (mg) 0.61** 0.58** Cholesterol (mg) 0.83** 0.80** Dietary fiber (g) 0.60** 0.56** **p<0.01; *p<0.05
Validity and reproducibility of a meal-based Chinese FFQ 774 Health and History Questionnaire (HHHQ); and the other
was the University of Michigan (UM) FFQ; and both showed high correlations on most nutrients, but the UM FFQ produced overestimates for energy and all nutrients examined.29 Bingham in UK have reported that in com-parisons to weighted records and various biological mark-ers, among 7-day estimated records, 24-hour recall and a food frequency questionnaire, FFQ did not yield better assessment than repeated food diaries.30 Our data showed that in comparison to 7-day food records, the relative va-lidity of the Chinese FFQv2 versus 24-hour recalls was lower. Only carbohydrate (r=0.35), vitamin B1 (r=0.33), calcium (r=0.28) and dietary fiber (r=0.33) had significant correlations between the Chinese FFQv2 and 24-hour recalls (p<0.05). When one outlier consumed more than 10,000 kcal from the first Chinese FFQv2 and was elimi-nated from the final analyses, the Chinese FFQv2 still showed strong correlations of macro- and micronutrients with 7-day records (n=60, r=0.29-0.50, p<0.05), but not with 24-hr recalls (n=60, r=0.01-0.23, p>0.05). The large day-to-day variation by one day 24-hour recall would attenuate the correlations. Those correlations with good strength demonstrate this Chinese FFQv2 has strong rela-tive validity compared to two other dietary assessment methods, especially 7-day food records.
The reproducibility of the FFQ for assessing usual mean intakes depends on the time frame of the method as well as the time lag of the method.31 The reproducibility of this Chinese FFQv2 was consistently high for most nutrients, with Spearman correction coefficients between 0.42 for vitamin A to 0.79 for vitamin B12, with an aver-age time interval of 7.5 months. In the Netherlands, van Staveren32 found there was a good overall agreement be-tween the two repeated questionnaires. However, for weekend days, precision was poorer, especially for satu-rated fat, carbohydrate, and linoleic acid, because of greater dietary variability during weekends. In a case-control study on breast cancer in a group of Caucasian and Japanese-Hawaiian women, a quantitative FFQ was repeated after 3 months. Amounts of food consumed were estimated using photographs for each food, shown in three serving sizes (small, medium and large). Mean in-takes of selective nutrients for all subjects on the two oc-casions were not significantly different, as tested by the paired t-test .32 Willett and coworkers in 1985 investi-gated the validity and precision of the semi-quantitative FFQ on 173 female registered nurses designed to estimate food intake. 33 For the reproducibility study, there was a time lapse of one year; and for the validity study, it was during a one-year period. They compared nutrient intake scores derived from the FFQ with those estimated from one-week records. Portion sizes of 99 foods were speci-fied using household measures. The results showed that mean daily nutrient intakes were similar from the two FFQ administrations.
Willett and colleagues have developed a semi-quantitative type of FFQ since the 1980's, an FFQ with only two components: a food list and a frequency section. The food items selected in the food list have three general characteristics: first, the food must be used often by an appreciable number of individuals; second, the food must have a substantial content of nutrients; and third, the use
of the food must vary from person-to-person in order to be discriminating.33 The researchers and dietitians used several approaches to compile a food list, including iden-tifying the foods that contain substantial amounts of the nutrients of interest, using stepwise regression to reduce the list by finding major nutrient contributors, and using open-ended data.33 However, learning from experiences, they suggested the method of identifying food simply on the basis of their contribution to absolute intake might not lead to an optimal questionnaire. Foods such as mush-rooms, eggplants, and turnips (such as daikon), although they are not abundant in known essential nutrients, are consumed in large amounts by some individuals. For the Chinese diet in Taiwan, Lee34 and Pan35 have published two articles documenting the major food contributors to macro- and micronutrients from the first National Nutri-tion Survey that collected household food inventory in-formation from 1980-1981. Furthermore, a 64-item Chi-nese food frequency questionnaire combined with open questions on staple and cooking oil was tested the repro-ducibility and validity by Lee et al.36
The adjustment and calibration factors relating the questionnaire format and content need to be developed to allow the investigator to use shorter or modified ques-tionnaires while obtaining nutrient values nearer the cor-rect absolute values.37 Our developmental experiences with three versions of the Chinese FFQ in Taiwan mainly were from observations of meal patterns of urban popula-tions. Pan and colleagues suggested considering addi-tional questions about cooking methods and incorporation of fat-modified foods.38 A example of shortening the FFQ was demonstrated by the Block questionnaire.11 The study showed comparable results from long and reduced ver-sions of the FFQ. The food items were reduced from 98 to 60, and required as short as 17 minutes to be administered by an interviewer. This reduced version of the question-naire provided lower values of macronutrients, but most micronutrients were not underestimated. Our first version of the Chinese FFQ had 482 food items and took each interviewer approximately 1.5 to 2 hours to complete. The Chinese FFQv2 of 217 items took about one hour, and the current, third version of 172 items without portion selec-tions took about 30 minutes by personal interviews. Through comparisons of meal distributions of macronu-trients, we recognized that the Chinese FFQv2 overesti-mated fat and protein consumption, and underestioveresti-mated carbohydrate intake, therefore more attention will be paid to this issue in the development of future versions. In ad-dition, the reduction of food items of this Chinese FFQ relied on past experience and other adjustment factors including geographic variation, ethnic factors, purpose and hypothesis for the specific study, will be considered in the further development of the Chinese FFQ in Taiwan.
ACKNOWLEDGEMENTS
This project was funded by Taiwan National Science Council grant 89-2320-B-003-002. We thank the participating subjects, graduate students and interviewers for completing this project.
AUTHOR DISCLOSURES
Li-Ching Lyu, Chi-Fen Lin, Fang-Hsin Chang, Heng-Fei Chen, Chiao-Chen Lo and Hong-Fa Ho, no conflicts of interest.
775 LC Lyu, CF Lin, FH Chang, HF Chen, CC Lo and HF Ho
REFERENCES
1. Bingham SA. Dietary assessments in the European pro-spective study of diet and cancer. Europ J Cancer Prev. 1997;6:118-24.
2. Lichtenstein A. Trans fatty acids, blood lipids ad cardio-vascular risk: where do we stand? Nutrition Reviews. 1993;51:340-343.
3. Hannan MT, Tucker KL, Dawson-Hughes B, Cupples LA, Felson DT, Kiel DP. Effect of dietary protein on bone loss in elderly men and women: the Framingham Osteoporosis Study. J Bone & Mineral Research. 2000;15:2504-12. 4. Cumming RG,Mitchell P, Smith W. Dietary sodium intake
and cataract: the Blue Mountains Eye Study. Am J Epide-miol. 2000;151:624-6.
5. Karter AJ, Mayer-Davis EJ, Selby JV, D’Agostino RB Jr, Haffner SM, Sholinsky P, Bergman R, Saad MF, Hamman RF. Insulin sensitivity and abdominal obestiy in African-American, Hispanic, and Non-Hispanic white men and women. Diabetes. 1996;45:1547-1555.
6. Czeizel AE. Folic acid in the prevention of neural tube defects. J Pediatric Gastroenterology ﹠Nutrition. 1995;14: 116-123.
7. Langseth L. Nutrititional epidemiology: possibilities and limitations,pp.1-36. ILSI Europe,1996.
8. Burke BS. The dietary history as a tool in research. J Am Diet Assc. 1947;23:1041-6.
9. Heady JA. Diets of bank clerks: Development of a method of classifying the diets of individuals for use in epidemi-ologic studies. J Sta Soc. 1961;124:336-361.
10. Hankin JH, Stallones RA, Messinger HB. A short dietary method for epidemiology studies. Am J Epidemiol. 1968;87:285-298.
11. Block G, Hartman Am, Naughton D. A reduced dietary questionnaire: development and validation. Epdimiology. 1990;1:58-64.
12. Lopez-Cariillo L, Hernandez Avila M, Dubrow R. Chili pepper consumption and gastric cancer in Mexico: a case-control study. Am J Epidemiol. 1994;139:263-271. 13. Goldbohm RA, Van Den Brandt PA, Brants HAM, Veer
PVT, Sturmans F, Hermus RJJ. A self-administratered questionnaire to assess dietary habits in a cohort study on diet and cancer. In: The diet history method. Proceeding of the 2nd Berlin meeting on nutritional epidemiology (edited by Kohlmeier L). Smith Gordon and Company Limited, London, 1989.
14. Ji BT, Chow WH, Yang G, McLaughlin JK, Zeng W, Chu XO, Jin F, Gao RN, Gao YT, Fraumeni JF Jr. Dietary hab-its an stomach cancer in Shanghai, China. Int J Cancer. 1998;76:659-64.
15. Baghust K, Hagman U. New dietary history methods and their use in epidemiological studies: a workshop report. In: The diet history method. Proceeding of the 2nd Berlin meet-ing on nutritional epidemiology (edited by Kohlmeier L). Smith Gordon and Company Limited, London, 1989. 16. Lyu L-C, Hsu C-Y, Yeh C-Y, Lee M-S, Huang S-H, Chen
C-L. A case-control study of the association of diet and obesity with gout in Taiwan. Am J Clin Nutr. 2003;78:690-700.
17. Lyu L-C, Huang S-H, Hsu C-Y, Lee M-S, Lin S-H. Interre-lationships of nutrient intakes for urban Chinese in Taiwan. Int J Food Sci & Nutr. 2004;55(3):227-236.
18. LyuL-C, Ya-Ping YuY-P, Jung-Sheng Lee J-S, LinJ-H, Wang H-I. Food and nutrient intakes for families in Taipei, Taiwan. J Food Compost Anal 2006,19:S22-S30.
19. Lyu L-C, Ho J-Y, Chang F-H, Hsu I-L. An integrated data-base management system for Taiwanese food compostion
and related dietary assessment databases: NUFOOD system. (In Chinese). Nutr Sci J. 2001;26:268-276.
20. Gibson RS. Principles of nutritional assessment, pp.37-51, 85-132. Oxford Press, New York, 1990.
21. Block G, Coyle LM, Hartman Am, Scoppa SM. Revision of dietary analysis software for the Health Habits and His-tory Questionnaire. Am J Epidemiol. 1994;139:1190-6. 22. Hankin JH, Nomura AMY, Lee J. Reproducibility of a diet
history questionnaire in a case-control study of breast can-cer. Am J Clin Nutr. 1983;37:981-85.
23. Hankin JH, Wilkens LR, Kolonel LN, Yoshizawa CN. Validation of a quantitative diet history method in Hawaii. Am J Epidemiol. 1991;133:616-28.
24. O'Donnell M, Wise PH, Nelson M. Automated nutritional feedback. Development and validation of a questionnaire-based system. In: The diet history method. Proceeding of the 2nd Berlin meeting on nutritional epidemiology (edited by Kohlmeier L). Smith Gordon and Company Limited, London, 1989.
25. Wheeler C, Rutishauser I, Conn J, Odea K. Reproducibility of a meal-based food frequency questionnaire. The influ-ence of format and time interval between questionnaires. European J Clin Nutr. 1994;48:795-809.
26. Fregapane G, Asensio-Garcia C. Dietary assessment of an educated young Spanish population using a self-administrated meal-based food frequency questionnaire. European J Epidemiol. 2000;16:183-91.
27. Oster M, Heitmann BL, The validity of a short food fre-quency questionnaire and its ability to measure changes in food intake: a longitudinal study. Int J Epidemiol. 1996;25: 1442-4.
28. Flagg WE, Coates RJ, Calle EE, Potischman N, Tun MJ. Validation of the American Cancer Society cancer Preven-tion Study II NutriPreven-tion Survey Cohort Food Frequency Questionnaire. Epidemiology. 2000;11:462-468.
29. Block G, Thompson FE, Hartman Am, Larkin FA, Guire KE. Comparison of two dietary questionnaires validated against multiple dietary records collected during a 1-year period. J Am Diet Asso. 1992;92:686-93.
30. Bingham SA, Gill C, Welch A, Cassidy A, Runswick SA, Oakes S, Lubin R, Thurnham DI, Key TJ, Roe L, Khaw KT, Day NE. Validation of dietary assessment methods in the UK arm of EPIC using weighed records, and 24-hour uri-nary nitrogen and potassium and serum vitamin C and ca-rotenoids as biomarkes. Int J Epidemiology. 1997;26 Suppl 1:S137-51.
31. Willett WC. Nutritional Epidemiology. pp.69-91. Oxford University Press, New York, 1990.
32. Van Staveren WA, de Boer JO, Burema J. Validity and reproducibility of a dietary history method estimating the usual food intake during one month. Am J Clin Nutr. 1985; 42:554-559.
33. Willett WC, Sampson L, Stampfer MJ, Rosner B, Bain C, Witschi J, Hennekens CH, Speizer FE. Reproducibilty and validity of a semiquantitative food frequency questionnaire. Am J Epidemiol. 1985;122:51-65.
34. Lee MM, Pan WH, Yu SL, Huang PC. Foods predictive of nutrient intake in Chinese diet in Taiwan: I. Total calories, protein, fat and fatty acids. In J Epidemiol. 1992;21:922-8. 35. Pan WH, Lee MM, Yu SL, Huang PC. Food predictive of
nutrient intake in Chinese diet in Taiwan: II. Vitamin A, vitmain B1, vitamin B2, vitamin C and calcium. Int J Epi-demiol. 1992;21:929-34.
36. Lee M-S, Pan W-H, Liu K-L, Yu M-S. Reproducibility and validity of a Chinese food frequency questionnaire used in Taiwan. Asia Pac J Clin Nutr. 2006;15:161-169.
Validity and reproducibility of a meal-based Chinese FFQ 776 37. Harlan LC, Block G. Use of adjustment factors with a brief
food frequency questionnaire to obtain nutrient valuse. Epi-demiology. 1990;1:224-31.
38. Pan WH, Wang HL, Chang SC, Chen ML. Cooking oil absorption by foods during Chinese stir-frying: implication for estimating dietary fat intake. J Am Diet Asso. 1993;93: 1442-4.
Original Article
Meal distribution, relative validity and reproducibility
of a meal-based food frequency questionnaire in
Taiwan
Li-Ching Lyu
PhD1, Chi-Fen Lin
BS1, Fang-Hsin Chang
BS1, Heng-Fei Chen
MS1,
Chiao-Chen Lo
MS1and Hong-Fa Ho
PhD21
Department of Human Development and Family Studies, National Taiwan Normal University, Taipei, Taiwan
2
Department of Industrial Education, National Taiwan Normal University, Taipei, Taiwan