Chapter 3 Research Methodology
In this chapter, the overall design of the present study will be reported. The organization of this chapter is as follows. Section 3.1 presents the research design of the study. Section 3.2 describes the participants. The procedure of the present investigation is addressed in Section 3.3. Section 3.4 describes the research tools.
The information about lecture video, course supporting website, instruments, achievement test, questionnaire, system and tool is reported. Finally, the IP lab pack is detailed in Section 3.5.
3.1 Research Design
This study proposes a pre-class video viewing of the lecture content plus in-class supervised laboratory work as a model to teaching Computer Science concepts for high school students. The purposes are to investigate students’ learning achievements, students’ attitudes, and students’ characteristics of video frequent users and nonusers.
Quasi-experiments on teaching image processing concepts at two local high schools have been conducted. The independent variable included learning model (lecture video plus lab, traditional lecture plus lab, and control). The dependent variables were learning achievement of image processing, and students’ attitudes. The control variables included instructors, learning content, and the time duration of in-class teaching and learning.
3.2 Participants
This study was conducted at two high schools. One school was located in the
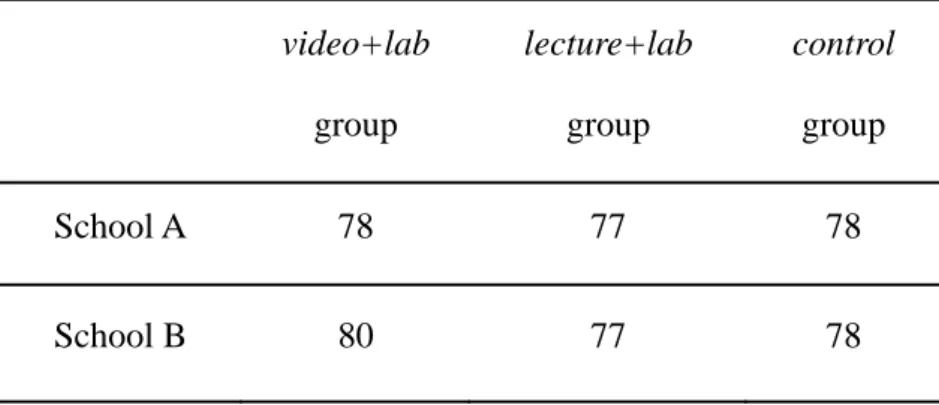
system in Taiwan favors the enrollment of students in different schools on the basis of their scores in the high-school entrance exam. In this study, students in school A had scored only in the top 60 percentile, whereas students in school B had scored in the top 20 percentile in the high-school entrance exam. The two schools were chosen to test how the proposed learning model affects students of different prior learning achievements. Between-school comparison was not the focus of this study. Six classes were randomly chosen for the experiment from each school. Of the six classes, two classes each were designated as experimental group 1, experimental group 2, and the control group. Students in the experimental group 1 (video+lab group) watched lecture videos before class and used the class time for lab exercises. Students in the experimental group 2 (lecture+lab group) received in-class lectures (the same content as in the lecture videos) and carried out lab exercises in class. The control group received the usual expanded lectures in class. The number of students in each group is depicted in Table 3.1.
Table 3.1 Number of students participated in the study.
video+lab group
lecture+lab group
control
group
School A 78 77 78
School B 80 77 78
3.3 Procedure
Our teaching-and-learning model requires the participating high-school teachers to study the handwritten numeral-recognition lab pack up to the level where they are comfortable teaching it. The teachers then would either lecture in class or make
pre-recorded lecture videos for the different groups of students in this study. The learning process of the students consists of two phases. First, students learn about the basic concepts through in-class lecture or by watching the pre-recorded lecture videos before the class to gain basic IP knowledge. Second, students work on the lab exercises in class to reinforce the concepts that have been learned before and build their own handwritten numeral recognizer. Thus, instead of the traditional in-class lectures, the new model has the experimental group of students carrying out pre-class study plus in-class supervised lab work.
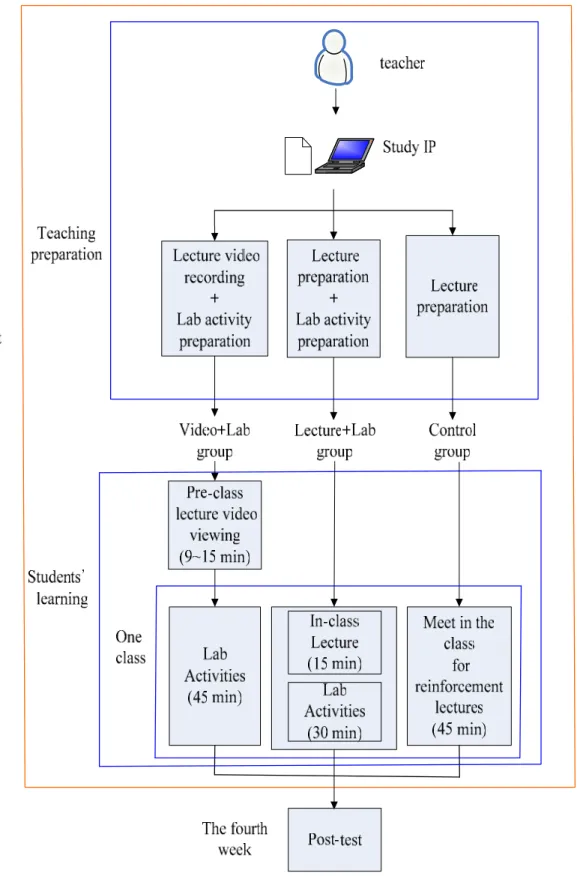
The teaching-experiment procedure is outlined in Figure 3.1. One week before the experiment, the instructor took time to demonstrate the procedure for on-line viewing of lecture videos to the students in the video+lab group. The video+lab group students were asked to view these videos before each class for the duration of the experiment.
The pre-class video viewing time for students in school A is between 9 to 11 minutes, whereas video viewing time for students in school B is between 13 to 15 minutes.
Each class was conducted for one hour per week. The experiment lasted four weeks. For the first three weeks, all three groups learned about IP, albeit in different ways. Each week, students in the video+lab group watched the pre-recorded lecture videos before class (between 9 and 15 minutes) and worked on lab exercise in-class for about 45 minutes. This group has no need for in-class lecture as the lecture was replaced by pre-class video viewing. Students in the lecture+lab group received their lecture in-class for about 15 minutes and then worked on the lab exercise for about 30 minutes.
As for the control group, the class consisted of 45 minutes of lectures. In the fourth week, all three groups took the same post-experiment achievement test. Table 3.2 summarizes the time duration of the learning activities for each of the three groups.
Figure 3.1. The teaching experiment procedure.
Table 3.2. The time duration of the learning activities for each of the three groups.
Group video+lab
group
lecture+lab group
control group
Pre-class video viewing
school A: 9~11 min school B: 13~15 min
0 0
In-class lecture 0 15 45
Time (min)
In-class lab 45 30 0
3.4 Research Tools
The research tools used in this study included IP lab pack, lecture video, course supporting website, instruments, achievement test, and student questionnaire. Except IP lab pack will be introduced in the latter section, other tools were described as followings.
3.4.1 Lecture Video
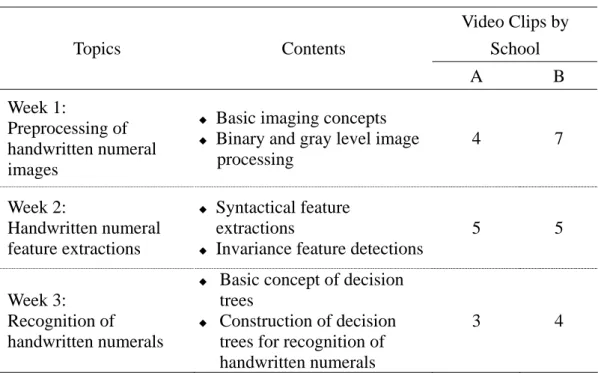
The topic taught during the experiment was handwritten numeral recognition. The lectures were divided into three subtopics: preprocessing of handwritten numeral images, feature extractions, and recognition through decision trees. For each subtopic, various IP techniques were detailed, as outlined in Table 3.3.
With the help of a college professor, whose major research area is in IP, and two high school CS teachers, one sample lecture video designed by the researcher was provided to the two participated high school teachers. They then re-recorded the
lecture video for the video+lab group considering their students’ background in image processing. Because the students were expected to enhance their learning through in-class lab experiments, the lecture materials were greatly condensed. Thus, all the recorded video clips were between two and four minutes long. In addition, there were some individual differences in the lecturing styles between the two teachers, which led to different numbers of recorded lecture-video clips. In all, 12 and 16 video clips were recorded by the teachers from schools A and B, respectively. As a consequence, the time required to view the lecture videos before class for students in school A and school B were between 9 and 11 minutes, and between 13 and 15 minutes, respectively, over the three week period. The lecture-video clips were all made available on the in-house course-supporting website. For the lecture+lab group, the teachers lectured in class on the same topics and contents as that in the video+lab group. However, the lecture contents for the control group were in expanded form so as to stretch through the entire lecturing period because there were no lab experiments for that group.
Table 3.3. Topics covered each week.
Video Clips by School Topics Contents
A B Week 1:
Preprocessing of handwritten numeral images
Basic imaging concepts
Binary and gray level image processing
4 7
Week 2:
Handwritten numeral feature extractions
Syntactical feature extractions
Invariance feature detections
5 5
Week 3:
Recognition of handwritten numerals
Basic concept of decision trees
Construction of decision trees for recognition of handwritten numerals
3 4
3.4.2 Course Supporting Website
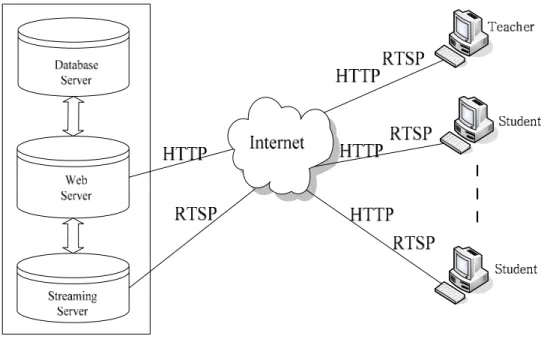
An in-house course-supporting website was developed that contained the lecture videos, the presentation slides, the course handouts, and a discussion forum. By accessing the course-supporting website, students could watch the lecture video before class. As shown in Figure 3.2, the architecture of the system consists of three servers, namely web server, database server and streaming server. The various web server application modules access the data stored in the database server, and interact with the users through the HTTP protocol and the browser. Meanwhile, the web server also access the video stored in the streaming server and broadcast the video to the browser through the RTSP (Real Time Streaming Protocol) protocol.
Figure 3.2. The architecture of the course supporting website.
A snapshot of the course website is depicted in Figure 3.3. The screen was divided
into four frames: the video-playback frame, the main frame, the discussion-thread frame, and the lecture-slides frame. The lecture-slides frame contained the set of slides used for one class. Each slide also had a corresponding beginning and finishing time in the recorded lecture video. When clicked upon, that slide was enlarged and displayed in the main frame, the corresponding lecture segment was played in the video-playback frame, and the corresponding discussion thread was displayed in the discussion-thread frame.
Therefore, students were able to simultaneously watch and listen to the lecture corresponding to a particular slide, while being able to discuss about it at the same time.
The website automatically kept track of the usage statistics, including the number of times each video segment was viewed by each student. The course-supporting website was only available to students in the video+lab group. A more detailed description of the system can be found in Lee and Tsai (2002).
Figure 3.3. Snapshot of course supporting website.
Figure 3.3. Snapshot of the course website.
The lecture slides frame
The video playback frame The main frame
The discussion thread frame
3.4.3 Instruments
3.4.3.1 Application-specific Self-efficacy Scale and Learning Motivation Scale
Two instruments (see Appendix A) were administered to video+lab group before the experiment. One is application-specific self-efficacy adapted from Marakas, Yi, and Johnson (2002). Meanwhile, learning motivation was measured with themastery goals and performance goals developed by Harackiewicz, Barron, Tauer, Carter, &
Elliot, (2000). Application-specific self-efficacy includes 6 questions. Both the mastery and performance goals include six questions each. The responses of these instruments can range from “strongly disagree” (1) to “strongly agree” (5). These questions were translated into Chinese and were piloted with 41 senior high school students. The responses from these students were used to calculate the internal reliability of the questionnaire. The Cronbach’s alpha coefficients of the application-specific self-efficacy, mastery goals and performance goals were 0.86, 0.83 and 0.81, respectively. Furthermore, students were also asked to rate their accessibility to the Internet. The reply can range from “very convenient” (rating = 5) to “very inconvenient” (rating = 1).
3.4.3.2 Students Questionnaire
The two questionnaires, one for video+lab group (see Appendix B) and the other for lecture+lab group (see Appendix C), were designed to obtain the participants’
attitudes and suggestions on the lecture video plus lab learning model and lab based
learning model. The students were asked to respond to each statement on a 5-point scale: from “strongly disagree” (1) to “strongly agree” (5).
3.4.4 Achievement Test
An achievement test (see Appendix D) was developed in association with this research. The achievement test was a written exam that contained four types of questions: true or false, multiple choice, matching, and fill-in-the-blanks. The true/false and multiple-choice questions were designed to measure the basic understanding of the handwritten numeral-recognition preprocessing method and the feature-extraction concepts. The numbers of true/false and multiple-choice questions are 11 and 8, respectively. The matching and fill-in-the-blanks questions tested the students’
understanding of the decision tree–construction process. The numbers of matching and fill-in-the-blanks questions are 10 and 8, respectively. The maximum score of the achievement test was 100 points. The KR-20 coefficient values for the achievement test in school A and school B were 0.73 and 0.75, respectively. The questions of achievement test were also reviewed by two domain experts.
3.5 The IP Lab Pack
With the help of the college professor, an IP lab pack for high-school use has been developed in preparation for this study. The lab pack contained lab worksheets (see Appendix E to G), notes (see Appendix H to J) and software tools for designing a handwritten numeral-recognition system. The lab worksheets provided students with procedures along with associated questions that elicited thoughtful responses. The
accompanying software tool was used by the students to carry out the lab experiments.
Two software tools were designed to facilitate students’ image processing learning.
The handwritten numerals recognized in these two software tools are the ten Arabic numerals from 0 to 9. The two tools are explained below.
1. DIPFeature
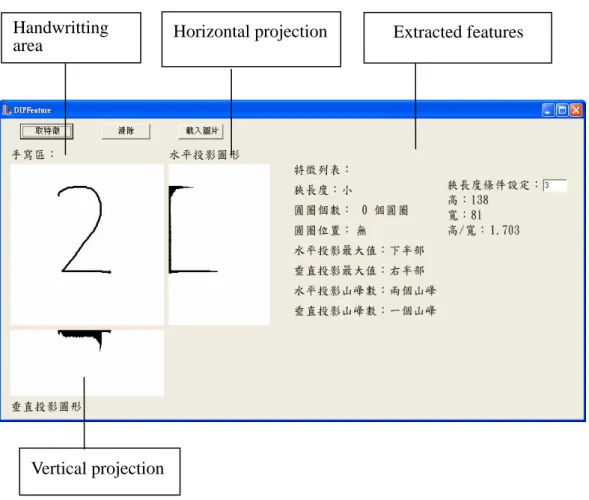
DIPFeature is a handwritten numeral feature extraction tool shown in Figure 3.4.
The purpose of DIPFeature is to let students observe and understand different features of handwritten numeral through hands-on activities. Seven features usually used for computer handwritten numeral recognition are available in the DIPFeature.
A) Ratio of height to width
The height and width of the handwritten numeral are two important features for handwritten numeral recognition. Dividing the height by the width yields the ratio of height to width. Students are allowed to determine the threshold of ratio of height to width in DIPFeature. Therefore, the handwritten numeral will be classified into the category of small ratio or large ratio.
B) Number of circles
The number of circles in the handwritten numeral indicates closed area in the number of writing. In DIPfeature, one handwritten numeral may be classified as having zero, one, or two circles.
C) Position of circle
This feature is designed for the handwritten numerals having one circle. The position of the circle is categorized as being in the upper, middle, or lower part of the numeral.
D) Position of the maximum value in the horizontal projection
The position of the maximum value of horizontal projection is either in left or
E) Position of the maximum value in the vertical projection
The position of the maximum value of vertical projection is either in upper or lower half of the gray scale of the handwritten numeral.
F.) Number of peaks in the horizontal projection
A peak in the projection is a relative high value in the projection. In DIPFeature, one handwritten numeral might be recognized as having one, two, three, or four and above peaks in the horizontal projection.
G.) Number of peaks in the vertical projection
Similar to the number of peaks in the horizontal projection, one handwritten numeral might be recognized as having one, two, three, or four and above peaks in the vertical projection.
As showed in Figure 3.4, students can write down one single digit number in the handwritting area, and observe the values of the seven features. Figures of horizontal projection and vertical projection are depicted. Furthermore, the seven features are shown text to the right of the image.
Figure 3.4. Snapshot of handwritten numeral feature extraction tool (DIPFeature).
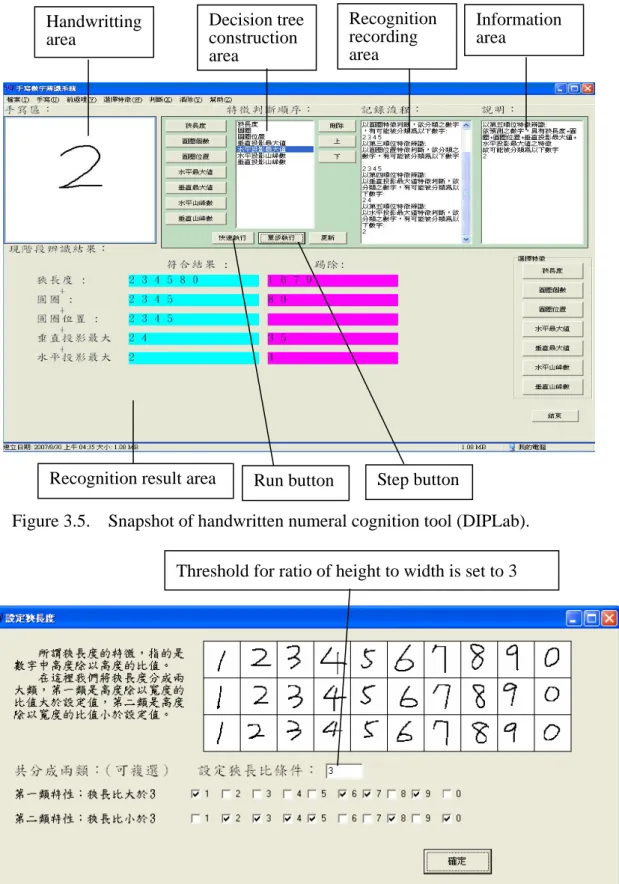
2. DIPLab
Figure 3.5 shows the snapshot of handwritten numeral recognition tool named DIPLab. The screen was divided into five areas: the handwritten area, the decision tree construction area, the recognition recording area, the information area, and the recognition result area. Students can write down one numeral in handwritten area for recognition. The order of features in decision tree is arranged in the decision tree construction area. The recognition result area depicts the results in each step of recognition processing. The corresponding explanation of the recognition process is showed in the recognition recording area for detailed review. The information area shows the information of the feature’s property and the recognition result in the current
Handwritting
area Horizontal projection Extracted features
Vertical projection
recognition process. Therefore, students are able to observe the recognition process, while being able to think about it at the same time.
Students can realize the complete procedures of handwritten numeral recognition by completing the four steps in DIPLab.
A) Input one handwritten numeral:
Students can write down one numeral in the handwritten area or load one image file of handwritten numeral into DIPLab.
B) Preprocessing handwritten numeral image:
This step includes binary and gray level image processing.
C) Handwritten numeral features extraction:
Students decide the threshold value for feature extraction in this step. As shown in Figure 3.6, the threshold for ratio of height to width is set to 3.
D) Construction of decision tree for recognition of handwritten numerals:
Students determine the order of feature recognition in decision tree for handwritten numeral recognition. As revealed in Figure 3.5, the order of feature recognition is as follows: ratio of height to width, number of circles, position of circle, position of the maximum value in the vertical projection, position of the maximum value in the horizontal projection, number of peaks in the horizontal projection, and number of peaks in the vertical projection. After constructing the decision tree, students use the “Step” button to execute the recognition step by step, or use the “Run” button to execute the whole recognition process. The results of each feature recognition process are shown in recognition result area.
By changing the order of decision steps in the decision tree, students can observe and compare different recognition results.
The IP lab pack also contained worksheets for hands-on activities. The problems on the worksheets are designed to encourage the students to think about the significance of the changing parameter(s) before their actual experimentation with the software tool.
Because each student could experiment with different features and parameters, no two recognizers would have the same recognition performance. Thus, the teacher can encourage the students to experiment and build different recognition systems. In this study, three worksheets were designed to be used in experiments:
Each lab experiment was designed to reinforce specific concepts taught in the lecture videos or in class. Students practiced the previously learnt concepts by changing the parameters to the IP operators and then observed the results. Each week, the lab work takes the students one step closer to the completion of a handwritten numeral-recognition system.
Figure 3.5. Snapshot of handwritten numeral cognition tool (DIPLab).
Figure 3.6. Snapshot of setting up the threshold for feature extraction.
Recognition result area
Recognition recording area
Information area
Handwritting area
Decision tree construction area
Threshold for ratio of height to width is set to 3 Run button Step button