Research Express@NCKU - Articles Digest
Research Express@NCKU Volume 20 Issue 1 - October 7, 2011 [ http://research.ncku.edu.tw/re/articles/e/20111007/2.html ]
New Capability Indices for Evaluating the Performance
of Multivariate Manufacturing Processes
Jeh-Nan Pan
1,*and Chun-Yi Lee
2Professor and Associate Dean of Department of Statistics, College of Management, National Cheng Kung University1
Asistant Professor of Department of Applied Mathematics, National Chiayi University2
Quality and Reliability Engineering International, 26 (1), pp. 3-15, February 2010
G
enerally, the quality of an industrial product has a least two correlated qualitycharacteristics. In order to establish performance measures for evaluating the capability of a multivariate manufacturing process, several multivariate process capability indices have
been developed in the past few years. Among them, Taam’s MCp and MCpm indices have
the drawback of overestimation and Hubele’s three-component index lacks simplicity in practice. Assuming the manufacturing process follows a multivariate normal distribution,
we prove that the calculation of the MCp index proposed by Taam et al. (1993) can be
simplified to
where ρ is a correlation matrix. Since the value of MCp index will be greater than 1 if the quality characteristics are not independent and it will cause an overestimation of the true process performance, we then revise Taam’s modified engineering tolerance region based on the assumption that the correlation of multiple quality
characteristics is consistent with the correlation among specifications. The relationship between Taam’s modified engineering tolerance region (the regular one) and our revised engineering tolerance region (the slant one) for a process with a bivariate quality characteristic is illustrated in Figure 1.
To overcome the drawback of overestimation using the MCp and MCpm indices, a revised engineering tolerance
region is proposed as below
where the elements of matrix A* are given by
T is the target vector, ρij represents the correlation coefficient between the ith and jth quality characteristics and (USLi - LSLi) denotes the ith specification width for each side of rectangle circumscribed to the ellipsoid E
d,A*,T.
Similar to MCpm ratio of the two volumes, our proposed multivariate process capability index can be defined as
Research Express@NCKU - Articles Digest
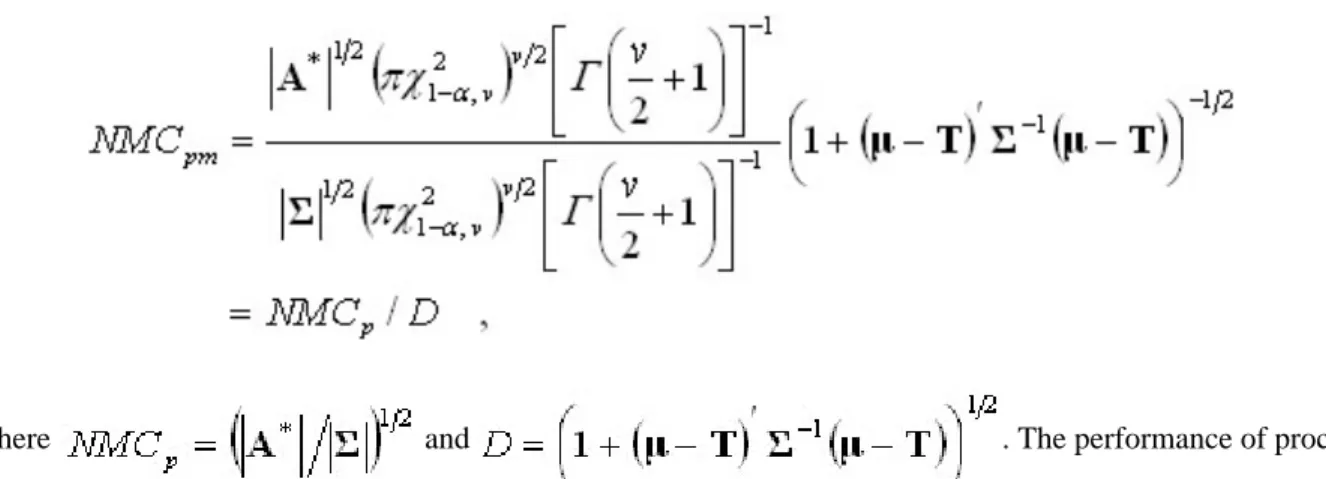
If , then the NMCpm index can be written as
where and . The performance of process
precision and accuracy for a multivariate manufacturing process can easily be understood by using our proposed multivariate process capability indices.
The following numerical example demonstrates the usefulness of our proposed NMCp and NMCpm capability
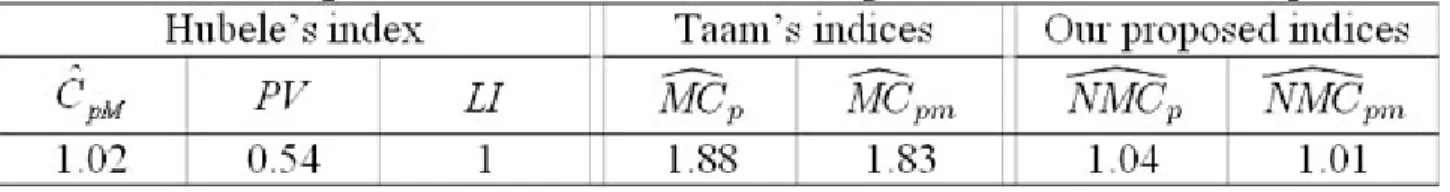
indices. Sultan (1986) discussed an example of 25 collected measurements in which the Brinell hardness (H) and tensile strength (S) are two quality characteristics for an industrial product. The engineering tolerances for H and S are given by (112.7, 241.3) and (32.7, 73.3) respectively and the target vector of H and S is T'=[177,53]. The comparison results of using various multivariate process indices for estimating the performance of an industrial product are summarized in Table 1. Since the estimated conforming rate for this example is 99.91% under the assumption of multivariate normality for the underlying process distribution and both our proposed indices
=1.04 and =1.01 are nearly equal to 1, which indicates that the 99.73% process region is
close to the 99.73% revised engineering tolerance region and the process mean is close to the target. The 95% confidence intervals for the NMCp and NMCpm indices are [0.63, 1.44] and [0.63, 1.41] respectively. Thus, the true
process performance can correctly reflected by our proposed indices and by taking the
correlation among multiple quality characteristics into account, i.e. the process is capable.
Figure 1 Relationship between Taam’s modified region and our revised engineering tolerance region
Research Express@NCKU - Articles Digest
Table 1. Comparison of various multivariate process indices for example