Dividend policy and the life cycle hypothesis:
Evidence from the Taiwan Stock Exchange
Ming-Hui Wanga , Day-Yang Liua, Yen-Sheng Huangb,*
a Graduate Institute of Finance
National Taiwan University of Science and Technology 43, Sec.4, Keelung Rd., Taipei, 106, Taiwan, R.O.C.
b Department of Business and Management, Ming Chi University of Technology
84, Gungjuan Rd., Taishan, Taipei, 24301, Taiwan, R.O.C.
Abstract
This paper examines the dividend policy for firms listed on the Taiwan Stock Exchange and test the life cycle hypothesis. The sample involves 6031 observations of dividend payments over the 16-year period 1992-2007.
Consistent with the prediction of the life cycle hypothesis, the results indicate that dividend payers (cash dividends, stock dividends, or both) are associated with higher profitability, higher asset growth rate, and higher market-to-book ratio than non-payers. The median return on assets (ROA) is 7.03% for dividend payers and -0.93% for non-payers. Similarly, the median market-to-book ratio is 1.69 for dividend payers as opposed to 0.80 for non-payers.
Moreover, the results indicate that stock-dividend payers are associated with higher asset growth rate, but lower ratio of retained earnings to total equity than those for cash-dividend payers. In particular, stock-dividend payers are associated with higher asset growth rate and lower return on assets, lower retained to total equity ratio than those for cash-dividend payers. These results are consistent with the life cycle hypothesis of dividend payment in that younger firms with higher growth potential but lower profitability tend to distribute more stock dividends than cash dividends. When firms become more mature as characterized by lower growth potential but higher profitability tend to distribute more cash dividends as opposed to stock dividends.
Keywords: dividend policy, cash dividend, stock dividend, life cycle hypothesis
Dividend Policy and the life cycle hypothesis: Evidence from the Taiwan Stock Exchange
1. Introduction
Ever since Miller and Modigliani (1961) published their pioneering article on dividend policy, numerous theoretic and empirical studies have examined this important issue. Empirical evidence suggests that a firm’s dividend policy may depend on the stage of the firm’s life cycle. For example, younger firms with higher growth opportunities but lower profitability may distribute less cash dividends. In contrast, mature firms with higher profitability but lower growth opportunities may distribute more cash dividends. The past two decades have witnessed drastic changes in dividend policy among industrial firms. Fama and French (2001) report a significant decline in the proportion of United States industrial firms that pay cash dividends in the period 1978-99. They note that such changes in dividend policy are related to changing characteristics of these publicly traded firms. DeAngelo et al. (2006) propose that changes in dividend policy of publicly traded industrial firms in the United States are consistent with the prediction of the life cycle hypothesis.
The purpose of this paper is to examine dividend policy for industrial firms listed on the Taiwan Stock Exchange over the period 1992-2007. In particular, we examine whether the dividend policy of Taiwan’s industrial firms are consistent with the prediction of the life cycle hypothesis. We first examine the pattern of dividend payments for industrial firms listed on the Taiwan Stock Exchange over the sample period. That is, we examine if there is any change in the proportion between dividend payers and non-payers? Moreover, since both stock dividends and cash dividends are quite common for firms listed on the Taiwan Stock Exchange, we examine whether dividend payers change their choice between stock dividends and cash dividends in the sample period.
Finally, we examine whether the choice between stock dividends and cash dividends is consistent with the prediction of the life cycle hypothesis.
Unlike the United States firms which distributed mainly cash dividends in the past two decades, industrial firms listed on the Taiwan Stock Exchange declared more stock dividends than cash dividends especially in the early years of 1990s.
Moreover, stock dividends appear to be more common than cash dividends for firms in the high growth industries such as the electronic industry. One plausible explanation for the pattern of more stock dividends than cash dividends is that these firms may be in their youth stage of life cycle as characterized by higher growth opportunity. However, the latter part of the sample period has witnessed a drastic shift from stock dividends to cash dividends for these firms. In addition, the proportion of non-payers has also increased. This change in the dividend policy may be due to the situation that these firms were moving toward a more mature stage of life cycle as characterized by lower growth opportunity.
To test the validity of the life cycle hypothesis of dividend policy, we examine whether the shift in the choice from stock dividends to cash dividends is related to the changing characteristics of listed stocks. Alternatively, the shift in dividend policy could be due to the changing propensity of listed stocks to pay dividends (e.g., Fama and French, 2001). Thus, we examine whether firms that distribute cash dividends are characterized by lower growth opportunity, higher profitability, and large size as compared to those that distribute stock dividends. Following DeAngelo et al., 2006, we also examine whether the earned/contributed capital mix provides a better explanation of the observed dividend changes.
Our data involve 6031 sample observations from stocks listed on the Taiwan Stock Exchange, ranging from 149 industrial firms in 1992 to 619 industrial firms in 2007. Over the sample period 1992-2007, we observe a drastic increase in the proportion of dividend non-payers. Moreover, among dividend payers, we observe a drastic shift from stock dividends to cash dividends. The proportion of dividend non-payers increases from 10.8% in the first half of the sample period to 28.7% in the second half of the sample period. Moreover, for dividend payers, the proportion of firms paying stock dividends decreases from 59.5% in the first half of to 10.6% in the second half of the sample period. In contrast, the corresponding ratio increases from 4.4% to 20.0% for cash dividends. When dividend payments are measured in terms of dollar amount, the results are comparable. The average stock dividend per share decreases by 61% from (New Taiwan Dollar) NT$ 1.30 in the first half of the sample period to NT$ 0.51 in the second half of the sample period. In contrast, the cash dividend per share increases by 172% from NT$ 0.25 to NT$ 0.68 per share.
The results also indicate that dividend payers (cash dividends, stock dividends, or both) are associated with higher profitability, higher asset growth rate, and higher market-to-book ratio than non-payers. The median return on total assets (ROA) is 7.03% for dividend payers and -0.93% for non-payers.
Similarly, the median market-to-book ratio is 1.69 for dividend payers as opposed to 0.80 for non-payers. Moreover, the results indicate that stock- dividend payers are associated with higher asset growth rate, but lower profitability as measured by return on total assets as well as lower retained earnings to total equity ratio than cash-dividend payers. These results are consistent with the prediction of the life cycle hypothesis in that younger firms with higher growth potential but lower profitability tend to distribute more stock dividends than cash dividends. When firms become more mature as characterized by lower growth potential but higher profitability tend to distribute more cash dividends as opposed to stock dividends.
Previous research from the United States financial market documents a
declining pattern of cash dividends (e.g., Fama and French, 2001). In contrast, our empirical evidence indicates an increasing trend of cash dividends but a declining trend for stock dividends in the sample period 1992-2007. Despite the difference in empirical evidence between our empirical results and those derived from the United States financial market, we argue that the pattern of increasing cash dividends and declining stock dividends in the Taiwan stock market is consistent with the prediction of the life cycle hypothesis as suggested in DeAngelo et al. (2006), among others. Moreover, our results indicate that the distribution of stock dividends and/or cash dividends appears to be affected by the long-term profitability as measured by the ratio of retained earnings to total equity, aside from other factors such as the growth opportunity as measured by the asset growth rate (△TA/TA) and the short-term profitability as measured by the return on total assets (ROA).
The plan of this paper is as follow. Section 2 provides a review of relevant literature. Section 3 describes data and methodology. Section 4 reports empirical results. Section 5 concludes this paper.
2. Literature review
Miller and Modigliani (1961) argue that, in a frictionless market, dividend payout policy is irrelevant and that investment policy alone is the only determinant of firm value. In this perfect world, firm value is determined by the net present value of cash flows generated by the investment opportunity unique to a firm. To keep the investment opportunity fixed, Miller and Modigliani (1961) assume a 100% distribution of free cash flow to shareholders in every time period. When the assumptions are relaxed to allow retention, DeAngelo and DeAngelo (2006) argue that dividend payout policy matters in exactly the same way as investment policy does. They suggest that the maximization of firm value requires the payout policy to be optimized
In the real world, financial managers appear to consider dividend policy as a relevant decision. In a survey of 384 financial executives, Brav et al. (2005) report that eighty percent of the financial executives believe that dividend payout policy conveys information to market participants. Moreover, financial managers appear to make the dividend policy in a conservative way. The survey indicates that maintaining the dividend level is of equal importance as investment decisions. For example, 94% of dividend payers strongly agree that they try to avoid reducing dividends. And more than two-thirds of dividend payers state that the stability of future earnings is an important factor affecting dividend payout decisions. For firms that pay no dividends, the financial executives argue that dividend inflexibility make them hesitate to pay cash dividends.
The relevance of dividend policy in the real world can be seen from the changing pattern of dividend payments in the past decades. Fama and French (2001) report a drastic decline in the proportion of United States industrial firms that pay cash dividends in the period 1978-99. They note that both changing firm characteristics and low propensity to pay cash dividends are responsible for the declining cash dividends. On the one hand, newly listed firms tend to be smaller with lower profitability and stronger growth opportunity. These characteristics are typical for firms that never paid cash dividends. On the other hand, even after controlling for firm characteristics, firms have become less likely to pay cash dividends across all groups ranked by size, profitability, and growth opportunity.
Fama and French (2001), Grullon et al. (2002), DeAngelo and DeAngelo (2006), DeAngelo et al. (2006), among others, suggest that dividend policy requires a trade-off between the pros and cons of retention versus distribution of corporate earnings. For example, while retention of earnings provides the benefit of floatation cost savings in funding investment needs, distribution of earnings minimize potential agency costs of free cash flow which is under the discretion of incumbent managers.
The trade-off of retention versus distribution is associated with the life cycle of firms. For firms at their younger stages, retention dominates distribution because younger firms are characterized by smaller size, lower profitability and stronger growth opportunity. As a result, a smaller portion of earnings is more likely to be distributed. For these firms, the benefit of retention outweighs the cost of distribution. In contrast, more mature and established firms are more likely to distribute earnings to shareholders. These firms are characterized by lower investment opportunity, high profitability, and larger firm size. Hence, the cost of retaining earnings (e.g., the agency costs derived from free cash flow) tend to more than offset the benefit of floating cost saving.
Although the life cycle of firms tends to be characterized by investment opportunity, profitability and firm size, DeAngelo et al. (2006) suggest that the earned/contributed capital mix (i.e., the ratio of retained earnings to total equity) provides a better measure of a firm’s life cycle that is relevant to the choice of firms’ dividend payments. They propose that the ratio of retained earnings to total equity is a better measure of long-term profitability and thus is more relevant to the dividend decision. Their empirical evidence indicates that the proportion of industrial firms that pay cash dividends is significantly related to the retained/contributed capital mix even after controlling for the impact of other variables such as firm size, profitability, and growth opportunity.
3. Hypothesis and methodology 3.1 Hypothesis
The life cycle hypothesis proposes that dividend policy is associated with firms’ life cycle. Younger firms with higher growth opportunity but lower profitability tend to retain a larger portion of earnings. For these firms, retention dominates distribution because savings from lower flotation costs more than offset the benefit of lower agency costs from free cash flow. In contrast, mature firms with lower growth opportunity but higher profitability tend to distribute a larger portion of earnings. For these firms, distribution dominates retention since the benefits of distribution (e.g., lower agency costs derived from free cash flow) outweigh the savings of retention (e.g., lower flotation costs).
In particular the life cycle hypothesis would predict higher profitability for dividend payers (stock dividends, cash dividends, or a max of stock and cash dividends) than for non-payers. According to the regulation, the retained earnings must be sufficient to cover the dividend payments in order for firms to distribute dividends (cash dividends or stock dividends). Since retained earnings reflect the long-term profitability in the past years, a firm with poor long-term profitability is unable to distribute dividends.
Moreover, the life cycle hypothesis would predict higher growth opportunity but lower profitability for firms that pay stock dividends than for cash dividends.
For firms with higher growth opportunity but lower profitability, the demand for capital to implement profitable investment opportunity is higher. Thus, the savings from floatation costs may dominate the agency costs from free cash flow. Therefore, these firms may tend to distribute stock dividends rather than cash dividends. In contrast, for firms with lower growth opportunity but higher profitability, the agency costs from free cash flow may outweigh the costs of floating new security. Thus, these firms pay prefer to distribute cash dividends rather than stock dividends.
3.2 Data and the summary statistics of dividend payments
The sample includes all non-financial firms listed on the Taiwan Stock Exchange over the 16 years from 1992 to 2007. The sample period is selected in view of the availability of data. The first year is chosen since a relatively smaller number of stocks were listed on the Taiwan Stock Exchange prior to that year.
The last year is selected since the financial data are made available only until recently. Following previous research (e.g., Fama and French (2001), DeAngelo et al. (2006)), we exclude financial firms because there firms operate in a highly regulated environment. Moreover, to be included in the sample, a firm must have non-missing values on dividends and earnings in the financial database provided by the data vendor (i.e., the Taiwan Economic Journal). The values of cash dividends, stock dividends and other financial variables are collected for
each sample firm. The screening procedure results in sample firms ranging from 149 firms in 1992 to 619 firms in 2007 with a total of 6031 sample observations of dividend payments.
3.3 Methodology
We first examine whether the pattern of different types of dividend payments among sample firms has changed over the sample period. Sample firms are first classified into dividend payers and non-payers. Thus, our first objective is to examine whether the proportion of dividend payers and non-payers changes over the sample period. For dividend payers, firms may distribute stock dividends only, cash dividends only, or distribute a mix of both stock dividends and cash dividends. Thus, for dividend payers, we examine whether the proportion of stock dividends, cash dividends, and the mix of stock dividends and cash dividends changes in the sample period.
We then examine whether firms’ dividend policy is consistent with the prediction of the life cycle hypothesis. Firm characteristics are measured via profitability, growth opportunity, and firm size (e.g., Fama and French, 2001).
We first examine firm characteristics between dividend payers and non-payers.
According to the life cycle hypothesis, dividend payers should be more profitable than non-payers. Moreover, we examine firm characteristics among firms that distribute stock dividends and cash dividends. According to the life cycle hypothesis, firms distribute stock dividends should be characterized by higher growth opportunity but lower profitability.
Fama and French (2001) note that changing pattern of dividend payments can be due to two potential sources. On the one hand, characteristics of newly listed firms may differ from those originally listed on the stock exchange. Fama and French (2001) examine the United Stated industrial firms and suggest that newly listed firms tend to be smaller with low profitability and strong growth opportunities, which provides a partial explanation for the finding of declining cash dividends observed in the United States market. On the other hand, characteristics of originally listed firms may change as time progresses over the sample period. For example, Fama and French (2001) document a lower propensity of firms to pay cash dividends after controlling for the impact of other firm characteristics.
Following Fama and French (2001), we examine whether characteristics of newly listed firms differ from those originally listed on the Taiwan Stock Exchange. For convenience, we define newly listed stocks as sample firms listed on the Taiwan Stock Exchange within the sample period 1992-2007. In contrast, firms listed on the Taiwan Stock Exchange prior to 1992 are referred to as the originally listed stocks. We then examine whether firm characteristics of newly
listed firms differ from those of the originally listed firms. This allows us to examine whether any potential changes in dividend policy are contributed by newly listed firms.
Moreover, we examine the propensity of originally listed firms to pay cash/stock dividends over the sample period. This allows us to examine whether originally listed firms also change their dividend policy. If so, we examine whether the propensity of originally listed stocks to pay dividends is associated with changing firm characteristics including profitability, growth opportunity, and firm size.
Aside from firm characteristics such as profitability, growth opportunity, and firm size, DeAngelo et al. (2006) document a highly significant relation between the decision to pay dividend and the earned/contributed capital mix after controlling for the impact of profitability, growth, and firm size. The rationale is that the ratio of retained earnings to total equity provides a long-term measure of profitability, which is likely an important factor in affecting a firm’s dividend policy. To examine this possibility, we also examine whether the ratio of retained earnings to total equity represents a better measure of a firm’s life cycle in affecting the dividend decision.
4. Empirical results 4.1 Preliminary results
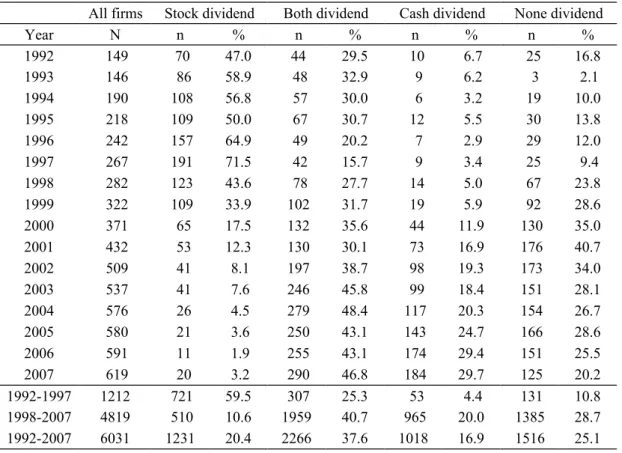
Table 1 and Figure 1 report the distribution of four types of dividend payers over the sample period 1992-2007. Over the whole sample period, the results indicate that 74.9% of the 6031 sample observations belong to dividend payers with the remaining 25.1% belong to non-payers. Of the 74.9% observations with dividend payments, stock dividends account for 20.4%, cash dividends 16.9%, and those involving a mix of both stock and cash dividends account for 37.6%.
When the whole sample period is divided into two sub-periods where 1992- 1997 is the first sub-period and 1998-2007 is the second sub-period. The results indicate a drastic change in the proportion of the four types of dividend payments as time progresses in the sample period. In particular, the proportion of sample firms that pay stock dividends decreases drastically from 59.5% in the first sub-period of 1992-97 to 10.6% in the second sub-period of 1998-2007. In comparison, the proportion of sample firms that pay cash dividends increases from 4.4% in the first sub-period to 20.0% in the second sub-period. Similarly, the proportion of sample firms paying a mix of cash and stock dividends increases from 25.3% in the first sub-period to 40.7% in the second sub-period.
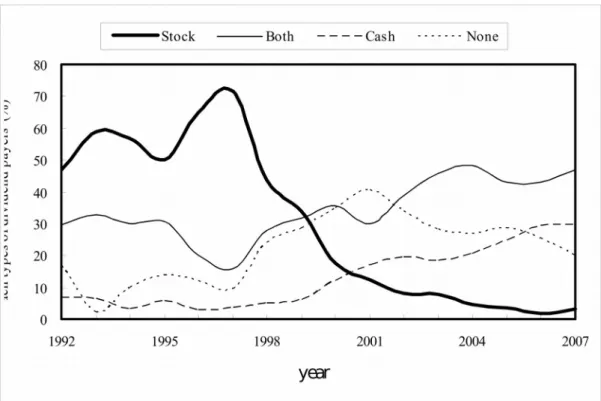
Finally, the proportion for non-payers increases from 10.8% in the first sub- period to 28.7% in the second sub-period. Figure 1 plots the trend for the four types of dividend payers. The figure indicates a rising trend for the proportion of
cash-dividend payers, mixed payers, and non-payers, but a downward trend for the stock-dividend payers in the sample period.
Alternatively, we may estimate the dollar amount of cash dividends and stock dividends from the three types of dividend payers (cash dividends only, stock dividends only, and a mix of both cash and stock dividends). The dollar amount of stock dividends is estimated by multiplying the number of shares declared as stock dividends by the par value per share, which is NT$10. Similarly, for sample firms paying a mix of both cash and stock dividends, the dollar amount of stock dividends is estimated in a similar way. The distribution of stock dividends requires a decrease in either the additional paid-in capital or the retained earnings or both. Similarly, the declaration of cash dividend requires a decrease in retained earnings. Thus, we estimate the dollar amount of stock dividends from the perspective of how much retained earnings and/or additional paid-in capital is removed to the capital account. These dollar amounts of cash dividends and stock dividends are averaged across sample firms for each year in the sample period.
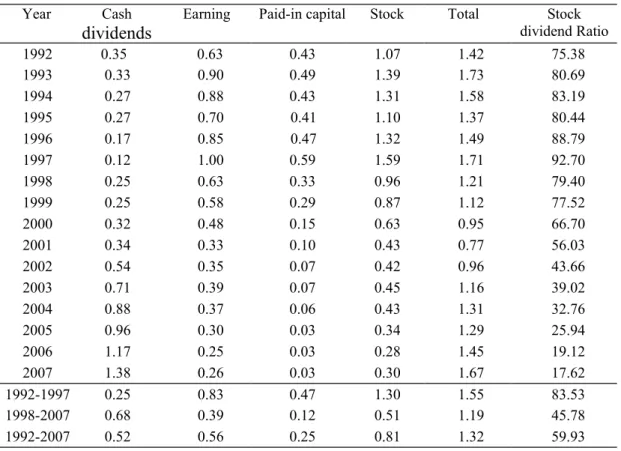
Table 2 reports the results for the dollar amount of cash dividends and stock dividends per share of common stock for dividend payers in the sample period.
The results indicate that the total dollar amount of dividends per share of common stock, which includes both the cash dividends and the stock dividends, is NT$1.32 over the whole sample period. Since the par value is NT$10 per share for all listed stocks on the Taiwan Stock Exchange, the distribution of dividends amounts to 13.2% of par value for dividend payers, of which 5.2% in the form of cash dividends and 8.1% in the form of stock dividends. However, the dollar amount of dividends indicates a declining trend in the whole sample period. The total dollar amount of dividend decreases by 23% from NT$ 1.55 per share in the first sub-period to NT$1.19 in the second sub-period. The major decline in the total dollar amount of dividends comes from the significant drop in the dollar amount of stock dividends, which decreases by 61% from NT$1.30 in the first sub-period to NT$0.51 in the second sub-period. Moreover, the stock dividends experience a significant decline from both sources of pain-in capital and retained earnings. In contrast, the dollar amount of cash dividends experiences a significant increase of 172% from NT$0.25 in the first sub-period to NT$0.68 in the second sub-period. As a result, the proportion of the dollar amount of stock dividends to the dollar amount of total dividends drops from 83.5% in the first sub-period to 45.8% in the second sub-period.
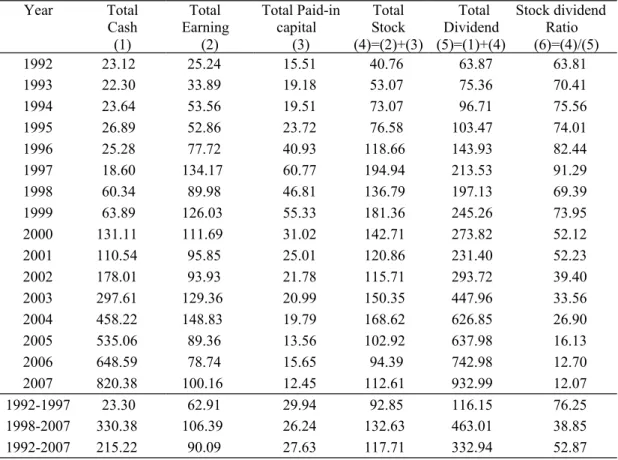
Table 3 reports the aggregate dollar amount of cash dividends and stock dividends per year across all dividend payers. The results indicate the aggregate dollar amount for all dividend payers increases from NT$116 billion per year in the first sub-period to NT$463 billion per year in the second sub-period.
However, this increase in aggregate dollar amount of dividends is contributed
mainly by the increase in the dollar amount of cash dividends. The aggregate dollar amount for cash dividends increases by 13 times from NT$23.3 billion per year in the first sub-period to NT$330.4 billion per year in the second sub- period. In contrast, the aggregate dollar amount for stock dividends increases only by 43% from NT$92.9 billion per year in the first sub-period to NT$132.6 billion per year in the second sub-period. Thus, consistent with the results in Table 2, the proportion of the aggregate amount for stock dividends to that for total dividends drops significantly from 76.3% in the first sub-period to 38.9%
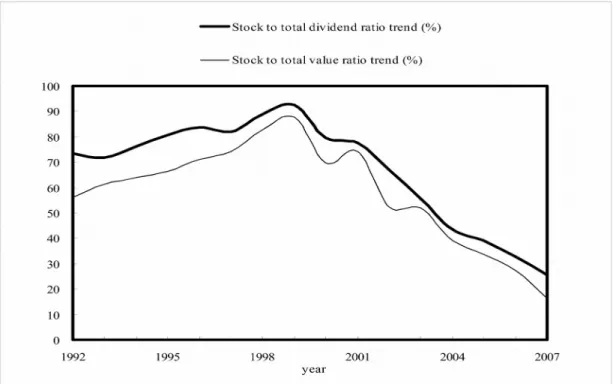
in the second sub-period. Figure 2 plots the time trend for the proportion of the dollar amount for stock dividends to that for total dividends.
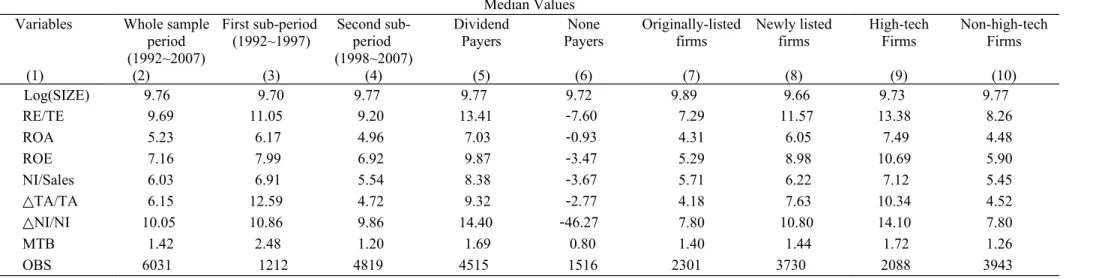
Table 4 reports the median values of firm attributes over the sample period 1992-207. Columns (2) and (3) indicate that sample firms experience higher profitability in the first sub-period than that in the second sub-period. The median return on assets (ROA) decreases from 6.17% in the first sub-period to 4.96% in the second sub-period. Similarly, the return on equity (ROE) drops from 7.99% in the first sub-period to 6.92% in the second sub-period. Moreover, the sample firms experience higher growth rate in the first sub-period than that in the second sub-period. The asset growth rate (△TA/TA) is 12.6% in the first sub-period as opposed to 4.7% in the second sub-period. Similarly, the market- to-book ratio of 2.48 in the first sub-period is about twice the ratio of 1.20 in the second sub-period.
When firm attributes for dividend payers are compared with those for non- payers, Columns (5) and (6) indicate that dividend payers are associated with higher profitability, higher asset growth rate, higher market-to-book ratio. For example, the median return on assets (ROA) is 7.03% for dividend payers and -0.93% for non-payers. Similarly, the median market-to-book ratio is 1.69 for dividend payers as opposed to 0.80 for non-payers.
When sample observations are classified into originally-listed firms (firms listed on the stock exchange throughout the whole sample period) and newly- listed firms (firms newly-listed within the sample period), Columns (7) and (8) indicate that newly-listed firms are associated with higher profitability, higher growth rate, and slightly higher market-to-book ratio. For example, the median return on equity is 8.98% for the newly-listed firms as opposed to the 5.29% for the originally-listed firms. Similarly, the asset growth rate (△TA/TA) is 7.63% for the newly-listed firms as opposed to 4.18% for the originally-listed firms. When sample firms are classified by industry into high-tech versus non-high-tech industry (i.e., electronic industry), Columns (9) and (10) indicate that high-tech firms are associated with higher profitability, higher growth rate, and higher market-to-book ratio.
One plausible explanation for the higher profitability of the newly-listed firms
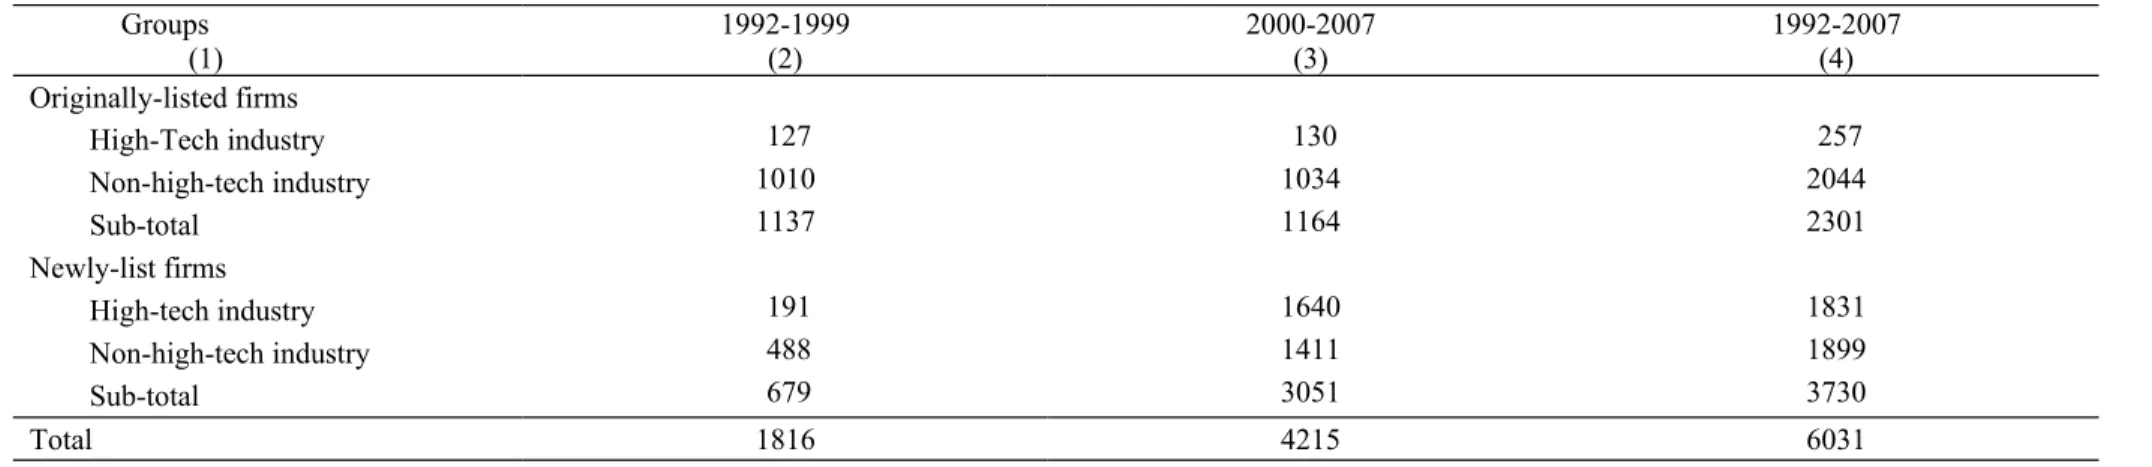
is that there firms tend to be in the high-tech industry. Table 5 reports the breakdown of sample observations classified by both listing time and industry.
Column (4) indicates that only 89% (2044 out of 2301 observations) of the originally-listed firms belong to the non-high-tech industry. In comparison, 49%
(1831 out of 3730 observations) of the newly-listed firms belong to the high- tech industry. The pattern suggests that firms newly listed on the stock exchange within the sample period tend to be in the high-tech industry than those originally listed firms. Moreover, the fourth row of Table 5 indicates that 82%
(3051 out of 3730 observations) of the newly-listed observations enter the stock exchange in the second sub-period.
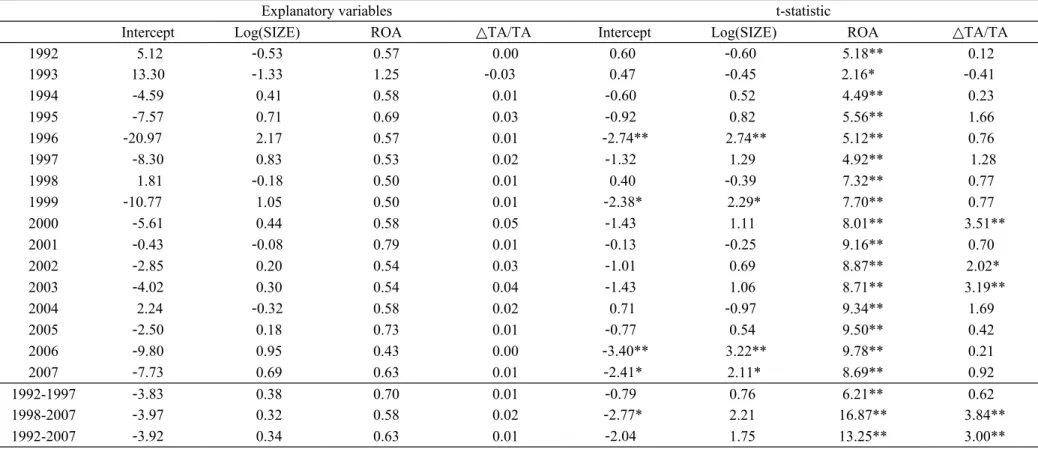
Table 6 examines whether firm attributes differ between dividend payers (including cash dividends only, stock dividends only, and a mix of both cash dividends and stock dividends) and non-payers through multivariate logistic regressions. The dependent variable is a dummy variable set to one for dividend payers and zero for non-payers. Table 6a indicates that return on assets (ROA) is significantly higher for dividend payers than that for non-payers in each of the 16-year sample period. This result is consistent with the prediction of the life cycle hypothesis in that dividend payers are more profitable than non-payers.
Moreover, dividend payers are associated with higher asset growth rates than non-payers. The regression coefficients associated with the asset growth variable, total assets growth rate (△TA/TA), are generally insignificantly positive. Table 6b reports similar regression results by adding an additional variable, the ratio of retained earnings to total equity (RE/TE). The results indicate that this variable is significantly positive in almost each year of the sample period. The other profitability variable, ROA, is still significantly positive in most sample years although the t-values become lower than those in Table 6a where the retained earning variable, RE/TE is not included. The results support the notion that long-term profitability as measured by the ratio of retained earnings to total equity is an important factor in affecting the dividend policy.
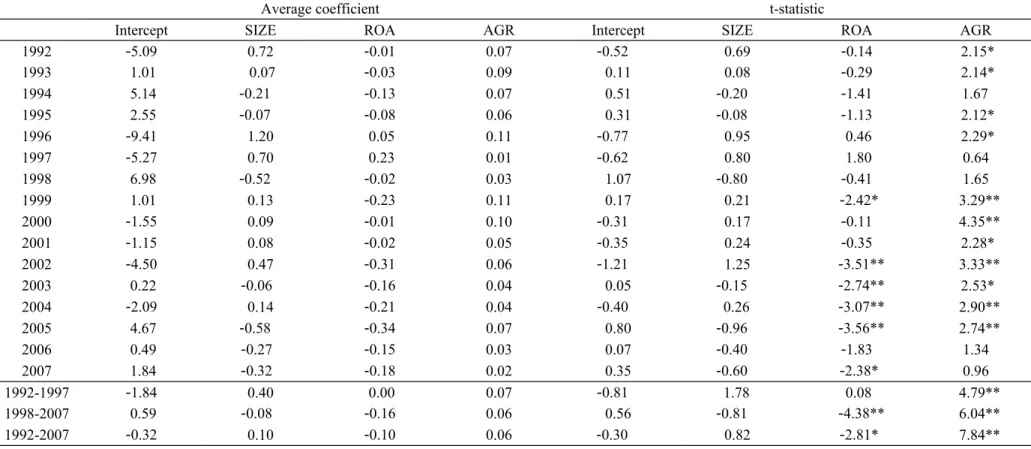
Table 7 compares firm attributes between firms that distribute stock dividends only and firms that distribute cash dividends only via multivariate logistic regressions. The dependent variable is a dummy variable set to one for firms paying stock dividends only and zero for firms paying cash dividends only.
Consistent with the prediction of the life cycle hypothesis, Table 7a indicates that firms paying stock dividends only are associated with higher growth rate but lower profitability. The coefficients associated with the growth variable,
△TA/TA, are mostly significantly positive. In comparison, the coefficients associated with the profitability measure, ROA, are largely negative. Table 7b reports similar regression results where the ratio of retained earnings to total equity (RE/TE) is added to the explanatory variables. Consistent with the notion in DeAngelo et al. (2006), the results in Table 7b indicate that the long-term
profitability measure of the earned/contributed capital mix, RE/TE, appear to be more significant than the short-term profitability measure of returns on total assets, ROA. The results indicate that firms paying stock dividends only are associated with higher asset growth rate, but lower long-term profitability as measured by the ratio of retained earnings to total equity.
Table 8 reports the dollar amount of cash dividends and stock dividends for firms classified by both the listing time and industry. Panel A reports the difference in the dollar amount of dividends between the originally-listed firms and the newly-listed firms. The results indicate a significant increase in the dollar amount of cash dividends in the first sub-period than that in the second sub-period for both the originally listed firms as well as the newly listed firms.
For the originally listed firms, the cash dividend increases from NT$0.27 per share in the first sub-period to NT$0.49 in the second sub-period. For the newly listed firms, the cash dividend increases by a much larger proportion from NT$0.19 in the first sub-period to NT$0.89 per share in the second sub-period.
In comparison, the dollar amount of stock dividends in the first sub-period is much lower than that in the second sub-period for both the originally listed firms as well as the newly listed firms. For originally listed firms, the stock dividend decreases from NT$1.03 in the first sub-period to NT$0.22 per share in the second sub-period. For newly-listed firms, the stock dividend decreases fromNT$1.61 in the first sub-period to NT$0.49 in the second sub-period. When newly-listed firms and originally-listed firms are compared, the difference indicates that newly-listed firms distribute more cash dividends than originally- listed firms in the second sub-period, than in the first sub-period. Similarly, newly listed firms distribute more stock dividends than originally-listed firms in the second sub-period.
Panel B of Table 8 reports the difference in cash dividends and stock dividends between high-tech firms and non-high-tech firms. The results also indicate an increased cash dividends in the second sub-period than in the first sub-period for both high-tech and non-high tech firms. For non-high-tech firms, cash dividends increase from NT$0.27 in the first sub-period to NT$0.66 per share in the second sub-period. For high-tech firms, cash dividends increase from NT$0.17 in the first sub-period to NT$0.96 per share in the second sub- period. In contrast, both high-tech and non-high-tech firms experience a large reduction of stock dividends in the second sub-period than in the first sub- period. Again, the second sub-period increase in cash dividends is larger for high-tech firms than for non-high-tech firms. Similarly, the second sub-period reduction in stock dividends is larger for high-tech firms than for non-high-tech firms.
Table 9 examines firm attributes between originally-listed firms and newly- listed firms, and between high-tech sample firms and non-high-tech sample
firms. Panel A1 reports firm attributes between originally-listed firms and newly-listed firms via multivariate logistic regressions. The dependent variable is a dummy variable set to one for newly-listed firms and zero for originally- listed firms. As expected, the results indicate that newly-listed firms are associated with smaller firm size, SIZE, but higher asset growth rate, △TA/TA, and higher return on total assets, ROA. When the retained earnings ratio, RE/TE, is added into explanatory variables, Panel A2 of Table 9 indicates that only the asset growth variable, △TA/TA, remains significantly positive in both sub-periods. Panel B1 reports firm attributes between high-tech and non-high- tech sample firms. Similarly, the results indicate that high-tech firms are associated with significantly higher asset growth rate, △TA/TA, and higher profitability, ROA. When the retained earnings ratio is added, Panel B2 indicates that only the asset growth rate remains significantly positive.
5. Conclusion
This paper examines the dividend policy for firms listed on the Taiwan Stock Exchange and test the life cycle hypothesis. The sample involves 6031 observations of dividend payments over the 16-year period 1992-2007.
Consistent with the prediction of the life cycle hypothesis, the results indicate that dividend payers (cash dividends, stock dividends, or both) are associated with higher profitability, higher asset growth rate, and higher market-to-book ratio than non-payers. The median return on assets (ROA) is 7.03% for dividend payers and -0.93% for non-payers. Similarly, the median market-to-book ratio is 1.69 for dividend payers as opposed to 0.80 for non-payers.
Moreover, the results indicate that stock-dividend payers are associated with higher asset growth rate, but lower ratio of retained earnings to total equity than those for cash-dividend payers. In particular, stock-dividend payers are associated with higher asset growth rate and lower return on assets, lower retained to total equity ratio than those for cash-dividend payers. These results are consistent with the life cycle hypothesis of dividend payment in that younger firms with higher growth potential but lower profitability tend to distribute more stock dividends than cash dividends. When firms become more mature as characterized by lower growth potential but higher profitability tend to distribute more cash dividends as opposed to stock dividends.
6. References
Balachandran, B. (2004), ‘UK Interim and Fiscal Dividend Reductions: A note on price reaction,’ European Journal of Finance, Vol. 9, pp. 379–90.
Bhattacharya, S. (1979), ‘Imperfect information, dividend policy, and ‘‘the bird in the hand” fallacy,’ Bell Journal of Economics, Vol. 10, (Spring), pp.
259–70.
Brav, a., J. Graham, C. Harvey and R. Michaely (2005), ‘Payout policy in the 21st century,’ Journal of Financial Economics, Vol.77, pp. 483-527.
Bulan, L., N. Subramanian and L. Tanlu (2007), ‘On the timing of dividend initiations,’ Financial Management, (Winter), pp. 31-65.
Chang, R. P. and G. S. Rhee (1990), ‘The impact of personal taxes on corporate dividend policy and capital structure decisions,’ Financial Management, Vol. 19, pp. 21-31.
Crawford, D., D.R. Franz and G.J. Lobo (2005), ‘Signaling managerial optimism through stock dividends and stock splits: A re-examination of the retained earnings hypothesis,’ Journal of Financial Quantitative Analysis, Vol. 40, pp. 531-61.
DeAngelo, H. and L.E. DeAngelo (2006), ‘The irrelevance of the MM dividend irrelevance theorem,’ Journal of Financial Economics, Vol. 79, pp. 293- 315.
DeAngelo, H., L.E. DeAngelo and R.M. Stulz. (2006), ‘Dividend policy and the earned/contributed capital mix: a test of the lifecycle theory,’ Journal of Financial Economics, Vol. 81, pp. 227–54.
Easterbrook, F. (1984), ‘Two agency-cost explanations of dividends,’ American Economic Review, Vol. 74, pp. 650-59.
Eisemann, P.C. and E.A. Moses (1978), ‘Stock dividends: Management’s view,’
Financial Analysts Journal, Vol. 34, pp. 77-85.
Fama, E.F. and K.R. French (2001), ‘Disappearing dividends: changing firm characteristics or lower propensity to pay,’ Journal of Financial Economics, Vol. 60, pp. 3–43.
Gaver, J. and K. Gaver (1993), ‘Additional evidence on the association between the investment opportunity set and corporate financing, dividend and compensation policies,’ Journal of Accounting and Economics, Vol.16 (January–July), pp. 125–60.
Grullon, G., R. Michaely and B. Swaminathan (2002), ‘Are dividend changes a sign of firm maturity,’ Journal of Business Vol. 75, pp. 387–424.
Jensen, G.R., D.P. Solberg and T.S. Zorn (1992), ‘Simultaneous determination of insider ownership, debt and dividend policy,’ Journal of Financial and Quantitative Analysis, Vol. 27, pp. 247-63.
Jensen, M.C. (1986), ‘Agency costs of free cash flow, Corporate Finance and Takeovers,’ American Economic Review, Vol.76, pp. 323-29.
John, K. and J. Williams (1985), ‘Dividends, dilution, and taxes: A signaling
equilibrium,’ Journal of Finance, Vol.40, (September), pp. 1053–70.
Kato, H.K. and W. Tsay (2002), ‘Are stock dividends (MUSHOs) melons or lemons in Japan,’ Pacific-Basin Finance Journal, Vol.10, pp. 531-48.
Miller, M. and F. Modigliani (1961), ‘Dividend policy: growth and the valuation of Shares,’ Journal of Business, Vol. 34, pp. 411-33.
Miller, M. H. and K. Rock (1985), ‘Dividend policy under asymmetric information,’ Journal of Finance, Vol.40, (September), pp. 1031–51.
Myers, S.C. and N. Majluf (1984), ‘Stock issues and investment policy when firms have information that investors do not have,’ Journal of Financial Economics, Vol.13, pp. 187-221.
Smith, C. and R. Watts (1992), ‘The investment opportunity set and corporate financing, dividend and compensation policies,’ Journal of Financial Economics, Vol. 32, (December), pp. 263–92.
Trong, T. and R. Heaney (2007), ‘Largest shareholder and dividend policy around the world,’ The Quarterly of Economics and Finance Vol. 47, pp.
667-87.
Table 1. The distribution of the four types of dividend payers in the sample period 1992-2007
This table reports the distribution of four types of dividend-paying firms (stock dividends only, both stock and cash dividends, cash dividends only, non payers) in the sample period 1992-2007.
All firms Stock dividend Both dividend Cash dividend None dividend
Year N n % n % n % n %
1992 149 70 47.0 44 29.5 10 6.7 25 16.8
1993 146 86 58.9 48 32.9 9 6.2 3 2.1
1994 190 108 56.8 57 30.0 6 3.2 19 10.0
1995 218 109 50.0 67 30.7 12 5.5 30 13.8
1996 242 157 64.9 49 20.2 7 2.9 29 12.0
1997 267 191 71.5 42 15.7 9 3.4 25 9.4
1998 282 123 43.6 78 27.7 14 5.0 67 23.8
1999 322 109 33.9 102 31.7 19 5.9 92 28.6
2000 371 65 17.5 132 35.6 44 11.9 130 35.0
2001 432 53 12.3 130 30.1 73 16.9 176 40.7
2002 509 41 8.1 197 38.7 98 19.3 173 34.0
2003 537 41 7.6 246 45.8 99 18.4 151 28.1
2004 576 26 4.5 279 48.4 117 20.3 154 26.7
2005 580 21 3.6 250 43.1 143 24.7 166 28.6
2006 591 11 1.9 255 43.1 174 29.4 151 25.5
2007 619 20 3.2 290 46.8 184 29.7 125 20.2
1992-1997 1212 721 59.5 307 25.3 53 4.4 131 10.8
1998-2007 4819 510 10.6 1959 40.7 965 20.0 1385 28.7
1992-2007 6031 1231 20.4 2266 37.6 1018 16.9 1516 25.1
Figure 1. The proportion of the four types of dividend payers (stock dividends only, cash dividends only, a mix of cash and stock dividends, non-payers) over the sample period 1992-2007. The horizon axle is the sample period which extends from 1992 to 2007. The vertical axle reports the proportion of the four types of dividend payers.
Table 2. The dollar amount of cash dividends and stock dividends per share in the sample period 1992- 2007
The table reports the dollar amount (in NT$) of cash dividends and stock dividends per share in the sample period 1992-2007. The dollar amount of stock dividend is further divided into two sources: paid-in capital and retained earnings.
Year Cash
dividends Earning Paid-in capital Stock Total Stock dividend Ratio
1992 0.35 0.63 0.43 1.07 1.42 75.38
1993 0.33 0.90 0.49 1.39 1.73 80.69
1994 0.27 0.88 0.43 1.31 1.58 83.19
1995 0.27 0.70 0.41 1.10 1.37 80.44
1996 0.17 0.85 0.47 1.32 1.49 88.79
1997 0.12 1.00 0.59 1.59 1.71 92.70
1998 0.25 0.63 0.33 0.96 1.21 79.40
1999 0.25 0.58 0.29 0.87 1.12 77.52
2000 0.32 0.48 0.15 0.63 0.95 66.70
2001 0.34 0.33 0.10 0.43 0.77 56.03
2002 0.54 0.35 0.07 0.42 0.96 43.66
2003 0.71 0.39 0.07 0.45 1.16 39.02
2004 0.88 0.37 0.06 0.43 1.31 32.76
2005 0.96 0.30 0.03 0.34 1.29 25.94
2006 1.17 0.25 0.03 0.28 1.45 19.12
2007 1.38 0.26 0.03 0.30 1.67 17.62
1992-1997 0.25 0.83 0.47 1.30 1.55 83.53
1998-2007 0.68 0.39 0.12 0.51 1.19 45.78
1992-2007 0.52 0.56 0.25 0.81 1.32 59.93
Table 3. The aggregate dollar amount of cash dividends and stock dividend over 1992-2007
The table reports the aggregate dollar amount (in NT$ billion) of cash dividends and stock dividends for all payers in the sample period 1992-2007.
Year Total
Cash (1)
Total Earning
(2)
Total Paid-in capital
(3)
Total Stock (4)=(2)+(3)
Total Dividend (5)=(1)+(4)
Stock dividend Ratio (6)=(4)/(5)
1992 23.12 25.24 15.51 40.76 63.87 63.81
1993 22.30 33.89 19.18 53.07 75.36 70.41
1994 23.64 53.56 19.51 73.07 96.71 75.56
1995 26.89 52.86 23.72 76.58 103.47 74.01
1996 25.28 77.72 40.93 118.66 143.93 82.44
1997 18.60 134.17 60.77 194.94 213.53 91.29
1998 60.34 89.98 46.81 136.79 197.13 69.39
1999 63.89 126.03 55.33 181.36 245.26 73.95
2000 131.11 111.69 31.02 142.71 273.82 52.12
2001 110.54 95.85 25.01 120.86 231.40 52.23
2002 178.01 93.93 21.78 115.71 293.72 39.40
2003 297.61 129.36 20.99 150.35 447.96 33.56
2004 458.22 148.83 19.79 168.62 626.85 26.90
2005 535.06 89.36 13.56 102.92 637.98 16.13
2006 648.59 78.74 15.65 94.39 742.98 12.70
2007 820.38 100.16 12.45 112.61 932.99 12.07
1992-1997 23.30 62.91 29.94 92.85 116.15 76.25
1998-2007 330.38 106.39 26.24 132.63 463.01 38.85
1992-2007 215.22 90.09 27.63 117.71 332.94 52.87
Figure 2: The ratio of stock dividends to total dividends in the sample period 1992-2007.
The figure displays the ratio of stock dividends to total dividends in the sample period 1992-2007. The solid curve is derived from Table 2 where the ratio indicates the proportion of the dollar amount for stock dividends per share to that for the total dividends. The dotted curve is derived from Table 3 where the ratio indicates the proportion of the aggregate dollar amount of stock dividends to that for the total dividends.
Table 4. Summary statistics of firm attributes over the sample period 1992-2007
The table reports median values for various firm attributes over the sample period 1992-2007. The total sample involves 6031observations over 1992-2007. Dividend payers include firms that pay cash dividends only, stock dividends only, and a mix of cash and stock dividends. None payers are the firms that pay neither cash dividends nor stock dividends. Originally-listed firms refer to firms that were listed throughout the whole sample period 1992-2007. Newly-listed firms refer to firms that were newly listed within the sample period 1992-2007. High-Tech firms refer to firms in the IT industry with non-high-tech firms in other industries. SIZE is measured as the logarithms of total assets, log (total asset), where total assets are measured in NT$. RE/TE is the ratio of retained earnings to equity (in %). ROA is the return on total assets, measured as the ratio of net income to total assets (in %). ROE is the return on equity (in %). NI/Sales is the ratio of net income to sales (in %). △TA/TA is the growth rate of total assets (in %). △NI/NI is the growth rate of net income (in %). MTB is the ratio of market value to book value. OBS is the total number of observations.
Median Values Variables
(1)
Whole sample period (1992~2007) (2)
First sub-period (1992~1997)
(3)
Second sub- period (1998~2007)
(4)
Dividend Payers
(5)
None Payers
(6)
Originally-listed firms
(7)
Newly listed firms
(8)
High-tech Firms
(9)
Non-high-tech Firms
(10)
Log(SIZE) 9.76 9.70 9.77 9.77 9.72 9.89 9.66 9.73 9.77
RE/TE 9.69 11.05 9.20 13.41 -7.60 7.29 11.57 13.38 8.26
ROA 5.23 6.17 4.96 7.03 -0.93 4.31 6.05 7.49 4.48
ROE 7.16 7.99 6.92 9.87 -3.47 5.29 8.98 10.69 5.90
NI/Sales 6.03 6.91 5.54 8.38 -3.67 5.71 6.22 7.12 5.45
△TA/TA 6.15 12.59 4.72 9.32 -2.77 4.18 7.63 10.34 4.52
△NI/NI 10.05 10.86 9.86 14.40 -46.27 7.80 10.80 14.10 7.80
MTB 1.42 2.48 1.20 1.69 0.80 1.40 1.44 1.72 1.26
OBS 6031 1212 4819 4515 1516 2301 3730 2088 3943
Table 5. Classification of sample observations by both time of listing and industry.
The table reports the number of observations for sample firms classified by the time of listing as well as by industry. Sample firms are sorted according to whether they were listed throughout the whole sample period 1992-2007 (originally-listed) or within the sample period (newly-listed) and by industry (high-tech versus non-high-tech)
Groups
(1) 1992-1999
(2) 2000-2007
(3) 1992-2007
(4) Originally-listed firms
High-Tech industry 127 130 257
Non-high-tech industry 1010 1034 2044
Sub-total 1137 1164 2301
Newly-list firms
High-tech industry 191 1640 1831
Non-high-tech industry 488 1411 1899
Sub-total 679 3051 3730
Total 1816 4215 6031
Table 6a. Multivariate logistic regressions for financial attributes between dividend payers and non-payers
The table reports regression results that examine firm attributes between dividend payers and non-payers. The dependent variable is a dummy variable set to one for dividend payers (including cash dividends only, stock dividends only, and a mix of cash and stock dividends) and zero for non-payers. The explanatory variables include the logarithm of total assets (log(SIZE)), return on assets ( ROA), and total assets growth rate (△TA/TA ). The asterisks * and ** indicate significance of the t-values at the levels of 5 and 1% respectively.
Explanatory variables t-statistic
Intercept Log(SIZE) ROA △TA/TA Intercept Log(SIZE) ROA △TA/TA
1992 5.12 -0.53 0.57 0.00 0.60 -0.60 5.18** 0.12
1993 13.30 -1.33 1.25 -0.03 0.47 -0.45 2.16* -0.41
1994 -4.59 0.41 0.58 0.01 -0.60 0.52 4.49** 0.23
1995 -7.57 0.71 0.69 0.03 -0.92 0.82 5.56** 1.66
1996 -20.97 2.17 0.57 0.01 -2.74** 2.74** 5.12** 0.76
1997 -8.30 0.83 0.53 0.02 -1.32 1.29 4.92** 1.28
1998 1.81 -0.18 0.50 0.01 0.40 -0.39 7.32** 0.77
1999 -10.77 1.05 0.50 0.01 -2.38* 2.29* 7.70** 0.77
2000 -5.61 0.44 0.58 0.05 -1.43 1.11 8.01** 3.51**
2001 -0.43 -0.08 0.79 0.01 -0.13 -0.25 9.16** 0.70
2002 -2.85 0.20 0.54 0.03 -1.01 0.69 8.87** 2.02*
2003 -4.02 0.30 0.54 0.04 -1.43 1.06 8.71** 3.19**
2004 2.24 -0.32 0.58 0.02 0.71 -0.97 9.34** 1.69
2005 -2.50 0.18 0.73 0.01 -0.77 0.54 9.50** 0.42
2006 -9.80 0.95 0.43 0.00 -3.40** 3.22** 9.78** 0.21
2007 -7.73 0.69 0.63 0.01 -2.41* 2.11* 8.69** 0.92
1992-1997 -3.83 0.38 0.70 0.01 -0.79 0.76 6.21** 0.62
1998-2007 -3.97 0.32 0.58 0.02 -2.77* 2.21 16.87** 3.84**
1992-2007 -3.92 0.34 0.63 0.01 -2.04 1.75 13.25** 3.00**
Table 6b. Multivariate logistic regressions for financial attributes between dividend payers and non-payers
The table reports regression results that examine firm attributes between dividend payers and non-payers. The dependent variable is a dummy variable set to one for dividend payers (including cash dividends only, stock dividends only, and a mix of cash and stock dividends) and zero for non-payers. The explanatory variables include the logarithm of total assets (log(SIZE)), retained earnings to equity ratio (RE/TE), return on assets (ROA), and total assets growth rate (△TA/TA ). The asterisks * and ** indicate significance of the t-values at the levels of 5 and 1% respectively
Explanatory variables t-statistic
Intercept Log(SIZE) RE/TE ROA △TA/TA Intercept SIZE RE/TE ROA △TA/TA
1992 9.67 -1.01 0.20 0.34 0.01 1.07 -1.06 2.81** 2.34* 0.21
1993 23.99 -2.42 0.24 1.06 -0.05 0.85 -0.82 1.45 1.58 -0.46
1994 4.15 -0.50 0.20 0.36 0.02 0.44 -0.51 2.82** 2.13* 0.52
1995 0.73 -0.19 0.17 0.48 0.05 0.08 -0.21 2.80** 3.25** 2.46*
1996 -24.60 2.56 0.30 0.19 0.00 -2.81** 2.81** 3.48** 1.19 0.18
1997 -5.78 0.57 0.40 0.02 0.04 -0.75 0.74 4.25** 0.11 2.20*
1998 1.57 -0.15 0.07 0.37 0.02 0.34 -0.32 2.96** 4.88** 1.23
1999 -12.31 1.20 0.24 0.26 0.02 -2.30* 2.22* 5.14** 2.81** 1.06
2000 -8.05 0.70 0.24 0.29 0.05 -1.83 1.58 4.64** 2.95** 2.88**
2001 -1.42 0.03 0.28 0.48 0.00 -0.38 0.07 5.52** 4.75** 0.04
2002 -3.58 0.27 0.17 0.31 0.03 -1.14 0.85 5.84** 4.21** 2.17*
2003 -5.86 0.48 0.25 0.27 0.03 -1.68 1.37 6.26** 3.47** 1.60
2004 4.39 -0.56 0.20 0.36 0.02 1.18 -1.46 5.58** 4.44** 1.09
2005 1.81 -0.26 0.23 0.34 0.01 0.48 -0.68 4.87** 3.31** 0.73
2006 -4.80 0.41 0.37 0.07 0.01 -1.19 0.99 6.50** 0.83 0.35
2007 0.51 -0.15 0.21 0.60 -0.01 0.11 -0.34 5.43** 4.88** -0.59
1992-1997 1.36 -0.16 0.25 0.41 0.01 0.21 -0.24 7.16** 2.81* 0.80
1998-2007 -2.77 0.20 0.23 0.33 0.02 -1.71 1.19 9.36** 7.59** 3.08*
1992-2007 -1.22 0.06 0.24 0.36 0.01 -0.47 0.23 12.03** 6.17** 2.39