doi:10.6342/NTU201601239
國立臺灣大學理學院化學研究所 碩士論文
Department of Chemistry College of Science
National Taiwan University Master Thesis
藉由胜肽輸送進入活細胞內溶小體之具有酸鹼值 偵測能力的中孔洞二氧化矽奈米粒子
Peptide-mediated delivery of pH-sensing Mesoporous Silica Nanoparticles into Lysosome in living cells
張榮麟 Rong-Lin Zhang
指導教授:牟中原 博士 Advisor: Chung-Yuan Mou, Ph.D.
中華民國 105 年 7 月
July, 2016
doi:10.6342/NTU201601239
I
誌謝
時間飛逝,轉眼間就快完成兩年的碩班研究,在這段期間,感謝足智多謀的牟 老師給予我很多寶貴的知識和意見以及豐富的研究資源,讓我有充分學習的機會,
且站在科學巨人的肩膀上開啟我的研究旅程,也讓我獲益良多。而在這一路學習的 過程中,首先要感謝思翰學長,給予我實驗的方向,也教導我實驗的規劃並且耐心 地與我討論實驗的結果,讓一開始懵懂無知的我逐漸有了研究的概念,也讓我慢慢 了解這個奈米材料的世界。而面對完全陌生的光學系統,很慶幸有劫叡學長的幫助,
對於我無數的問題,都能耐心教導我,讓我實驗能夠順利的進行,另外對於程式一 竅不通的我,很感謝有中央大學簡汎清教授的協助,才能讓數據能夠更順利的分析,
對於光學儀器的架設,感謝呂杰翰博士耐心地給予指導,也給了我很多光學相關知 識,讓我更熟系這套光學系統,在每次遇到的光學瓶頸,還好有您們從深淵中把我 拉起,是您們重新建立起我的信心,讓實驗可以持續的進行。在生物實驗方面,要 非常感謝陳奕平學長的協助,細心的教導我實驗的步驟和技巧,也不辭辛勞的提供 實驗上載送的服務,讓我能更快速取得完美漂亮的數據,另外在研究上也給予我很 多的關心讓我感到非常欣慰。在這兩年的時光裡,最懷念還是實驗室的夥伴們,在 忙碌的碩班生活中,有你們的陪伴是支持我的動力,謝謝明瀚學長給予我很多豐富 的經驗與人生道理,感謝乃元給予我實驗和課業上的幫助,你是我學習的好榜樣,
謝謝怡婷高亢美妙的歌聲撫慰了我的心靈,感謝每天都很歡樂的梓安學長時常找 我吃飯和送便當,讓我即使在 12 樓也不會感到孤獨,謝謝祖源讓我吃到我生平都 沒吃過的大餐,謝謝你們的陪伴,才能更豐富我的碩班生活。
最後,感謝愛我的家人,謝謝你們給予我生活上的幫助,有你們背後默默的付 出和支持,才有今天的我,僅以此論文獻給我最摯愛的家人。
doi:10.6342/NTU201601239
II
中文摘要
具中孔洞的二氧化矽奈米粒子作為平台可有效地運輸酵素抵達受損的組織,
因酵素裝載在此多功能的中孔洞二氧化矽奈米粒子裡,能夠增加在血液中的循環 時間、有更精準的標靶能力以及保護酵素免於免疫反應的發生。在這個研究裡,此 中 孔 洞 的 二 氧 化 矽 奈 米 粒 子 被 修 飾 上 兩 個 酸 鹼 值 靈 敏 的 螢 光 染 劑 , 分 別 是 fluorescein isothiocyanate (FITC, pKa = 6.7)和 oregon green succinimidyl ester (OG, pKa = 4.8),以及一個參考染劑為 rhodamine B isothiocyanate (RITC),使其成為一個 pH 值感測器並具有一個寬廣的酸鹼值偵測範圍 (pH = 4.2 ─ 7.4),因此我們可以利 用單一粒子追蹤的顯微技術來做酸鹼值的即時偵測,藉此提供一個新穎的方式來 辨識此中孔洞二氧化矽奈米粒子在活細胞中的位置。在另一方面,此具有酸鹼值感 測 能 力 的 中 孔 洞 二 氧 化 矽 奈 米 粒 子 被 修 飾 上 具 有 溶 小 體 標 靶 能 力 的 胜 肽 鏈 (YXXØ )可作為酵素取代治療的生醫應用,我們展示了酸鹼值感測的中孔洞二氧化 矽奈米粒子對於細胞環境 pH 值的即時傳訊是一個有用的技術來評估其在活細胞中 的移動途徑,而藉著 YXXØ 胜肽的功能,此連接著 YXXØ 的中孔洞二氧化矽奈米 粒子確實能夠到達溶小體,相較於裸露的中孔洞二氧化矽奈米粒子幾乎只累積在 細胞質的環境。酵素取代治療已經在臨床上被使用來治療溶小體囤積症,然而目前 為止,仍然有許多的問題尚待解決,其中像是造成各種副作用的免疫反應以及不佳 的治療效果等等,因此具有溶小體標靶能力的中孔洞二氧化矽奈米粒子將會是一 個有潛力的奈米載體作為改善酵素取代治療對於溶小體囤積症的效果。
關鍵字:中孔洞二氧化矽奈米粒子、酸鹼值感測器、三維空間單一粒子追蹤、溶小 體標靶、溶小體囤積症
doi:10.6342/NTU201601239
III
Abstract
Mesoporous silica nanoparticles (MSNs) as a platform can efficiently transport
enzymes to the impaired tissues because enzymes loaded in multiple functional MSNs
can increase the circulation time in blood, have more precisely targeting ability and
protect them from some immune reaction. In this study, MSNs were made as a pH
nanosensor which has a broad pH-sensing range from 4.2 to 7.4 by conjugating two pH-
sensitive fluorescent dyes, fluorescein isothiocyanate (FITC, pKa=6.7) and oregon green
succinimidyl ester (OG, pKa=4.8), and a referent dye, rhodamine B isothiocyanate (RITC)
onto MSNs. So we can provide a novel method to identify the localization of the MSNs
in living cells with real-time pH detection by single particle tracking microscope
technique. In the other hand, the pH-sensing MSNs were modified with lysosomal sorting
peptides (YXXØ ) which can target lysosomes for potential enzyme replacement therapy.
We showed that the real-time signaling of the environment pH values from the pH-sensing
MSNs is a useful technique for evaluating the pathway of them in living cells, and the
specific peptide-conjugated MSNs were indeed delivered into lysosomes by the function
of the YXXØ sequences. Enzyme replacement therapy has been used clinically for
treating lysosomal storage diseases. However there are still many problems such as
immune reaction causing much side-effect need to be solved. So the lysosome-targeting
MSNs will be a promising nanocarrier for improving the enzyme replacement therapy to
doi:10.6342/NTU201601239
IV
lysosomal storage disease.
Keywords: mesoporous silica nanoparticles、pH sensor、3D single particle tracking、
lysosome targeting 、lysosomal storage disease
doi:10.6342/NTU201601239
V
Contents
誌謝 ... I
中文摘要 ... II
Abstract ... III Contents ... V List of Figures ... VIII List of Tables ... XX
Chapter 1 General Introduction ... 1
1.1 Measuring Intracellular pH by Fluorescence ... 2
1.2 Broadening the Sensing Range of Nano-Sized pH sensor ... 6
1.3 Fluorescence Microscopy with 3D-Single Particle Tracking Technique ... 7
1.4 Introduction to Mesoporous Silica Nanoparticles (MSNs) ... 11
1.4.1 Synthesis Mechanism of MSNs ... 12
1.4.2 Applications of MSNs ... 15
1.5 Ratiometric pH Sensor based on Mesoporous Silica Nanoparticles ... 17
1.6 Lysosome-Targeting Nanocarriers for Lysosomal Storage Disorder Therapy 19 1.6.1 Introduction to LSD ... 19
1.6.2 The Trafficking of MSNs in Living Cells ... 21
1.6.3 Peptide-mediated Delivery to Lysosome ... 32
doi:10.6342/NTU201601239
VI
Chapter 2 Experimental Section ... 36
2.1 Materials ... 36
2.2 Characterization... 37
2.2.1 Transmission Electron Microscopy (TEM) ... 37
2.2.2 Nitrogen Adsorption-Desorption Isotherms ... 37
2.2.3 Fluorescence Spectrum... 37
2.2.4 Dynamic Light Scattering (DLS) ... 38
2.2.5 Zeta Potential ... 38
2.3 Synthetic Procedure ... 39
2.3.1 Preparation of Dye Conjugated APTMS ... 39
2.3.2 Synthesis of Double-labeled MSNs and Triple-labeled MSNs ... 39
2.3.3 Post Modification of PEI-silane onto Triple-abeled MSNs... 41
2.3.4 Conjugation of YXXФ sequence to Triple-labeled MSNs-PM PEI .... 41
2.4 Fluorescence Microscope Setup ... 42
2.5 pH Calibration Curve ... 43
2.5.1 In Vitro Method ... 43
2.5.2 In Situ Method ... 43
2.6 In Vitro Cell Studies : ... 44
2.6.1 Cell Culture ... 44
doi:10.6342/NTU201601239
VII
2.6.2 Single Particle Tracking in Live Cell ... 45
2.6.3 Flow Cytometry Analysis ... 45
2.6.4 Intracellular Imaging ... 46
Chapter 3 Results and Discussions ... 47
3.1 Adjustment of Size, Uniformity and Suspension of Nanosensors ... 47
3.2 Effect of Ratios of FITC to RITC and Addition Time of RITC ... 50
3.3 Effect of Doubling Dyes and Addition of PEI ... 53
3.4 FRET-based Ratiometric Fluorescent Determination of pH in Buffered Water Solutions ... 55
3.5 Design and Principle of Triple-labeled Nanosensor ... 59
3.6 Evaluation of the In Vitro and In Situ Calibration ... 62
3.7 Single Particle Tracking System ... 64
3.8 The Design of Lysosome-Targeting Nanocarrier based on pH-Sensing ... 70
Conclusion ... 88
References ... 89
doi:10.6342/NTU201601239
VIII
List of Figures
Figure 1.1. Schematic presentation of F-UiO synthesis. (b) Correlation between FITC
absorbance and fluorescence at various FITC loadings. (c-e) pH-calibration curves of free
FITC (c) and F-UiO acquired by fluorimetry (d) and by confocal laser scanning
microscopy (e). 488/435 in the Y-axis represents I488/520/I435/520. (F) CLSM images
showing the overlay of green (488 nm excitation) and red (435 nm excitation) colors of
F-UiO particles in HBSS buffers with different pHvalues.14 ... 3
Figure 1.2. QD-FP FRET-based pH sensor. (a) Schematic demonstration of the pH-
dependent energy transfer between the quantum dot and fluorescent protein. In an acidic
environment, energy transfer to the FP FRET acceptor is minimal, yielding a high QD
signal; at neutral or basic pH, energy transfer is more efficient, producing an enhanced
FRET signal. (b) Absorbance spectroscopy indicates multiple proteins bound to each QD,
as depicted in the inset. (c and d) Titration of QD-FP probes containg the FP acceptors
mOrange and mOrange M163K, respectively, showing increased energy transfer at
alkaline pHs with clear isosbestic points. Representative spectra of one of three
independent titrations are shown. (e) The ratio of acceptor emission to donor emission
increases with increasing pH for both probes. Data points are means ± standard deviations
for three independent titration. (f) The changes in the nanoprobe acceptor to donor ratios
are compared to the ratiometric signal change for the pH-sensitive fluorophore BCECF.
doi:10.6342/NTU201601239
IX
One representative titration is shown.10 ... 4
Figure 1.3. Schematic of the cross-linked poly acrylamide nanoparticle. (b) In vitro
calibration of the triple-labeled sensor with both OG and FS, and two dual-labeled sensors
with either OG or FS. (c) Uptake of the triple-labeled sensor by a HepG2 cell after 24h
and washing and imaged with confocal microscopy. Scale bar = 10µm. OG = Oregon
Green; FS = fluorescein.7 ... 7
Figure 1.4. Schematic of the confocal 3-D tracking microscope optical configuration.
The fiber optic pairs are configured to form a 3-D tetrahedron-like detection volume in
sample space.22c ... 9
Figure 1.5. The scheme of 3D STORM. (A) Three-dimensional localization of individual
fluorophores. The simplified optical diagram illustrates the principle of determining the
z coordinate of a fluorescent object from the ellipticity of its image by introducing a
cylindrical lens into the imaging path. The right panel shows images of a fluorophore at
various z positions. EMCCD, electron-multiplying charge-coupled device. (B)
Calibration curve of image widths Wx and Wy as a function of z obtained from single
Alexa 647 molecules. Each data point represents the average value obtained from six
molecules. The data were fit to a defocusing function (red curve).23d ... 10
Figure 1.6. Structures of mesoporous M41S materials: (a) MCM-41 (2D hexagonal,
space group p6mm), (b) MCM-48 (cubic, space group Ia3d), and (c) MCM-50 (lamellar,
doi:10.6342/NTU201601239
X
space group p2).30 ... 12
Figure 1.7. Formation of mesoporous materials by structure-directing agent: (a) true
liquid-crystal template mechanism, (b) cooperative liquid-crystal template mechanism.30
... 13
Figure 1.8. Schematic illustration for the synthesis and selective functionalization of
MSNs.33 ... 14
... 14
Figure 1.9. TEM images of mesoporous silica with different average sizes: (a) 280 nm;
inset: FFT analysis of the TEM image; (b) 170, (c) 110, (d) 50, (e) 30 nm. (f) High-
resolution TEM image of a single particle in (c).34 ... 14
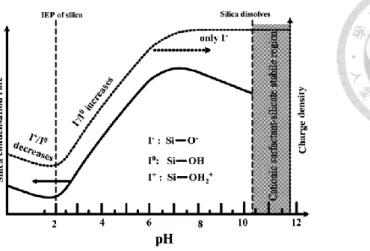
Figure 1.10. Effect of pH value on the silica condensation rate, charge properties and
charge density on the surface of the silica species.34 ... 15
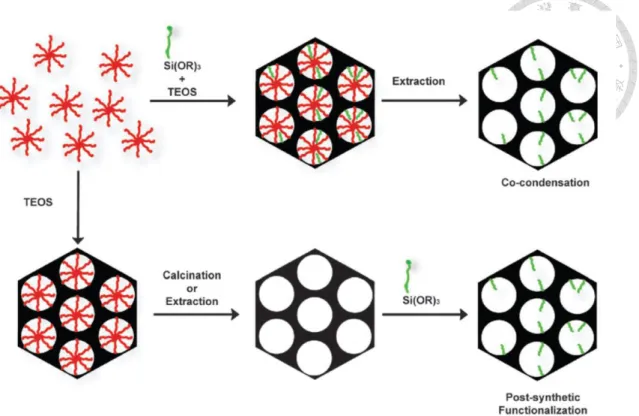
Figure 1.11. Functionalization of MSNs by co-condensation (top) or the post-synthetic
method (bottom). A trialkoxysilane molecule bearing a functional group (green) is shown
as an example of a silica precursor. The structure-directing agent is represented by
micelles (red).37 ... 16
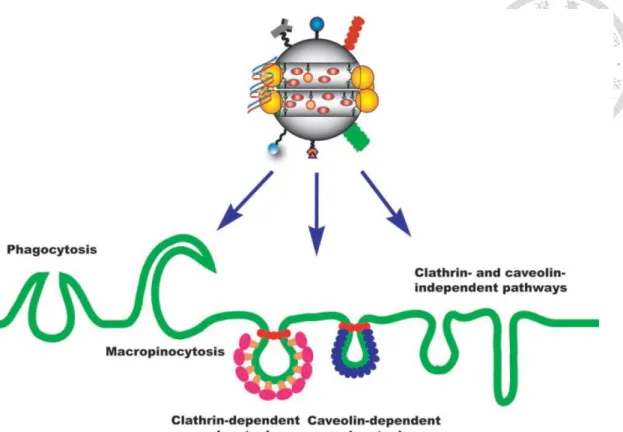
Figure 1.12. Pathways of mesoporous silica nanoparticles for entry into cells. Large
particles are internalized by phagocytosis, whereas fluid uptake occurs by
micropinocytosis. In the case of MSN materials, most internalization is via endocytic
doi:10.6342/NTU201601239
XI
pathways. These pathways differ with regard to the nature of the surface functionalization
and structural properties of MSNs.50 ... 26
Figure 1.13. Intracellular trafficking of mesoporous silica nanoparticles. (a) MSNs are
wrapped through specific (ligand-receptor) and nonspecific (hydrophobic, Coulombic)
binding interaction. (b) Once the MSNs are internalized, depending on the endocytic
pathway, it can be delivered to intermediate compartments (e.g., caveosomes). (c) Later
these compartments are transported to early endosomes and then to sorting endosomes.
From sorting endosomes, a fraction of the MSNs are sorted back to the cell exterior
through recycling endosomes (not shown in the scheme). (d) The remaining fraction is
transported to secondary endosomes, (e) which then fuse with lysosomes. (f) The MSNs
escape the endolysosomes and enter the cytosolic compartment.50 ... 27
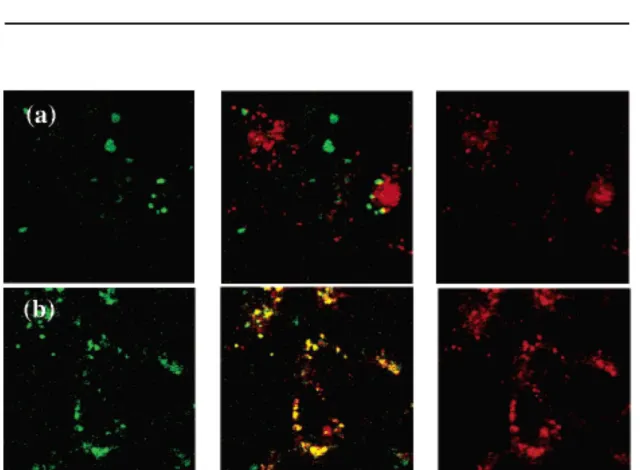
Figure 1.14. Confocal fluorescence images of HeLa cells stained with FM 4-64 and 40
µg/mL suspensions of (a) FITC-MSN and (b) FAP-MSN after 6 hours of introduction.
The fluorescent images (left) show the MSNs (green) and FM 4-64-labeled endosomes
(red) are shown on the right.52 ... 28
Figure 1.15. Ratiometric imaging of pH in various intracellular compartments using
confocal microscopy. HeLa cells were incubated at 37 ℃ with MSN-PP and MSN-TA
for 4 hours, respectively. The images (overlaid on bright field) of pH sensors in HeLa
cells showing (a) MSN-PP, and (b) MSN-TA.40 ... 29
doi:10.6342/NTU201601239
XII
Figure 1.16. Confocal microscopy analysis of (a) MSN-PP and (b) MSN-TA in HeLa
cells. The living unfixed cells were co-treated with endosome-specific marker FM 4-64
(5 µg/mL) and analyzed by confocal microscopy for an endosomal co-localization image.
The fluorescent images show the MSNs (green, FITC and red, RITC) and FM 4-64-
labeled endosomes (blue).40 ... 29
Figure 1.17. Confocal images of 10 nm mesoporous silica nanoparticles with lysosomes.
Cells adherent on coverslips were preincubated for 10 minutes with Lysotracker Green or
Red, then washed and incubated with nanoparticles, and imaged at 1, 5, and 30 minutes.57
... 30
Figure 1.18. Comparison of uptake and intracellular localization of 50 nm mesoporous
silica nanoparticles functionalized or not with either COOH or NH2 groups in SKOV3
and NIH-OVCAR cells after incubation times of one and 24 hours with 20 µg of
nanoparticles.57 ... 30
Figure 1.19. Intracellular distributions of R6G-FITC-MSNs as compared to LysoTracker
Blue DND-22. Bar, 10 µm.58 ... 31
Figure 1.20. The intracellular localization of spherical MS nano- and microparticles with
different sizes within lysosomes of MDA-MB-468 cells. (a) E-MS-1 (190 nm), (b) E-MS-
2 (420 nm), (c) E-MS-3 (1220 nm), (d) C-MS-1 (190 nm), (e) C-MS-2 (420 nm), and (f)
C-MS-3 (1220 nm).59 ... 31
doi:10.6342/NTU201601239
XIII
Figure 1.21. Schematic representation of adaptor protein (AP) complexes. The four
heterotetrameric adaptor protein (AP) complexes (i.e., AP-1, AP-2, AP-3 and AP-4) are
composed of homologous subunits, some of which occur as multiple isoforms. The
subunits assemble into complexes organized into core, hinge and ear domains. AP
complexes participate in protein sorting to lysosomes at different stages of biosynthetic
and endocytic pathways.60 ... 35
Figure 1.22. Proposed role for AP-3 in the trafficking of lysosomal membrane proteins
(E, early endosome; LE, late endosome; LYS, lysosome; PM, plasma membrane).65 ... 35
Figure 3.1. Characterization of FRMSNs with different synthesis conditions by TEM (left)
and DLS (right). (a) 0.768 M NH3 (aq). (b) 0.896 M NH3 (aq). (c) 1.024 M NH3 (aq). (d)
1.024 M NH3 (aq) + triethylamine (TEA). (e) 1.024 M NH3 (aq) + ethylene glycol (EG).
... 49
Figure 3.2. Scheme of 3D single particle tracking apparatus. ... 51 Figure 3.3. TEM images (Top) and pH calibration (Bottom) of double-labeled MSN with
different mole ratio and addition time of FITC and RITC. (a) FITC : RITC = 28.3 : 1/3 ;
FITC addition with RITC. (b) FITC : RITC = 28.3 : 1 ; FITC addition with RITC. (c)
FITC : RITC = 28.3 : 3 ; FITC addition with RITC. (d) FITC : RITC = 28.3 : 1/3 ; RITC
addition after FITC in 30min. . (e) FITC : RITC = 28.3 : 1 ; RITC addition after FITC in
30min. . (f) FITC : RITC = 28.3 : 3 ; RITC addition after FITC in 30min. ... 52
doi:10.6342/NTU201601239
XIV
Figure 3.4. Characterization of double-labeled MSNs by TEM (left) and SPT
fluorescence microscopy (right). (a) double-labeled MSN without PEI (b) double-labeled
MSN with PEI. ... 54
Figure 3.5. Fluorescence emission spectra of FRMSN-PEI (80 µg/mL) in 10 mM
phosphate buffer at various pH values. (b) The ratio of the fluorescence intensity of FITC
to that of RITC (I520 / I593) versus pH measured by Fluorimetry in 10 mM phosphate buffer.
(c) The ratio of the fluorescence intensity of FITC to that of RITC (I520 / I593) versus pH
measured by Fluorescence Microscopy in 10 mM phosphate buffer. ... 57
Figure 3.6. pH reversibility study of double-labeled MSNs between pH 4 and 8. ... 57 Figure 3.7. Fluorescence intensity ratio for the double-labeled MSNs (80 µg/mL) in
phosphate buffer solution (10 mM, pH 7.4) upon the addition of of various metal ions.
The concentrations of all the cations are 50 µM. ... 58
Figure 3.8. Fluorescence intensity ratio for the double-labeled MSNs (80 µg/mL) in
phosphate buffer solution (10 mM, pH 7.4) containing KCl with various ionic strengths
(0, 0.01, 0.05, 0.15, 0.20M). ... 58
Figure 3.9. Design and characterizations of triple-labeled MSN. (a) Schematic of triple-
labeled MSN and FRET effect when being excited by single wavelength laser. (b)
Characterization of triple-labeled MSNs by TEM image (Top) and DLS (Bottom). (c)
Fluorescence spectrum of triple-labeled MSNs with pH variation from pH 3.19 to pH 8.84
doi:10.6342/NTU201601239
XV
in 10 mM phosphate buffer. (d) The ratio of the fluorescence intensity of FITC to that of
RITC (I520 / I593) versus pH measured by Fluorimetry in 10 mM phosphate buffer. ... 60
Figure 3.10. Nitrogen adsorption-desorption isotherm and (b) corresponding pore size
distribution plot of triple-labeled MSNs. The pore size distribution plot is obtained from
the analysis of the adsorption or desorption isotherms using BJH (Barrett-Joyner-Halenda)
method. ... 61
Figure 3.11. The ratio ( I520 / I593 ) of the fluorescence intensity of Triple-labeled MSNs
versus pH measured in different environment by Fluorescence Microscopy. (a) In 10 mM
phosphate buffer solution. (b) In Medium ( DMEM+FBS+P/S). (c) Inside HeLa cells ( in
situ ). ... 63
Figure 3.12. The in-situ pH calibration curves of triple-labeled MSNs before and after
being stored in 99.5% EtOH for 3 months. ... 63
Figure 3.13. Scheme of 3D single particle tracking apparatus combined with pH reporter.
... 67
Figure 3.14. The z calibration curve of the widths from the fluorescence spots in x and y
direction as a function of z locations obtained from five triple-labeled MSNs. The
fluorescence spots of the images were fit to an elliptical Gaussian function carried out
using MatLab software. ... 67
Figure 3.15. Three dimensional localization distribution of triple-labeled MSNs.
doi:10.6342/NTU201601239
XVI
Histograms of the distribution in x, y and z are fit to a Guassian function, yielding
standard deviations of 24 nm in x, 10 nm in y, and 18 nm in z. ... 68
Figure 3.16. X, Y, and Z drift study. Triple-labeled MSNs were immobilized on a
coverslip for 30 min tracking (1 frame per 15 s). (b) The corresponding root mean square
speed variations over time from (a). ... 68
Figure 3.17. The variations of fluorescence intensity ratio when triple-labeled MSNs
were excited with different laser power. The 10 nanoparticles in one image were
employed for calculation. (b) The relationship between FITC/RITC ratios and
fluorescence intensity of RITC. The 13 triple-labeled MSNs immobilized on coverslip
are tracked for a long time to examine the influence of weak RITC intensity. ... 69
Figure 3.18. Photo-stability of Triple-labeled MSNs is measured for 30 min by
Fluorescence Microscopy (1 frames per 15s). (a) The intensity variation of both I520 (FITC
and OG) and I593 (RITC) over time. (b) The corresponding intensity ratios (I520 : I593) over
time, which remains the same value in this duration. ... 69
Figure 3.19. TEM images (left) and DLS plot (right) of (a) triple-labeled MSN, (b) triple-
labeled MSN@PM PEI, and (c) triple-labeled MSN@PM PEI@L. ... 72
Figure 3.20. Zeta potential plot of triple-labeled MSN (blue line) and triple-labeled
MSN@PM PEI (red line) in water solution with different pH values. ... 73
Figure 3.21. The in-situ calibration curves of (a) triple-labeled MSN and (b) triple-
doi:10.6342/NTU201601239
XVII
labeled MSN@PM PEI@L after 30 minutes (red) and 12 hours (blue) of incubation with
HeLa cells. ... 73
Figure 3.22. The percent of uptake and (b) the fluorescence intensity of the nanoparticles
by flow cytometry analysis of cell-uptake. HeLa cells were incubated at 37 ℃ with
triple-labeled MSN or triple-labeled MSN@PM PEI@L for 4 h. ... 75
Figure 3.23. Co-localization images of triple-labeled MSN@PM PEI @L with (a) early
endosome marker, EEA-1, and (b) lysosomal marker, LAMP-1 antibody, at 4, 8 and 12
hours in HeLa cells. The percentages on the images, representing the overlapping ratio of
the nanoparticle with the markers, were analyzed by Image J software. ... 77
Figure 3.24. Co-localization images of early endosome marker, EEA-1, with (a) triple-
labeled MSN and (b) triple-labeled MSN@PM PEI@L at 4 and 12 hours in HeLa cells.
The percentages on the images, representing the overlapping ratio of the nanoparticle with
the two markers, were analyzed by Image J software. ... 77
Figure 3.25. Co-localization images of lysosomal marker, LAMP-1 antibody, with (a)
triple-labeled MSN and (b) triple-labeled MSN@PM PEI@L at 4 and 12 hours in HeLa
cells. The percentages on the images, representing the overlapping ratio of the
nanoparticle with the two markers, were analyzed by Image J software. ... 78
Figure 3.26. A representative case of triple-labeled MSN for staying at cytoplasm. The
trajectory of a triple-labeled MSN after 12 hours incubation with HeLa cells as a function
doi:10.6342/NTU201601239
XVIII
of (a) time and (b) pH value. (c) The corresponding RMS speed variation over time. (d)
The corresponding pH variation over time. The images were taken at 1 frame per 5
seconds. ... 82
Figure 3.27. A representative case of triple-labeled MSN@PM PEI@L for entering late-
endosome from cytosol. The trajectory of a triple-labeled MSN@PM PEI@L after 12
hours incubation with HeLa cells as a function of (a) time and (b) pH value. (c) The
corresponding RMS speed variation over time. (d) The corresponding pH variation over
time. The images were taken at 1 frame per 5 seconds. ... 83
Figure 3.28. A representative case of triple-labeled MSN@PM PEI@L for maturing to
the lysosome. The trajectory of a triple-labeled MSN@PM PEI@L after 12 hours
incubation with HeLa cells as a function of (a) time and (b) pH value. (c) The
corresponding RMS speed variation over time. (d) The corresponding pH variation over
time. The images were taken at 1 frame per 5 seconds. ... 84
Figure 3.29. A representative case of triple-labeled MSN@PM PEI@L for staying at
lysosome. The trajectory of a triple-labeled MSN@PM PEI@L after 12 hours incubation
with HeLa cells as a function of (a) time and (b) pH value. (c) The corresponding RMS
speed variation over time. (d) The corresponding pH variation over time. The images
were taken at 1 frame per 5 seconds. ... 85
Figure 3.30. Statistic of average pH values of (a) triple-labeled MSN and (b) triple-
doi:10.6342/NTU201601239
XIX
labeled MSN@PM PEI@L incubated with HeLa cells for 12 hours. In the right chart, the
colors of red, green and blue separately represent the environment of lysosome (pH<5.2),
late-endosome (pH 5.2 to 6), and others (pH>6) in HeLa cells. ... 86
Figure 3.31. The percentages of the three kinds of the pH variation types of (a) triple-
labeled MSN and (b) triple-labeled MSN@PM PEI@L. The colors of red, green and
purple separately represent acidification, basification and stabilization. ... 86
Figure 3.32. Histogram of average pH values of triple-labeled MSN@PM PEI@L
classified by three kinds of pH variation types, (a) acidification, (b) basification and (c)
stabilization. ... 87
Figure 3.33. Mechanism of the lysosome targeting of the YXXФ-mediated MSNs. .... 87
doi:10.6342/NTU201601239
XX
List of Tables
Table 1.1. Lysosomal Storage Diseases46 ... 21
Table 1.2. Endocytic pathways for the internalization of MSNs.50 ... 26
Table 1.3. Zeta-potentials and ED50 for cellular uptake of the MSNs.52 ... 28
Table 1.4. Examples of dileucine-based and tyrosine-based sorting signals.60 ... 34
doi:10.6342/NTU201601239
1
Chapter 1 General Introduction
Intracellular pH homeostasis plays a pivotal role in various cellular processes such
as endocytosis1, drug resistance2, cellular metabolism, cellular signaling, and cell
proliferation and apoptosis.3 In eukaryotic cells, the subcellular organelles are highly
compartmentalized for maintaining the specific pH values or function; for example,
lysosomes responsible for digestion processes have low pH values of 4─5.5 for activating
enzymes or denature proteins.4 Abnormal pH values are often associated with cell
dysfunction and can be observed in some diseases including cancer5, Alzheimer’s
disease6, and others. On the other hand, the real-time pH-sensing of nanoparticles in
endosome-lysosome pathway is also highly significant to design pH-sensitive drug
delivery systems.7 Thus, quantification of pH values and their fluctuation measured by a
nanosensor in living cells is very potential for understanding physiological and
pathological process, and even the special carrier design.
doi:10.6342/NTU201601239
2
1.1 Measuring Intracellular pH by Fluorescence
It has been known that measurement of intracellular pH has variety of techniques
including nuclear magnetic resonance (NMR), absorbance spectroscopy, proton-
permeable microelectrodes, and fluorescence imaging.8 Compared to other methods,
fluorescence-based techniques provide a more powerful tool for pH-sensing in intact cells
and subcellular regions, owing to their high sensitivity, outstanding spatial and temporal
resolution, and noninvasive feature.4 In particular, ratiometric measurement by detecting
fluorescence signals from two (or more) excitation or emission wavelengths of a pH
sensor can overcome the influence of fluctuation in the local probe concentration,
allowing reliable and accurate pH sensing.9
To detect the intracellular pH, a great amount of ratiometric fluorescence-based pH
nanosensors including quantum dot10, polymetric nanoparticle11, gold nanoparticle12,
nanogel13, Metal-organic framework14 and MSN15 have been reported in recent year.
Wenbin Lin et al.14 (Figure 1.1) developed a nanoscale metal-organic frameworks
(NMOFs) for ratiometric pH-sensing in living cells by covalently conjugating fluorescein
isothiocyanate (FITC) onto UiO NMOF. The pH-response of F-UiO exhibits the sensitive
dynamic range at pH = 5.0 ─ 7.0 depending on the pKa of the FITC. Gang Bao et al.10
(Figure 1.2) developed the pH nanosensor comprising a bright and photostable
semiconductor quantum dot (QD) and GEP-like FPs exhibits a Förster resonance energy
doi:10.6342/NTU201601239
3
transfer (FRET) effect and enables ratiometric measurement. The FRET pairs give
heightened sensitivity by eliciting opposing changes in fluorescence emission at two
wavelengths between pH 6 and 8.
Figure 1.1. Schematic presentation of F-UiO synthesis. (b) Correlation between FITC
absorbance and fluorescence at various FITC loadings. (c-e) pH-calibration curves of free
FITC (c) and F-UiO acquired by fluorimetry (d) and by confocal laser scanning
microscopy (e). 488/435 in the Y-axis represents I488/520/I435/520. (F) CLSM images
a)
b) c)
d) e)
f)
doi:10.6342/NTU201601239
4
showing the overlay of green (488 nm excitation) and red (435 nm excitation) colors of
F-UiO particles in HBSS buffers with different pHvalues.14
Figure 1.2. QD-FP FRET-based pH sensor. (a) Schematic demonstration of the pH-
dependent energy transfer between the quantum dot and fluorescent protein. In an acidic
environment, energy transfer to the FP FRET acceptor is minimal, yielding a high QD
signal; at neutral or basic pH, energy transfer is more efficient, producing an enhanced
FRET signal. (b) Absorbance spectroscopy indicates multiple proteins bound to each QD,
doi:10.6342/NTU201601239
5
as depicted in the inset. (c and d) Titration of QD-FP probes containg the FP acceptors
mOrange and mOrange M163K, respectively, showing increased energy transfer at
alkaline pHs with clear isosbestic points. Representative spectra of one of three
independent titrations are shown. (e) The ratio of acceptor emission to donor emission
increases with increasing pH for both probes. Data points are means ± standard deviations
for three independent titration. (f) The changes in the nanoprobe acceptor to donor ratios
are compared to the ratiometric signal change for the pH-sensitive fluorophore BCECF.
One representative titration is shown.10
However, a precise pH measurement in the endosome-lysosome region by using
ratiometric fluorescence-based pH nanosensors is often not well accomplished because
the nanosensors usually only have a narrow dynamic range.7 The limitation of the pH
sensing range results from the acid dissociation constant (Ka) of the pH-sensitive
fluorescence molecules, which exhibit a sigmoidal calibration curve in a pH range of the
pKa±1, as a rule of thumb, with a nonlinear relationship between fluorescence ratio and
pH. In several studies about endosome-lysosome system,16 the nanosensors with a
maximum range of two pH units often detect the pH out of the range of the sensors since
the pH variation has more than 2 pH units between early endosomes and lysosomes. The
result probably give misleading information and misinterpretation to the localization of
doi:10.6342/NTU201601239
6
the sensors in the living cell. Thus, developing a broad dynamic range of pH sensing is
very important for the research of the endosome-lysosome system. Here we focus on
developing the necessary features of the nanosensor such as good suspension, high
brightness and a broad pH-sensitive range for biomedical application with a 3D-single
particle tracing (SPT) microscopy technique.
1.2 Broadening the Sensing Range of Nano-Sized pH sensor
The pH-sensing ability of nanosensors reported in mostly former literatures is
usually limited since the pH value in some systems of living cells may falls outside the
limitation of the dynamic range and the read out nearing the limit is very reliable. For
improving the capacity of pH probe, novel designs of the nanosensors have been reported.
To break through the limitation of the dynamic measurement range, the triple-labeled
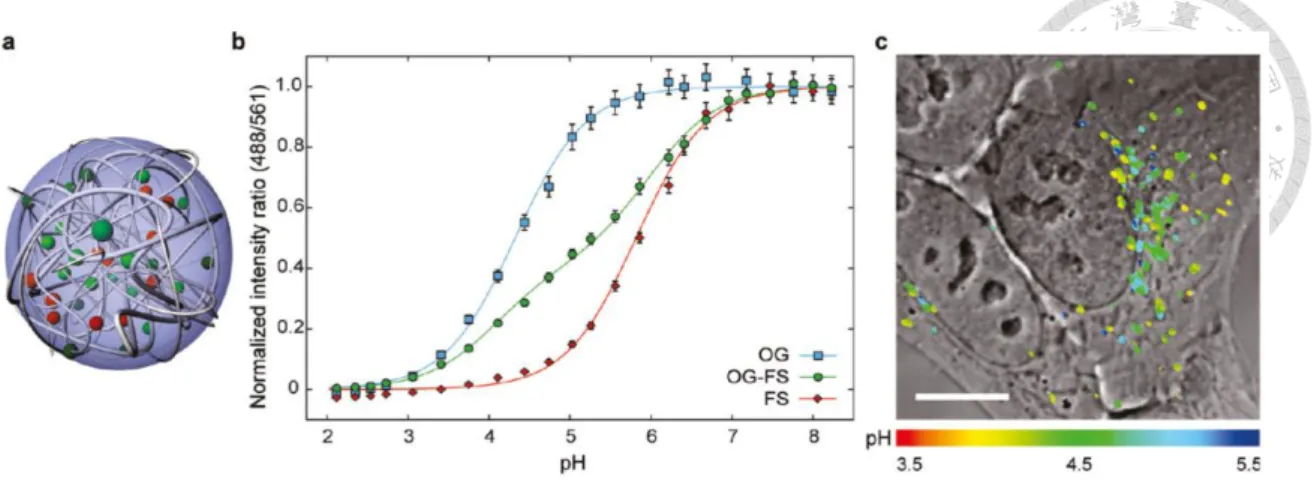
cross-linked polyacrylamide nanoparticles have been designed7. The triple-labeled
nanosensors were conjugated with two pH-sensitive dyes, fluorescein and Oregon Green,
and the pH-insensitive rhodamine B. The pKa values of Oregon Green (OG) and
fluorescein (FS) are 4.1 and 6.0, respectively. The mixing of the two dyes with different
pKa gives a doubling of the measurement pH range about 3.2-7.0 in comparison to
nanosensors with only one pH-sensitive fluorophore. The results are showed in Figure
1.3.7
doi:10.6342/NTU201601239
7
Figure 1.3. Schematic of the cross-linked poly acrylamide nanoparticle. (b) In vitro
calibration of the triple-labeled sensor with both OG and FS, and two dual-labeled sensors
with either OG or FS. (c) Uptake of the triple-labeled sensor by a HepG2 cell after 24h
and washing and imaged with confocal microscopy. Scale bar = 10µm. OG = Oregon
Green; FS = fluorescein.7
1.3 Fluorescence Microscopy with 3D-Single Particle Tracking Technique
Fluorescence microscopy is a powerful and common tool to collect cellular
information, such as the intracellular pH values, which is difficult to be detected using
conventional approaches. For continuous intracellular pH monitoring, three dimensional
(3D) single-particle tracking (SPT) spectroscopy is needed. 3D-SPT spectroscopy can
record the motion of individual particles in a complex system.17 It has been applied for
visualization of membrane dynamics,18 following protein traffic in living cells,19
evaluating the local viscosity conditions within the cells,20 and early stage of cellular
doi:10.6342/NTU201601239
8
uptake of nanoparticles.21 Two common 3D-SPT methods are categorized into active
(confocal feedback-based methods)19-20, 22 or passive (wide field imaging based
techniques)23 tracking techniques. The active method is a sophisticated technique
equipped with active feedback in x-y-z directions, and it requires higher cost and can only
focus on a single target at one time (Figure 1.4).22c In contrast, the passive technique
allows multiple single probes be detected simultaneously unless the emitters diffuse out
of the stationary detection region, which is about 1 µm in the z-axis around the focal plane
(Figure 1.5).23d Considering the potential of widespread applications, the passive 3D-SPT
technique is chosen to perform the 3D tracking of a nanoparticle, and the pH sensing.
In this work, the nanoparticles equipped with ratiometric pH sensing and imaging
ability is prepared by co-conjugating with the pH sensitive dyes, fluorescein
isothiocyanate (FITC) and Oregon Green® 488 (OG), and the reference dye, rhodamine
B isothiocyanate (RITC), into the MSNs. The 3D-SPT microscope combined with the
pH-sensing MSNs would be a powerful technique to the biomedical application. Here we
report the simultaneous real-time detection of the 3D trajectory of the pH sensors and the
local pH values in HeLa cells is a novel method for the evaluation of the traffic pathways
of the nanoparticles with the special surface modification. The transportation of the pH
sensors between endocytosis and cytoplasm has the significant pH variation, which is a
crucial information for the design of the particular drug delivery system.
doi:10.6342/NTU201601239
9
Figure 1.4. Schematic of the confocal 3-D tracking microscope optical configuration.
The fiber optic pairs are configured to form a 3-D tetrahedron-like detection volume in
sample space.22c
doi:10.6342/NTU201601239
10
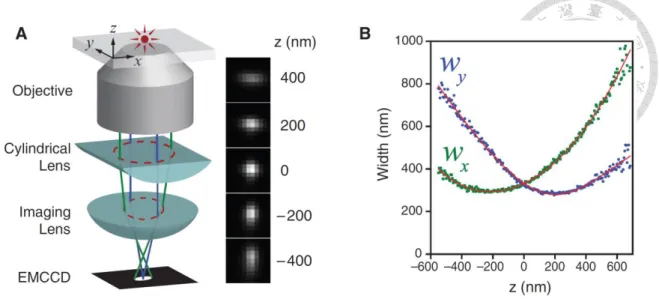
Figure 1.5. The scheme of 3D STORM. (A) Three-dimensional localization of individual
fluorophores. The simplified optical diagram illustrates the principle of determining the
z coordinate of a fluorescent object from the ellipticity of its image by introducing a
cylindrical lens into the imaging path. The right panel shows images of a fluorophore at
various z positions. EMCCD, electron-multiplying charge-coupled device. (B)
Calibration curve of image widths Wx and Wy as a function of z obtained from single
Alexa 647 molecules. Each data point represents the average value obtained from six
molecules. The data were fit to a defocusing function (red curve).23d
doi:10.6342/NTU201601239
11
1.4 Introduction to Mesoporous Silica Nanoparticles (MSNs)
Based on the combination of sol-gel chemistry and liquid-crystalline templating
technique, mesoporous silica was discovered and named as MCM-41 (Mobil Crystalline
Materials number 41) by researchers at Mobil Oil Corporation in the early 1990s.24 Since
then, a massive study has been devoted to the synthesis of mesoporous silica nanoparticles
with multiple features and functions.25 The multi-functional mesoporous silica materials
with controlled morphologies,26 particle size,27 and excellent thermal stability28 have
received tremendous attention because of their unique physicochemical properties such
as large surface area, uniform pore size, available for further modification of diverse
functional groups, and good biocompatibility.29 In the past few decades, the more
mesoporous silica materials (M41S family) were fabricated based on the concept of the
formation of MCM-41, and the discovery of MCM-41 is believed to the starting point of
ordered-mesoporous-material research. The members of M41S include MCM-41
(hexagonal phase), MCM-48 (cubic phase), and MCM-50 (lamellar phase)30. The
structures are shown in Figure1.6.
doi:10.6342/NTU201601239
12
Figure 1.6. Structures of mesoporous M41S materials: (a) MCM-41 (2D hexagonal,
space group p6mm), (b) MCM-48 (cubic, space group Ia3d), and (c) MCM-50 (lamellar,
space group p2).30
1.4.1 Synthesis Mechanism of MSNs
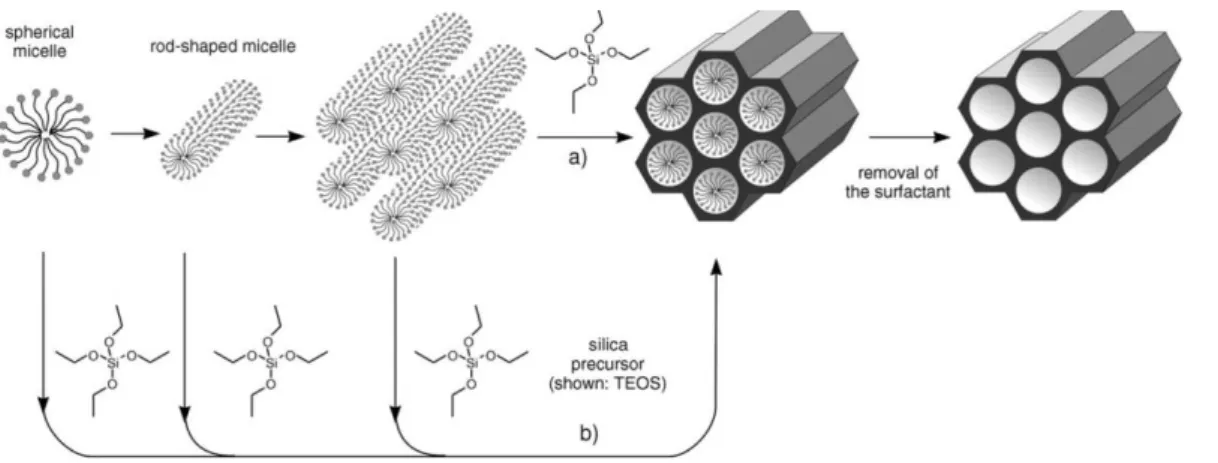
In order to explain the construction of MCM-41, the‘liquid-crystal templating’
(LCT) mechanism based on the similarity between the mesostructure of lyotropic liquid
crystals from surfactant assemblies and the structures of M41S materials was suggested
by Beck24, 31. There are two main general pathways in this mechanism, in which either (i)
the liquid-crystal phase pre-exists before the silicate species are added or (ii) the addition
of the silicate anions promotes the long-range ordering of the surfactant to form the
hexagonal arrangement (Figure 1.7).30
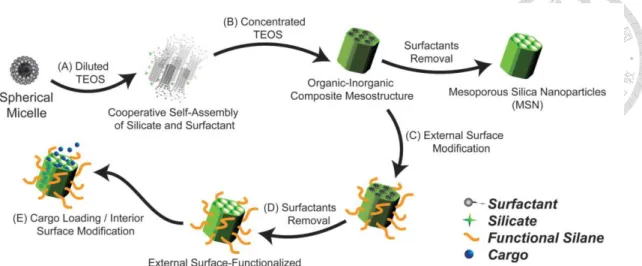
The synthesis of mono-disperse MSNs is based on the method which was developed
by Mou and co-workers with the separation of nuclei formation and particle growth into
two steps in a dilute alkaline solution.32 The method can be realized in a LaMer diagram
of concentration variation during nucleation and growth. In the first step (step (A), Figure
doi:10.6342/NTU201601239
13
1.8), the full amount of surfactant (CTAB) and a small amount of TEOS are mixed to
create a clear solution of micelle/silicate clusters containing nuclei. Then, a larger amount
of TEOS is added to start the growth process without further nucleation (step (B), Figure
1.8). Eventually, with the accelerating of the growth process, the materials are exhausted
and a uniform finite size is formed.33
In addition, the size of the MSNs can be modulated by controlling the pH (10.86 ─
11.52) of the reaction solution (Figure 1.9).34 A lower pH provided a smaller size of MSN
due to the increased condensation rate and thus more nuclei (Figure 2.0).34
Figure 1.7. Formation of mesoporous materials by structure-directing agent: (a) true
liquid-crystal template mechanism, (b) cooperative liquid-crystal template mechanism.30
doi:10.6342/NTU201601239
14
Figure 1.8. Schematic illustration for the synthesis and selective functionalization of
MSNs.33
Figure 1.9. TEM images of mesoporous silica with different average sizes: (a) 280 nm;
inset: FFT analysis of the TEM image; (b) 170, (c) 110, (d) 50, (e) 30 nm. (f) High-
resolution TEM image of a single particle in (c).34
doi:10.6342/NTU201601239
15
Figure 1.10. Effect of pH value on the silica condensation rate, charge properties and
charge density on the surface of the silica species.34
1.4.2 Applications of MSNs
The MSNs have been utilized to many application like drug/enzyme delivery, 25b, 35
imaging32, 36 and pH sensing.15 Generally, chemical functionalized MSNs were
synthesized by one-step or two-step method: (i) co-condensation reaction and (ii) post-
synthetic grafting process, both of which are schemed in Figure 1.11.37 In co-
condensation reaction, the functional silane is mixed with silicate precursor and added to
the surfactant-contained basic aqueous solution. As the result the functional silane will be
either confined in the structure or grafted on the surface of MSNs. On the other hand in
post-synthetic grafting method, the functional silane is added after the surfactant of the
as-synthesized MSN is removed. Due to the densely distributed silanol groups on the
surface of the MSNs, the functional silane or other chemicals can be easily modified on
the wall of channels and/or the external surface.
doi:10.6342/NTU201601239
16
Figure 1.11. Functionalization of MSNs by co-condensation (top) or the post-synthetic
method (bottom). A trialkoxysilane molecule bearing a functional group (green) is shown
as an example of a silica precursor. The structure-directing agent is represented by
micelles (red).37
The ability to trap and release molecules from MSNs gives the promise in sensor
and drug-delivery applications. Hence various stimuli-responsive controlled release
systems which are able to respond to environmental changes, such as pH value, redox
potential, temperature, photo-irradiation, and biomolecules have been achieved.38 For
example, Feng et al. has introduced a responsive polymer-coated mesoporous silica as a
pH-sensitive nanocarrier, in which a pH-responsive polymer poly(4-vinyl pyridine) is
doi:10.6342/NTU201601239
17
coated on mesoporous silica through the facile post-synthetic grafting method. The
grafted polymer nanoshell can serve as a pH-sensitive valve to control the release of
trapped molecules from mesoporous silica.39 The nanoscale MSNs are suitable for the
cellular uptake and thus the MSNs conjugated with fluorescent molecules can be utilized
as the cell markers.32 Moreover, a fluorescent dye-loaded MSNs can also be used to
measure the local pH value in living cells.40
1.5 Ratiometric pH Sensor based on Mesoporous Silica Nanoparticles
It has been known the ratiometric pH sensing based on the fluorescent molecules is
a powerful tool in recent years. Moreover, The sensors with the manner of Förster
resonance energy transfer (FRET) are more potential because they have following unique
advantages: (i) they can render dual or multiple emissions under a single-wavelength
excitation, providing more convenient and effective ratiometric detection superior to
those that require two excitation wavelengths and (ii) they give great flexibility for sensor
design by changing the FRET components.15 However, the construction of ratiometric pH
sensors with the application of FRET is still infancy despite the pH monitoring has a great
demand in many fields like medicine, biology and the environment. In the past study,
there are some pH sensors which use FRET between quantum dots (QDs) and analyte
doi:10.6342/NTU201601239
18
responsive dye have been reported.10, 41 However, the cytotoxicity of ODs and difficulties
in acquiring modified ODs limit their applications.15
MSNs hold great promise as a platform for the design of a FRET-based ratiometric
pH sensors due to their high stability, large surface areas, tunable pore sizes, abundant
surface functionalization sites and biocompatibility.42 In this study, the MSNs conjugated
with two pH-sensitive dyes, FITC and OG, and one referent dye, RITC, were prepared
by the co-condensation reaction at the ammonia-catalyzed condition. The FITC and OG
on pH sensors can be excited by a single-wavelength (473 nm), and RITC can receive the
energy by the FRET effect. Thus, simultaneously detecting the emissions from the three
fluorescent molecules can be achieved. In addition, the dynamic range of the pH sensing
almost covers the entire physiological environment from pH 4.3 to pH 7.4 by utilizing the
different pKa of FITC and OG. On the other hand, the MSNs modified with PEG have
excellent suspension in medium (DMEM+FBS+P/S) for appropriate biomedical
applications. Therefore, the dyes-conjugated MSNs would be a potential sensors for pH
sensing in living cells.
doi:10.6342/NTU201601239
19
1.6 Lysosome-Targeting Nanocarriers for Lysosomal Storage Disorder Therapy
1.6.1 Introduction to LSD
Lysosomal storage diseases (LSD) comprise about 50 diseases in which the
deficiency of a single lysosomal enzyme results in the progressive accumulation of
undegraded substrates in the lysosomes in cells of most tissues.43 Lysosomal dysfunction
has also been indicated as a significant risk factor for a variety of other disease,44
especially neurodegenerative diseases.45 The pathology related to substrate accumulation
can vary remarkably depending on the specific storage material, where the materials
accumulate, as well as the degree to which the activity of enzymes is compromised.46 The
enzyme activity losing completely or near completely would result in the most severe
pathology, often at the early stage and death in the first few years of life. On the other
hand, the residual activity of some lysosomal enzymes would lead to pathology that is
often not diagnosed until adolescence or later. Although each LSD is individually
somewhat rare, as a group they have an incidence of about 1 per 7,000 to 8,000 live births,
with regional and genetic population variation.47 Some of the most common LSDs, the
affected enzymes, and the accumulated storage products are listed in Table 1.1.46
In the United States, the term “enzyme replacement therapy” (ERT) refer to a
doi:10.6342/NTU201601239
20
group of nine commercially available glycoprotein products, each intended to enhance or
replace the activity of a specific endogenous catabolic enzyme within cellular
lysosomes.47 This strategy works is that lysosomal enzymes contain oligosaccharide
residue such as mannose 6-phosphate (M6P) which can bind to cellular receptors like
M6P receptors (M6PR), resulting in internalization of the enzymes by clathrin-mediated
endocytosis and subsequently trafficking to lysosomes.48 However, poor access of
recombinant enzymes to these tissues, the altered M6PR expression in LSDs, and immune
reaction against the injected enzyme reduce the therapy effect.49 Thus, these factor
emphasizes the need for alternative therapeutic options.
A strategy that enhances delivery of lysosomal enzymes is that of loading the
enzymes to nanocarriers which have ability to efficiently target the specific site and
prevent from the attack of the immune system. In order to achieve the purpose, a lysosome
targeting nanoccarier is essential. The MSN is a suitable material to be utilized for
designing the lysosome targeting nanoccariers because of their large surface areas,
mesoporous properties, and simply being modified.
doi:10.6342/NTU201601239
21
Table 1.1. Lysosomal storage diseases46
1.6.2 The Trafficking of MSNs in Living Cells
The cell membranes are usually the most important barrier for intracellular drug
delivery. Clear understanding of the pathways for the cellular internalization of MSNs is
a significant for many of its applications in biomedicine and biotechnology. There are
various pathways for internalization of external materials in mammalian cells. In general,
these mechanisms can be divided in two categories: pinocytosis and phagocytosis (Figure
1.12).50 The cells can utilize any of these internalization process depending on the size of the particles. The cellular uptake of small particles (< 200 ─ 300nm) such as MSNs is
usually involved in endocytosis for the majority of cases.51 The mechanisms of
endocytosis that transport the MSNs into the cells include clathrin-dependent, caveolin-
dependent, receptor-mediated, and clathrin- and caveolin-independent processes (Figure
doi:10.6342/NTU201601239
22
1.12).50 So far there is no specific endocytic pathways that either MSNs or functionalized
MSNs materials will follow when they are internalized by cells. Hence thorough
understanding and controlling the internalization pathway is of extreme importance in the
development of drug delivery platforms. The endocytic pathways of MSNs with different
functional groups have been studied (Table 1.2).50 In addition to the different
functionalization, the MSNs with various surface charge, shape or size also have effect
on the cellular uptake.50
After the MSNs overcome the cell membrane barrier and enter cells by endocytic
pathways, the series of events can be divided into the following sequence: the MSNs are
first transported to primary endosomes followed by transport to sorting endosomes. And
then, a fraction of MSNs are directed back to the cell exterior through recycling
endosomes, while the remaining fraction is transported to secondary endosomes that fuse
with lysosomes. And then the MSNs escape from the endolysosomes into the cytosolic
compartment (Figure 1.13).50 On the other hand, MSNs with different surface properties
could quickly escape the early-endosomes before they reach the lysosomes. For example,
the effect of the surface charge of MSNs were studied by S.-Y. Lin et al..52 The FITC-
MSNs with the diameter of 150 nm separately modified with different functional groups
(AP-, GP-, GEGP-, and FAP-) have the different surface charge and 50% effective dose
(ED50) as shown in Table 1.3.52 The results exhibit the more negatively charged FITC-
doi:10.6342/NTU201601239
23
and AP-MSNs appear to be able to escape from endosomes within 6 hours, while those
with more positive surface charge, such as GP-, GEGP- and FAP-MSNs, remained
trapped within endosomes (Figure 1.14)52. This behavior demonstrate the more negatively
charged materials have the better Proton Sponge effect or buffering capacity which is
important for the endosome escape.53 The proton sponge effect implies that the weak acid
or basic compounds such as polyethyleneimine (PEI) buffers the protons being pumped
into the lysosomal compartment by the v-ATPase (proton pump). This results in
heightened pump activity, leading to the accumulation of a Cl─ and a water molecule for
each proton that is retained; ultimately, this leads to osmotic rupture of the endosome.54
The negatively charged MSNs by surface attachment of phosphonate groups (MSN-PP)
and positively charged MSNs by conjugating quaternary ammonium groups (MSN-TA)
to FITC&RITC@MSN were also researched by C.-Y. Mou et al.40 The results suggest the
presence of positively charged MSN-TA in the cytoplasm, but negatively charged MSN-
PP is probably trapped in the endosome/lysosome analyzed by the pH detection (Figure
1.15) and confocal images (Figure 1.16).40 The MSNs coated with polyethyleneimine
(PEI) for the delivery of siRNA and DNA construct is also reported by Andre E. Nel et
al.54 PEI (10k)-coated MSN (100-130 nm in diameter) is a versatile delivery system that
can facilitate cellular uptake to increase drug delivery payload and also be utilized to
improve nucleic acids delivery into cytoplasm with the proton sponge effect. David
doi:10.6342/NTU201601239
24
Oupicky et al. reported the polycation- (PDMAEMA or PDEAEMA) and PEG-coated
mesoporous silica nanoparticles were able to successfully deliver plasmid DNA and
siRNA in cell culture.55 Shi Zhang Qiao et al. also reported that the poly-L-lysine-
functionalized large-pore MSNs with cubic mesostructured have a true potential for
delivery of nucleic acids into HeLa cells for gene therapy applications.56 The effect of
different sizes and surface charge of the naked MSNs on the cellular trafficking were also
studied by Ciro Isidoro et al.57 They found the 10 nm naked MSNs can quickly
accumulate in lysosome in 5 minutes with the almost 98% co-localization, while more
90% of MSNs escaped the lysosomes at 30 minutes (Figure 1.17)57. Moreover, the
increasing size from 10 nm to 50 nm reduces the uptake efficiency of MSNs. The
negatively charged groups (-COOH) impair endocytosis of MSNs regardless of the
presence or absence of caveolin-1 on the plasma membrane, and the 50 nm MSNs
functionalized or not with either COOH or NH2 groups would all enter and reside
permanently in lysosomes (Figure 1.18).57 Shoufa Han et al. reported the internalized
R6G-FITC-MSNs with post modification of PEG (110 nm in diameter, surface charge : -
6.76 mV) are site-specifically delivered into lysosomes (Figure 1.19).58 The effect of
spherical mesoporous silica (MS) nano- and microparticles with the treatment of
extraction (E-MS) or calcination (C-MS) on the intracellular localization was also
investigated by Yaping Li et al.59 The results qualitatively indicate the intracellular
doi:10.6342/NTU201601239
25
distribution of RhB-labeled MS-1, 2, and 3 particles (190 nm, 420 nm, and 1220 nm) in
lysosomes, but there is a very limited number of the E-MS-3 can enter the MDA-MB-468
cells and locate in lysosomes, compared to the E-MS-1 and E-MS-2 with a much larger
number in lysosomes. However, the behavior of the C-MS is largely different from that
of the E-MS. Only a limited number of C-MS particles can go into cells and accumulate
in lysosomes, even at the particle size of 190 nm (Figure 1.20).59 From the above research,
we found the MSNs reaching the lysosomes involve the various factors such as size, shape,
surface charge, surface functionalization, and even the method of surfactant removing.
Thus, designing a lysosome-targeting MSNs by adjusting these elements is very
ineffective. In this study, we would modify the MSNs with a lysosome targeting peptide.
If the peptide could successfully deliver MSNs into the lysosomes in living cells by a
biological mechanism, that would be a more convenient and effective manner for
targeting lysosomes of nanoparticles.
doi:10.6342/NTU201601239
26
Figure 1.12. Pathways of mesoporous silica nanoparticles for entry into cells. Large
particles are internalized by phagocytosis, whereas fluid uptake occurs by
micropinocytosis. In the case of MSN materials, most internalization is via endocytic
pathways. These pathways differ with regard to the nature of the surface functionalization
and structural properties of MSNs.50
Table 1.2. Endocytic pathways for the internalization of MSNs.50
doi:10.6342/NTU201601239
27
Figure 1.13. Intracellular trafficking of mesoporous silica nanoparticles. (a) MSNs are
wrapped through specific (ligand-receptor) and nonspecific (hydrophobic, Coulombic)
binding interaction. (b) Once the MSNs are internalized, depending on the endocytic
pathway, it can be delivered to intermediate compartments (e.g., caveosomes). (c) Later
these compartments are transported to early endosomes and then to sorting endosomes.
From sorting endosomes, a fraction of the MSNs are sorted back to the cell exterior
through recycling endosomes (not shown in the scheme). (d) The remaining fraction is
transported to secondary endosomes, (e) which then fuse with lysosomes. (f) The MSNs
escape the endolysosomes and enter the cytosolic compartment.50
doi:10.6342/NTU201601239
28
Table 1.3. Zeta-potentials and ED50 for cellular uptake of the MSNs.52
Figure 1.14. Confocal fluorescence images of HeLa cells stained with FM 4-64 and 40
µg/mL suspensions of (a) FITC-MSN and (b) FAP-MSN after 6 hours of introduction.
The fluorescent images (left) show the MSNs (green) and FM 4-64-labeled endosomes
(red) are shown on the right.52
doi:10.6342/NTU201601239
29
Figure 1.15. Ratiometric imaging of pH in various intracellular compartments using
confocal microscopy. HeLa cells were incubated at 37 ℃ with MSN-PP and MSN-TA
for 4 hours, respectively. The images (overlaid on bright field) of pH sensors in HeLa
cells showing (a) MSN-PP, and (b) MSN-TA.40
Figure 1.16. Confocal microscopy analysis of (a) MSN-PP and (b) MSN-TA in HeLa
cells. The living unfixed cells were co-treated with endosome-specific marker FM 4-64
(5 µg/mL) and analyzed by confocal microscopy for an endosomal co-localization image.
The fluorescent images show the MSNs (green, FITC and red, RITC) and FM 4-64-
labeled endosomes (blue).40
(a) (b)
doi:10.6342/NTU201601239
30
Figure 1.17. Confocal images of 10 nm mesoporous silica nanoparticles with lysosomes.
Cells adherent on coverslips were preincubated for 10 minutes with Lysotracker Green or
Red, then washed and incubated with nanoparticles, and imaged at 1, 5, and 30 minutes.57
Figure 1.18. Comparison of uptake and intracellular localization of 50 nm mesoporous
silica nanoparticles functionalized or not with either COOH or NH2 groups in SKOV3
and NIH-OVCAR cells after incubation times of one and 24 hours with 20 µg of
nanoparticles.57
doi:10.6342/NTU201601239
31
Figure 1.19. Intracellular distributions of R6G-FITC-MSNs as compared to LysoTracker
Blue DND-22. Bar, 10 µm.58
Figure 1.20. The intracellular localization of spherical MS nano- and microparticles with
different sizes within lysosomes of MDA-MB-468 cells. (a) E-MS-1 (190 nm), (b) E-MS-
2 (420 nm), (c) E-MS-3 (1220 nm), (d) C-MS-1 (190 nm), (e) C-MS-2 (420 nm), and (f)
C-MS-3 (1220 nm).59