i
國立臺灣大學電機資訊學院網路與多媒體所 碩士論文
Department of Graduate Institute of and Networking and Multimedia College of Electrical Engineering and Computer Science
National Taiwan University Master Thesis
使用角色及主題資訊偵測新聞事件關係
News Event Relationship Detection Using Role and Topic information
朱崇賓 Chu Chun-Bin
指導教授:鄭卜壬 博士 Advisor: Cheng Pu-Jen, Ph.D.
中華民國 98 年 7 月 July, 2009
ii
摘要
用事件流程圖的方式來理解新聞發展的來龍去脈,比直接去瀏覽整個相關
新聞列表來的有效率且容易吸收.而要建立一個事件流程圖,我們必須先找出新聞
事件之間的關係,才能將它們串接起來.
這篇論文提出了一個能夠自動偵測事件關係的方法.我們的方法是基於兩
個事件的相似度來判斷它們是否具有前後關係.有別於單純的相似度運算,我們不
只考慮到事件的主題,也考慮到事件中名稱實體所扮演的角色.在這篇論文中,主題
是用來描述這個事件的輪廓,我們可以用主題來了解這個事件是在屬於哪一類型的
新聞.而角色是代表一個命名實體在新聞事件中的行為,處境..等概念,即 代表一個
實體在新聞事件中所扮演的角色.
這篇論文會介紹我們如何運用主題及角色的概念來偵測新聞事件的前後關係,
以及做一些實驗來證明這個方法的可行性.
iii
Abstract
Reading the evolution graph of news events is much easier than browsing the news
events in a list. To construct the evolution graph, we have to detect the dependent
relationship between news events.
In this paper we present a method to automatically detect the evolution of news
events. Our method is based on the similarity between news events, our method
considers not only the characteristic of news events, but also considers the roles played
by entity names in news events. The characteristic of news events could be defined as
the topic of these news events, we can roughly understand what happened about these
news events by topic information. The role means the concept behind a name entity
which describe the name entities’ behavior, situation…etc. The same entity name might
play different roles in different news events. We will introduce how we use the role and
topic information to detect the relationship between news events.
iv
Table of Contents
摘要 ii
Abstract iii
Chapter 1
Introduction ... 1
1.1 Motivations ... 1
1.2 Previous Work ... 3
1.3 Problem Definition ... 4
1.4 Basic Idea ... 5
1.5 Challenges ... 6
1.6 Thesis Organization ... 7
Chapter 2
Relate Work ... 8
2.1 Topic Detection and Tracking (TDT) ... 8
2.2 Event Threading ... 10
Chapter 3
Model the News Article ... 12
3.1 Analysis of News Articles ... 12
3.2 Modeling the News Article ... 13
v
3.3 The Role ... 14
3.4 The Topic ... 21
3.5 Review of the Model ... 22
Chapter 4
Relationship Detection ... 24
4.1 Operations ... 24
4.2 Similarity between Documents ... 25
4.3 Role Similarity and Topic Similarity ... 29
4.4 Discussion ... 30
Chapter 5
Experiments ... 31
5.1 Overview ... 31
5.2 Dataset ... 32
5.3 Evaluation ... 33
5.4 Baseline ... 34
5.5 Experiment 1. Different Weight ... 35
5.6 Experiment 2: Window Size ... 43
5.7 Experiment 3: Different Feature Word ... 45
5.8 Experiment 4: Different Feature Size ... 46
Chapter 6
Conclusion and Future Work ... 48
vi
6.1 Conclusion ... 48 6.2 Application ... 49 6.3 Future Work ... 50
vii
Table of Figures
Figure 1.
News Articles Displayed as An List. ... 2
Figure 2.
Evolution Graph ... 3
Figure 3.
Document and roles ... 28
Figure 4.
αCalculating ... 29
Figure 5.
Experiment Process Graph ... 32
Figure 6.
News Articles After Splitting. ... 33
Figure 7.
Evolution Graph of Baseline ... 41
Figure 8.
Evolution Graph of Static Ally Weight ... 41
Figure 9.
Evolution Graph of Dynamic Ally Weight ... 42
Figure 10.
Result of Different Window Size ... 43
Figure 11.
Evolution Graph ... 49
viii
Table of Tables
Table 1.
Weight of role and topic parts ... 27
Table 2.
Static Weight Result (Single) ... 36
Table 3.
Static Weight Result (Combine) ... 38
Table 4.
Static Weight Result (All) ... 39
Table 5.
Dynamic Weight Result ... 41
Table 6.
Static Window Size ... 44
Table 7.
Some Persons’ Precision in Different Window Sizes ... 45
Table 8.
The Result of Bigram Feature Words ... 46
Table 9.
The Result of Different Feature Sizes ... 47
1
Chapter 1 Introduction
1.1 Motivations
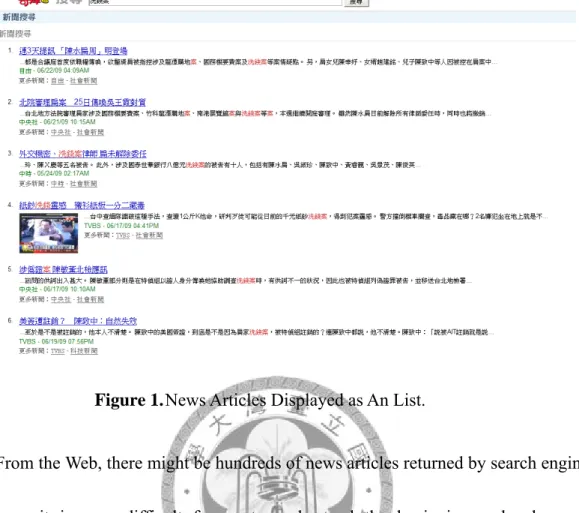
Every time we read a news article of interest to us, we might be also interested in the beginning and subsequent development of this news article. For example, when we go home from a travel, we have no idea about what happened these days. By sending the keywords about the news to search engines, we can get lots of related articles from the Web (For example, the Web pages of Yahoo! News or Google News), which are of interested to us. Besides, we can future look for related articles supported by many online news websites. These related articles have relevant topics to the news article we are reading. Figure 1 shows an example of this scenario.
2
Figure 1. News Articles Displayed as An List.
From the Web, there might be hundreds of news articles returned by search engines.
However, it is very difficult for us to understand the beginning and subsequent development of the events[3]. Originally, the returned by search engines list is sorted by the relevance scores between the query and documents, instead of the relationship of the news articles in a temporal order. We have to analyze such relations and determine the order of these news articles by ourselves. In addition, to browse such a huge amount of news articles is a hard job and time consuming.
Is there a better way to display the news articles which is easier for users to understand? The answer is yes. If search results can be displayed as “Evolution Graph”
like Figure 2, users will more easily realize what happened in the beginning and the development of an event.
gene
1.2
used
diffe reapp articl
How to de rate the evo
Previo
Before talk in this wor
1. Story: A
2. Event:
3. Topic:
The goal o rent topics pearance of les are in th
etect the re olution grap
ous Wor
king about t rk:
A news arti Something A set of new of TDT (top s and dete
f them. By he related t
Figure 2.
lationship b ph are the m
rk
the evolutio
icle deliveri g happens at ws stories st pic detectio ect the app y this meth
topic, whic
3
Evolution G
between ne major topics
on of news
ing some inf t some spec
trongly con on and track
pearance o hod, we can
h we are in Graph
ews articles discussed in
articles, we
formation to ific time an nnected by a king) is to of new top n understan nterested in
s and how n this thesis
e first introd
o users.
nd place.
a seminal ev organize ne pics and f
nd which t n, but still d
to automat s.
duce some t
vent.
ews articles for tracking topics and do not know
ically
terms
s into g the
news w the
4
beginning and subsequent development of this news article.
How to detect the evolution of events has been discussed for years by the study of
“event threading”. Event threading not only detects the events within a topic but also captures the dependencies between events. Some previous studies about event threading used the content similarity as the feature to detect the dependency between news events.
Some considered the person name and location as the features, and most of them used the feature of time information.
We will introduce the TDT and event threading deeply in Chapter 2.
1.3 Problem Definition
As mentioned, our goal in this work is to detect the evolution between news events in the topic which we are interested in. To detect the evolution, we have to detect the relationship between news events.
To achieve our goal, first we have to select some news articles as input. We choose the news articles which are found in the online news websites by searching with a query.
We are interested in or look the related news articles developed by TDT technique as input. The input data also contains the time information, for example, the date and time of this news is released. In our work, we make an assumption that each news article is viewed as a news event.
Besides the input information, we have to decide the output information we want.
5
In this work, our experiment output will be the relationships between news articles.
We hope that our system can work in all domains or every news articles set that searched by a query. It will not be limit in specific topic and will be done automatic ally without too much assumption on what kind of news articles they are.
1.4 Basic Idea
To detect the evolution of events, we will start from the observation of events.
There are some sentences talking about what event or news event is:
"Every newspaper reporter should answer the questions, What? Who? Where?
When? Why?" [14]
An event is a specific thing that happens at a specific time.[15]
From the above sentences, it tells us that most events are consisted of five elements:
person, thing, time, location, and object. We could use this information to detect the relationship between events.
How do we use this information to detect the evolution of events? We split the elements besides time information into two classes: role and topic.
1. Role:
In our observation, it is obvious that most of the news happened around persons, locations, and organizations, and every name entity plays a special role in the news articles they belong to. The role is defined to be the person’s or thing’s
6
function in a particular situation. For example, Chien-Ming Wang(王建民) plays a role of a pitcher in a news article but plays a role of a father in another news article.
We believe that if we can distinguish the different roles which the names play in every news articles, it would be helpful to detect the relationships between news events.
2. Topic:
The idea comes that the topic is to roughly describe the concept of a news article, and we could initially know what this news article is described by the topics. For example, in an earthquake news report, the topic might contain the terms like amplitude, epicenter, rescue, etc.
We will discuss how and why the role and topic help to detect the relationship of news articles in this thesis.
1.5 Challenges
Challenge1. How to model the news articles
As mentioned in last section, our basic idea is using the role and topic information to detect the relationship between news events. Let’s discuss what challenge we will meet about the role part at first.
It is easy for human being to recognize the roles played by name entities in
7
different news events, but it is not easy to identify this kind of information by a computer. How to automatically identify the concept behind a name entity in news articles will be a big challenge to our work.
Secondly, the topic part either exist some challenges. What kind of information should be extracted from news articles to be the topic information of the news events?
And how do we extract this information?
Challenge2. How to calculate the relationship between news articles
After modeling the news articles, the next problem we will face to is how to use this information to calculate the relationship between news articles.
We will develop some operations which will help to calculate the relationship between news events for the model. What information should we consider? How do we calculate the role similarity and the topic similarity? How do we determine the weight of a name entity’s role in news events?
1.6 Thesis Organization
We will introduce the related work in Chapter 2. Chapter 3 will describe how we model a news article. Chapter 4 illustrates the operations to calculate the relationship between news articles. Chapter 5 introduces our experiments and discusses each experiment’s motivation and results. Chapter 6 is the conclusion of this thesis.
8
Chapter 2 Relate Work
There are two studies are strongly related to evolution detection. The first one is topic detection and tracking (TDT), this study detects topics from a news story stream and put the news stories with the same topic together. The second one is event threading, which to capture the evolution of events in a specific topic. We will introduce this two studies in this Chapter.
2.1 Topic Detection and Tracking (TDT)
News events happening in every second, when facing such a huge amount of news information, it’s difficult for human being to organization these information. One study named topic detection and tracking is to deal with this problem.
Topic detection and tracking (TDT) has some tasks to organize the news articles
stream. The term “topic” in the study of TDT is defined to be a set of news articles which are strongly related to some seminal real-world event or in other words it defined to be a seminal event or activity, along with all directly related events and activities. For example, the quake at somewhere, any discuss of this quake like finding a survivor in some
9
building or aftershock at some place near the position of quake, and so on, are all part of the topic.
The TDT system detects topics and tracks all their related documents [7][8][9].
Topic detection detects clusters of stories that discuss the same topic, and topic tracking detects stories that discuss a previously known topic. This work contains some methods based on semantic word networks [12], and some based on the vector space model [13].
TDT focus on five tasks as below[5]:
1. Article segmentation: To segment a continuous stream of text (including
transcribed speech) into its constituent stories.
2. First Article Detection (or New Article Detection): The goal of this task (FTD) is to detect the topic which didn’t have been discussed before when a news article which is talked about it appear.
3. Cluster Detection: The goal of cluster detection is to cluster the news articles on the same topics into bins. When a first article arriving, we should create a new bin to prepare to put the news articles which might happen in the future.
4. Tracking: We track the news stream, when a news articles arrive, it should to
recognize which one topic the news article is related to .
By the way, we could assign a news articles to one of all topics which has been detected by first article detection just if the news article does not create a
10
new topic.
5. Article Link Detection: We choose two news articles randomly and then detect
are these two news articles related to the same topic.
The study of TDT discuss a lot about how to organize news articles into different topics, but if we want to know the beginning and subsequent development of one news event, for example news events in the same topic, we need to build the evolution of news events[3]. In the next we will introduce a study of event threading which to construct the evolution of events.
2.2 Event Threading
The study of event threading detects the dependencies among events; it could dig out the relationship between a pair of events. Detecting the dependencies of events would help to construct the evolution graph.
As our knowing, there are some studies of event threading to detect the dependency between events. At first, Uramoto and Takeda provide the evolution graph and used document content similarity to detect the relationship between news articles [4]. Chien Chin Chen and Meng Chang Chen use temporal similarity (TS) to associate events, the TS is multiplied by temporal weighting and text similarity between events [3]. Nallapati cluster related stories into events by person, location, content and time information, and then detect the dependency between events by content similarity and
11
nearest parent node[1]. Mei and Zhai build unigram language model for each events and used KL divergence to measure distance between events[2].
Besides the evolution detection by documents, there are some works to detect the evolution of events by video news reports[6][10][11].
12
Chapter 3 Model the News Article
3.1 Analysis of News Articles
News articles always exist with some information: When it happened or published?
Where it happened? Who are appeared in it? What happened about person, place or organization?
As an observation, we found that most of the news happened around persons, locations, organizations, and every entity names play a special role in the news articles they belong to. We believe that if we can distinguish the different roles which the names play in every news articles by a same name, it would be helpful to detection the relationships between news articles. We named the names in news articles as “Role words”.
Beside role words, some words either play important roles in news articles which to roughly describe the achievement of a news article (like the word “quake”).
Observing these words would help us understand what happened in this news article, and initially knowing what this news article is described, besides the information like
13
where and who. We define the kind of words as “Topic words”.
3.2 Modeling the News Article
As the observation of article, we make an assumption that role information and topic information will help us in detect relationship between news events. In this section, we will introduce how we project the news article into a model which contained the role and topic information in order to help relationship detection.
At first, we introduce the document of the news article.
Definition:
D(Document) : A document (vector) modeled by a news article, and it is consist of
4-tuple.
D = < E , RS , TS , Z >
E(Event) : The event which the News article describe about. In our thesis, we
make an assumption that every news article is an event, so each news document has its own event information.
RS(Role Set) :
Role set of a document. Each name entity in the document corresponds to a role, and each role contains the behavior information of the name entity. The RS consist of three kinds of roles; include person roles, location roles and organization roles. We will deeply introduce the construct of topic part in next section.
14
TS(Topic Set) :
Topic set of a document, containing the topic information about topic words. We will deeply introduce the construct of topic part in section 7.4.
Z(Time Stamp) :
Time information of this topic, it might be the date this news article published, or the time interval the news article assigned in.
3.3 The Role
In section 3.2, we know that a document contains a role set which consist of roles, before introducing the structure and how to build it in this section, we explain the reason of using the role information in this thesis.
3.3.1 The Role
The term “role” means a person’s or a thing’s function in a particular situation.
As the observation of news articles, we find that the news happened around the people, location, and organizations, so we could use these information to help the work of calculating the relationship between news articles.
Why this information help to detection the relations between news articles? For example, somebody Appears in many news articles, but he might play different roles in them. For example, the people “陳水扁” plays a role of president who attend to a speech in one news article but being a defendant in another one. To distinguish the
15
different roles the same person play in each news articles would help us to avoid some mistake in relation detection.
For example, two people just play each other’s role in two news articles, and the keywords distribute the roles actions and the person names were extracted to be the keywords to calculate the similarity of two news articles. If we just calculate the similarity by these keywords without distinguish the roles of the two people in the two news articles, it might get a high similarity score of these two news articles even if they have no relationship just because of the persons and the action keywords.
In this thesis, we will propose a method to calculate the relationship between news articles using some information including the roles of person names, location names and organization names played in these news articles.
As mentioned, each role corresponds to an entity name (person name, location name or organization name) in news article, and some other information would describe the behavior of this name entity. We will introduce the structure of a role here.
R : A Role (vector) in a document, and it is consist of 2-tuple.
R = < NE, FV >
A role is consisted of a name entity and a feature vector, and the relationship between role, name entity and feature vector is: each name entity play a special role in a document, and the feature vector describe what role this name entity played in the
16
document.
NE (Name Entity)
Name entity is the most important part of the role; it just like the role’s ID. The name entity means the object like person, location or organization in news document.
FV (Feature Vector)
The feature vector is a set of features, the feature is defined as below:
Fi(The i’th feature of a feature vector) = < fw ,
ω
f >fw : Feature Word of a role
ω
f : Weight of a feature wordAnd the feature vector is defined below:
FV(Feature Vector) = < fw1 [
ω
f1], fw2 [ω
f2], fw3 [ω
f3], ……>Feature vector of a role provide the information about what the role played by the name entity in this document. It consist of some features, and the feature consist of two element: feature word and the weight of feature word.
The feature word is selected from the document and pay mining for the role played by name entity. These feature words would let the name entity be meaningful and have their own role in news article.
The weight of feature word
ω
f means the important degree of the corresponding feature word of the role vector. The bigω
f a feature word is, the more meaning this17
feature word pays for the role played by name entity in document.
Below is an example of role vector, include all elements we introduced.
Role
Name Entity Feature Vector
<王建民> 紐約洋基[0.2],投手[0.3],勝投王[0.1],台灣[0.2],連勝[0.2]
<郭台銘> 鴻海[0.2],台灣首富[0.2],劉嘉玲[0.4],林志玲[0.2]
We will introduce how we building the role vector, including how to decide
the feature words and how to calculate the feature word’s weight
ω
f .3.3.2 Building Roles
In this Chapter, we will introduce how do we determine the roles which played by names in news articles.
1. Finding name entities:
First of all, we have to find out all the entity names in news article. we find all the person names, location names and organization names in the news articles we want to deal with by 中研院自然語言處理-斷詞系統 and a NER system build by the concept of Erik Peterson’s study of NER.
It helps us located out all entity names in news articles, and then we will extract the feature words of each feature vector.
2. Building feature word set
Feature words mean the words which constructing the role vectors beside the role’s
18
own name and pay meaning for the role vector, These words would let the role words be meaningful and have their own role in news article.
Because of all the news articles were crawled by the same query, most of them share the same important terms, so using tf-idf method to extract the keyword would miss a lots of important keywords which have high document frequency.
Instead of using tf-idf, we choose the WIKI titles as the source to help us extract the keywords in news articles.
The wiki title list consist of all titles appeared in the wiki pedia, it contains a large amount of terms with meaning.
3. Decide the feature words in feature vector
As an assumption, we believe that the words near the name in the news article would be meaningful for the name. So we could collect the feature words near the entity names appear in the news article, it would give every name their special meaning in different news articles.
As above, we would define a term “window” here. In this thesis, the term “window”
of a role is defined as the distance before and after entity names. Each name has its own window, which with a parameter named “window size”, and the window means every position before and after the name’s location less than the window size. All feature words appear in one entity name’s window, we would regard these feature words belong to the
19
role’s feature vector.
If an entity name appeared in one news article more than one time, it would have many windows, and some of them might cover each other’s content range because of the distance between two names might less than the name’s window size. In this case, we would combine the windows and the repeat part would just be readed one time. For example, if a name has two windows separately covered the position (20~80) and (40~100), we will combine these two windows to one which cover the position (20~100). By the way, we will avoid the problem of calculate some keywords repeatedly.
Below is an example for the role of a person name. Let’s see the sentence as below first.
“林德訓在國務機要費案中,已經分別以偽造文書和偽證罪兩項罪名來起訴,如 今又再洗錢一案轉列被告”
If we define the window size as 100, the words with back color(國務機要費, 偽造 文書, 偽證罪, 洗錢, 被告) are the feature words near the name “林德訓” and in the name’s window in this case, we define them as the role words of “林德訓” in these sentences.
Every name of persons, locations and organizations in the 162 news articles would be regular as a vector with keywords near them like follow.
20
Entity Name Feature Words [Appeared times]
<林德訓> 國務機要費[1], 偽造文書[1], 偽證罪[1], 洗錢[1], 被告[2]
The vectors of the name in the news articles were regard as the role which the name played in this news article they appeared at.
The second part of the Name’s Role Words like the number “1” after the term “國 務機要費” means how many times “國務機要費” appeared in the windows of the name “林德訓” in this news article.
4. Feature Weight
Now we get the information about what feature words appear around and near the entity names, including how many times they appeared in these names’ windows. The next step to deal with the name vectors is to transfer the parameter “appear times” into
“term frequency (tf)”. It will be done by just dividing each appeared times of Name’s Role Words by the count of all appeared times of these words in the name’s windows.
After the step, we get the new name vector as follow.
Role
Entity Name Feature Vector
<林德訓> 國務機要費[0.16], 偽造文書[0.16], 偽證罪[0.16], 洗錢[0.16], 被 告[0.33]
That’s the final version of a role vector we have to prepare to detect the
21
relationship between news articles.
3.4 The Topic
The role set has many role vectors and the amount of role vector depends on how many entity names in a news article. Unlike the role set, the topic set only consisted two kinds of vectors: noun and verb.
T : A Topic in a document, and it is consist of 2-tuple.
T = < POS, FV >
POS (Part Of Speech):This part means a kind of part of speech would decide
a topic vector. The role set has many role vectors and the amount of role vector depends on how many entity names in a news article. Unlike the role set, the topic set only consisted of two kinds of vectors: noun and verb.
FV (Feature Vector) : The feature vector is a set of features, the feature is
defined as below:
F(feature) = < fw ,
ω
f >fw : Feature Word of a role
ω
f : Weight of a feature wordAnd the feature vector is defined below:
FV(Feature Vector) = { < fw1 ,
ω
f1 > , < fw2 ,ω
f2> , < fw3 ,ω
f3 > , ……}Feature Word:
22
Feature words in topic vector means all words in a news document with the same part of speech (noun or verb).
Weight of a feature word:
The important degree of each feature word, we use the term frequency as the
ω
fin our model.
3.5 Review of the Model
We display the whole model in this section.
In News Article Set D(A document) :4-tuple
D= <E , RS , TS , Z>
E : Event
RS : A set of roles TS : A set of topics Z : Time stamp In Role Set
R (A role vector of a name entity) : 2-tuple R = <NE , FV >
NE(Name Entity) : Person names, location names, organization names
FV(Feature Vectors) : A vector(set) of features.
23
In Topic Set T = <POS , FV >
POS(Part of speech) : Noun , Verb FV(Feature Vector) : A vector(set) of features.
In Feature Vector
Feature = < f ,
ω
f >f : Feature Word of a role
ω
f : Weight of a feature word24
Chapter 4 Relationship Detection
After Chapter 3, we get all roles and topics of each news article, now we will describe how we use this information to calculate the relationship between news articles.
We define some operators on the model of news articles to help detect relationship between news events.
4.1 Operations
In this section, we describe some operations on the model to calculate the relationship between news articles.
1. Similarity
For each document pair D1 and D2:
D s
D Sim D
D1~ 2↔ ( 1, 2)>
θ
The score will consider role information and topic information, and it will be deeply introduced in section 4.2.
2. Evolution
For each document pair D1 and D2:
25
Z e
D Z D D
D
E D E D
θ
<
−
<
↔
→
. 1 .
2 0
&
2
~ 1
. 2 .
1
The goal of this operation is to determine the evolution relation between documents. If two documents D1 and D2 in different time interval are similar to each other and under a distance limit, we set they to have the relation of evolution.
3. Identity
For each document pair D1 and D2:
Z e
D Z D D
D
E D E D
θ
<
−
↔
↔
| . 1 .
2
|
&
2
~ 1
. 2 .
1
If two documents D1 and D2 in the same time interval and were similar to each other, we set they to have the relation of identity.
4.2 Similarity between Documents
In last section, we define an operator “similarity” to determine are two documents similar to each other. We will describe this operation clearly in this section.
For news document D1 and D2, their similarity using role and topic information is defined as below:
26
Sim (D1, D2) =
) . 2 , . 1 ( cos
) . 2 , . 1 ( cos
) . 2 , . 1 ( cos
) . 2 , . 1 ( cos
) . 2 , . 1 ( cos
. . 2 .
. 1 ) , (
. . 2 .
. 1 ) , (
. . 2 .
. 1 ) , (
V D V D
N D N D
O D O D
L D L D
P D P D
V N
NE Oj D NE Oi D j i
i j ij
O
NE Lj D NE Li D j i
i j ij
L
NE Pj D NE Pi D j i
i j ij
P
⋅
+
⋅
+
⋅
⋅
+
⋅
⋅
+
⋅
⋅
∑
∑
∑
==
∋
∀
==
∋
∀
==
∋
∀
ω ω
α ω
α ω
α ω
Formula 1: Role and Topic Cosine Similarity
The formula shows that the similarity between news documents is consisted of five parts:
1. Person role part. (1st row)
2. Location role part. (2nd row)
3. Organization role part. (3rd row)
4. Noun part. (4th row)
5. Verb part. (5th row)
The 1st~3rd part consisted of role information and the 4th~5th part consisted of topic information.
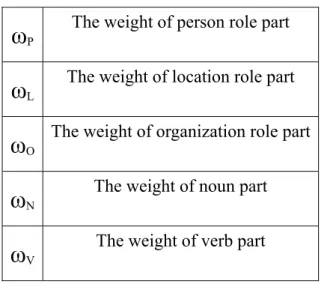
Each part consisted of two elements: a weight
ω
and the similarity degree of each part.ω
is the weight of one part and the meaning of each one is below:27
ω
PThe weight of person role part
ω
LThe weight of location role part
ω
OThe weight of organization role part
ω
NThe weight of noun part
ω
VThe weight of verb part
Table 1. Weight of role and topic parts
The second element of each part: the similarity degree, shows each part’s similarity degree between news documents. We will discuss this element in two parts: Role similarity and topic similarity.
1. Role similarity between news documents
The role similarity contains three kinds of similarity degree: person, location and organization. We will discuss the role similarity using the person role part as example.
The person role similarity degree is calculated by the formula as below:
∑
==∋
∀
⋅
NE Pj D NE Pi D j i
i j
ij
D P D P
. . 2 .
. 1 ) , (
) . 2 , . 1 ( α cos
For news documents pair D1 and D2, we calculate the cosine similarity score between all the person role pairs which have the same entity names using their feature vectors.
coun simil in the
of th Figur
After calcu nt them int
larity score.
e news docu The
α
is he documenre4:
F
ulating all t to one simi . The
α
m ument paircalculated nt pair’s rol
Figure 3. D
the same-en ilarity scor means the im
D1 and D2.
by the appe le frequenc
28
Document an
ntity-name re with the mportant de
.
ear times of cy as
α
scnd roles
person role e weight
α
gree of an e
f the entity n core. An ex
e pair simil
α
of same-e entity namenames. We xample is s
larity score entity-name e which app
take the av shown belo
s, we e pair peared
verage ow as
simil
2. To
vecto word simil
4.3
part vecto role
The locatio larity degree
opic similar
To calculat or part, we ds of two p
larity and ve
Role S
The role s (construct ors) .This sc
similarity i
on part and e.
rity betwee
te similarity calculate th part : noun
erb similari
Similari
similarity is of person core describ is high, it m
Figure 4
the organiz
en news doc
y of topic pa he cosine si n and verb.
ity.
ty and T
s the combi role vecto be how sim
means that
29
4. αCalcula
zation part u
cuments
art is much milarity bet
We should
Topic S
ination of t ors, location milar of a na
some nam ating
use the sam
easier than tween two n d get two s
Similari
he cosine s n role vec ame’s roles me entity in
me method t
n role part.
news article similarity s
ity
similarity sc ctors and o
in two new n the two n
to calculate
Same as the es with the score here,
cores of the organization ws articles.
news article e their
e role topic noun
e role n role
If the es has
30
similar behavior or similar situation.
The topic similarity is combined of the similarity scores of the topic part(including noun and verb). If two news articles’ topic similarity score is high, it means that the news articles might describe the similarity kind of events. For example, news articles describe about earth quake, they often had the same topic words as “quake”,
“amplitude”, ”epicenter”, ”rescue”…ect.
Both of the role similarity and the topic similarity play important role in helping to detect the relationship between news articles. We will introduce how we use this information to calculate the dependence between articles and how to combine these similarity scores in the next section.
What situation would be if two news articles have high role similarity but low topic similarity? To discuss the high and low combination would be interesting; we will discuss this problem after making experiments.
4.4 Discussion
The advantage of our method detects the relationship between news articles not only considers the characteristics of news events but also considers the concepts of name entities in news articles. The drawback of our work is the need of NER and part of speech tagging processes, which might make a miss rate and affect our results.
31
Chapter 5 Experiments
5.1 Overview
In this Chapter, we will make some experiment about relationship detection between news articles using role and topic information. At first, we introduce our experiment dataset and then describe how we set up the experiment in section 5.1~5.3.
Next, we will illustrate all experiment methods, experiment result and discuss each of them.
A basic experiment process graph as below:
32
Figure 5. Experiment Process Graph
5.2 Dataset
33
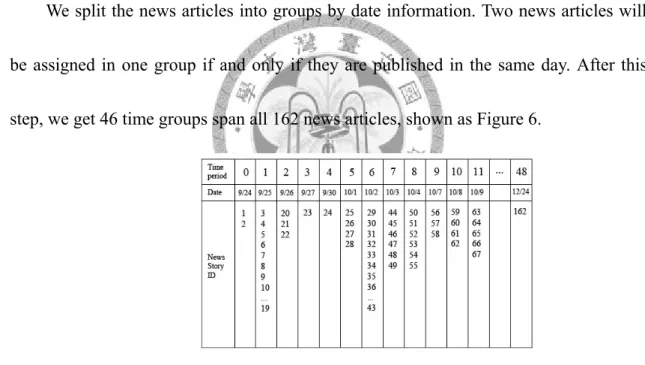
The dataset of our experiment are 162 news articles searched from Yahoo News Taiwan with the query “洗錢案”,and the date of these news articles are from 2008/9/24 to 2008/12/24.
Because of to organize the correct real person sensible relationships answer of these news stores is difficult and ambiguous in different people’s minds, so we just get a not huge amount of news articles and it make us easy to discuss the detail of the relationship answer.
We split the news articles into groups by date information. Two news articles will be assigned in one group if and only if they are published in the same day. After this step, we get 46 time groups span all 162 news articles, shown as Figure 6.
Figure 6. News Articles After Splitting.
5.3 Evaluation
As our knowing, there is no official benchmark or static answer for the study of event evolution mining, so we make the correct answer by our self.
We choose the recall and precision to evaluate the performance of our experiments.
34
The parameters and formulas is illustrate below:
| Rt | : # of true relationship labeled manually.
| Re | : # of relationship detected by our method.
Recall =
t t e
R R R ∩
Precision =
e t e
R R R ∩
5.4 Baseline
We believe that if two news articles are dependent to each other, they must be similar to each other, too. So we choose the document similarity as our strategy of detecting the relationships of news articles, and we should set the vectors as calculative element.
We set the vectors of news articles are keywords traced by WIKI titles and using their term frequency (tf) information to calculate the cosine similarity. If words appear in both a news article and WIKI title list, they would be the feature term of this news article.
We calculate the cosine similarity of the news articles with all other news in the nearest 10 time intervals because of avoids too far and endless calculation.
For any pair of news articles in different time interval, if the cosine similarity score of them is higher than a threshold, we make the relationship between this two news articles as true.
The experiment result is recall 0.66 and precision 0.36. The recall is normal but
35
precision is not well. To observe the experiment result, we find that, in our experiment data set, there are many news articles describe the similar topics, but the characters in these articles are not the same. Just using the keywords of news articles as features to calculate the similarity score will miscarriage the wrong answer as correct in this kind of cases.
5.5 Experiment 1. Different Weight
We will introduce the first experiment using the operations introduced in section 4.1 to detect the relationship between news articles in this section.
This experiment is to observe and discuss the effect of the similarity scores’ weight combination strategy of the five parts.
5.5.1. Static Weight
The similarity operation formula is shown below:
Sim (D1, D2)=
) . 2 , . 1 ( cos
) . 2 , . 1 ( cos
) . 2 , . 1 ( cos
) . 2 , . 1 ( cos
) . 2 , . 1 ( cos
. . 2 .
. 1 ) , (
. . 2 .
. 1 ) , (
. . 2 .
. 1 ) , (
V D V D
N D N D
O D O D
L D L D
P D P D
V N
NE Oj D NE Oi D j i
i j ij
O
NE Lj D NE Li D j i
i j ij
L
NE Pj D NE Pi D j i
i j ij
P
⋅
+
⋅
+
⋅
⋅
+
⋅
⋅
+
⋅
⋅
∑
∑
∑
==
∋
∀
==
∋
∀
==
∋
∀
ω ω
α ω
α ω
α
ω
36
This score linear combined of five similarity score as person role part, location role part, organization role part, noun part and verb part. In this experiment we will try some weight combination to observe what weight combination of similarity score do well in relationship detection.
We set each of the weight parameters (
ω
P,ω
L,ω
O,ω
N ,ω
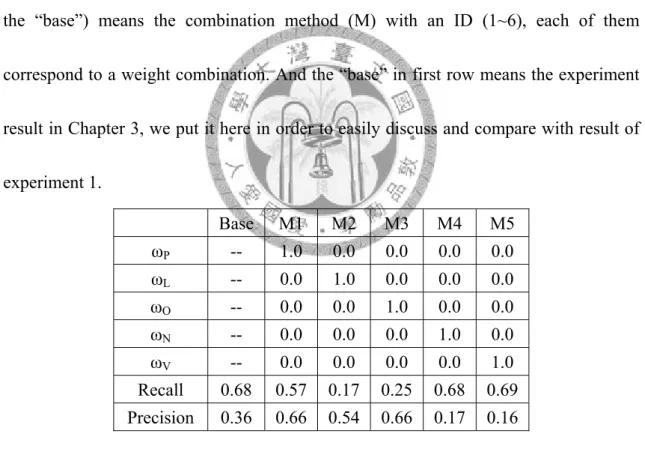
V) between 0 to 1 and their sum to be 1.Table 2 is one part of result in this experiment. The value in the first row (besides the “base”) means the combination method (M) with an ID (1~6), each of them correspond to a weight combination. And the “base” in first row means the experiment result in Chapter 3, we put it here in order to easily discuss and compare with result of experiment 1.
Base M1 M2 M3 M4 M5
ωP -- 1.0 0.0 0.0 0.0 0.0
ωL -- 0.0 1.0 0.0 0.0 0.0
ωO -- 0.0 0.0 1.0 0.0 0.0
ωN -- 0.0 0.0 0.0 1.0 0.0
ωV -- 0.0 0.0 0.0 0.0 1.0
Recall 0.68 0.57 0.17 0.25 0.68 0.69 Precision 0.36 0.66 0.54 0.66 0.17 0.16
Table 2. Static Weight Result (Single)
The method M1~M5 in Table7.1 are just using one part of the five element as the whole weight in similarity score. Method M6 let each part has the same weight to calculate the similarity score.
37
Let’s start to discuss the result of each combination strategy and experiment results.
M1:
M1 sets the
ω
P to be 1 and sets others to be 0 so that we can clearly understand the effect of person role on the relationship detection. In this combination, we get a result as recall 0.57 and precision 0.66. Compare with the result of baseline, M1’s recall is not well but the precision is much better. The recall part means that, in the experiment data se, if we just using the role information to detect relationship between news events, we would miss detect about half of the correct event dependent relation. But in the precision part of the experiment result, it shows that using the person role similarity as whole weight would avoid making too many erroneous judgments of letting independent events to be dependent.M2, M3:
The result of weight combination of M2 and M3 play very poor scores of recall and better then baseline scores of precision. The pool recall of M2 and M3 is reasonable because that the location and organization play much less important roles then person role information in the experiment dataset, most of the news articles in dataset happened around person, only a little news articles using the locations or organizations as the most important characters.
38
M4, M5:
The weight distribute of M4 and M5 means only using the topic part in relationship detecting. The result shows that only using topic part would has the similar result with baseline in recall and a very poor result in precision.
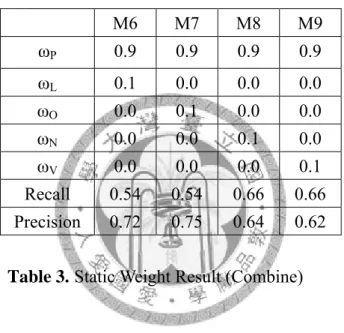
Table 3 is another weight combination experiment result, this strategy using the person role part as 0.9 and other one as 0.1.
M6 M7 M8 M9
ωP 0.9 0.9 0.9 0.9
ωL 0.1 0.0 0.0 0.0
ωO 0.0 0.1 0.0 0.0
ωN 0.0 0.0 0.1 0.0
ωV 0.0 0.0 0.0 0.1
Recall 0.54 0.54 0.66 0.66 Precision 0.72 0.75 0.64 0.62
Table 3. Static Weight Result (Combine)
M6, M7:
Person role similarity and one other role part similarity using the weight combination strategy as M6 and M8 in Table 3, compare with the method M1 which just using the person role part, this kind of method provide a better precision score. It means using would help arising the precision.
M8, M9:
M8 and M9 using the strategy as person role to be the main part and location role or organization role to be the auxiliary element with weight 0.1. The result shows that
39
both recall and precision exceed 60% in this combination strategy, it means that the combination of role similarity and topic similarity would have a good balance in recall and precision.
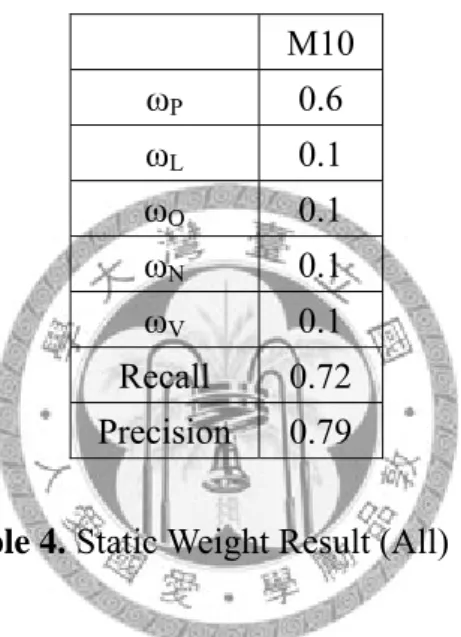
Table 4 is a weight combination experiment results, this combinative strategy is giving the person role similarity most weight (0.6) and other parts averagely shared the remaining weight (each of 0.1).
M10
ωP 0.6
ωL 0.1
ωO 0.1
ωN 0.1
ωV 0.1
Recall 0.72 Precision 0.79
Table 4. Static Weight Result (All)
This combination strategy lets the result to be so far the best result in our experiments, both recall and precision are above 70%, it tells us that using all parts of role and topic information might provide the whole information we need to detect the relationship between news events.
5.5.2. Dynamic Weight
The experiment result shown in section 6.6.1 tell us that the person role vectors play the most important role in the case of “洗錢案”. The reason of getting this result is because that most of the 162 news articles happened mainly around the persons, but
40
locations and organization play the most important role in little news articles of the experiment dataset.
Our goal in this thesis is to detect relationship between events in all kind of domain, we do not have a perfect static weight combination to fit all news article sets. Even in one news set which are describes a specific event, they might focus on different kind of roles in the whole event.
For example, our experiment dataset, the 162 news articles, although most of them are focus on person behavior, but some of them are focus on organizations and some are focus on locations. If we can automatically detect the weight strategy of news article pairs, the relationship detection result might be better. So we make a variant weight combinative strategy to dynamic decide each role vector part’s weight.
In this experiment, we use the combination strategy as below:
For each news article pair:
1. As the combination strategy of method M11, we select a main part and set its’
weight as 0.6, and others as 0.1.
2. The main part is chosen from the three role similarity part (person, location and organization). We select the part which owns the most amount of entity names in the news document pair.
Table7.4 shows the result of this combination strategy.
41
Variant Weight Recall 0.80 Precision 0.79
Table 5. Dynamic Weight Result
Using the dynamic weight method improve the news article relationship detection on the part of news articles which discussed about the organizations.
5.5.3. Comparison
We will compare the experiment results by the evolution graph in this section.
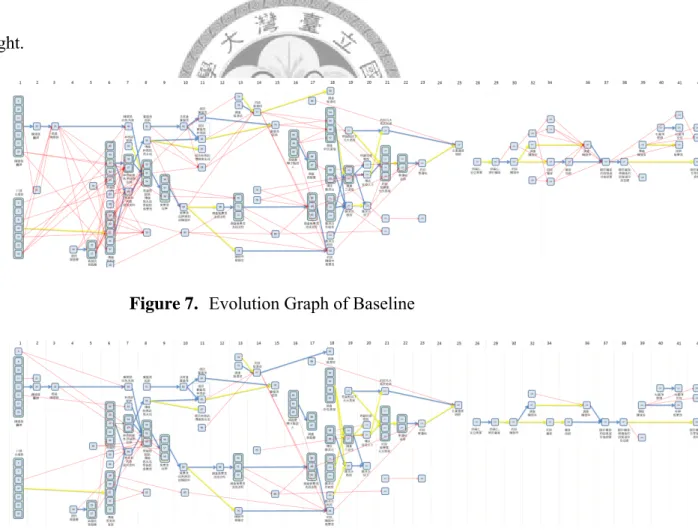
Figure 7 to Figure 9 show the evolution graphs of baseline, static weight and dynamic weight.
Figure 7. Evolution Graph of Baseline
Figure 8. Evolution Graph of Static Ally Weight
42
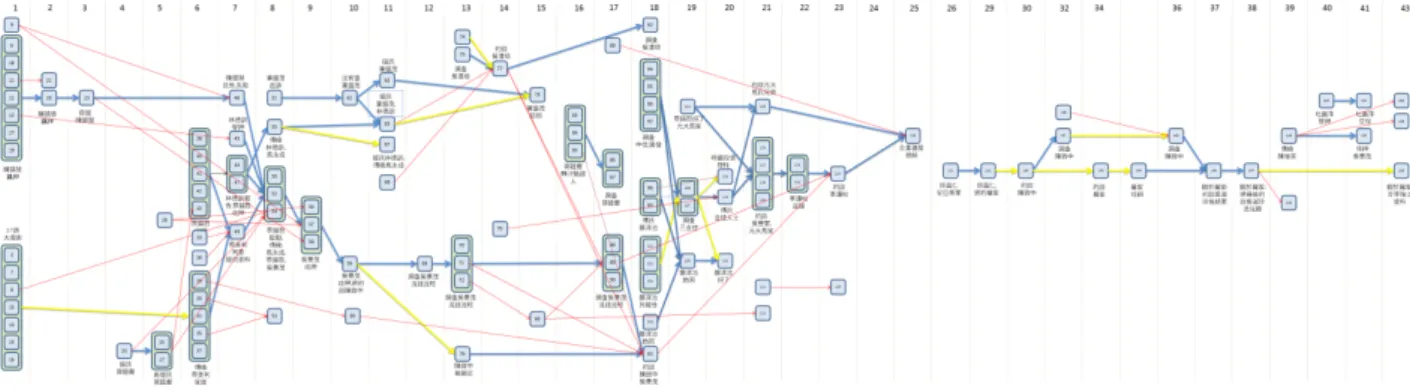
Figure 9. Evolution Graph of Dynamic Ally Weight
The blue line in the graph means the correct relationships between events to be recognize by our experiment processes, and the yellow lines means the correct relationships which miss detected by our experiment processes. The red line means the relationships which are not in the correct answer set but detected to be correct relationships by our experiment processes.
Figure 7 shows that the baseline detected too much noise by observing the high density of red lines. Compare with Figure 7, the Figure 8 and Figure 9 have much less red lines. It proved that our method could effectively decrease the noise of building an evolution graph.
Compare the Figure 8 and Figure 9, the biggest different of this two result is at the part that news events which discussed about organizations. The static weight strategy set the person as the best weight in our experiments so it could not detects the relationships between news events which discussed about the locations or the organizations well.
43
5.6 Experiment 2: Window Size
The window size of a role vector decides the information quantity of the vector. If a role vector has a too big window size, it might collect too many keywords into his keyword set, including more noise information. In the other side, if a role vector was building with a too small window size, it might miss useful information which helping for determine the role it played in news articles correctly.
How to select the suiTable window size is a good study for helping detecting the relationship between news articles.
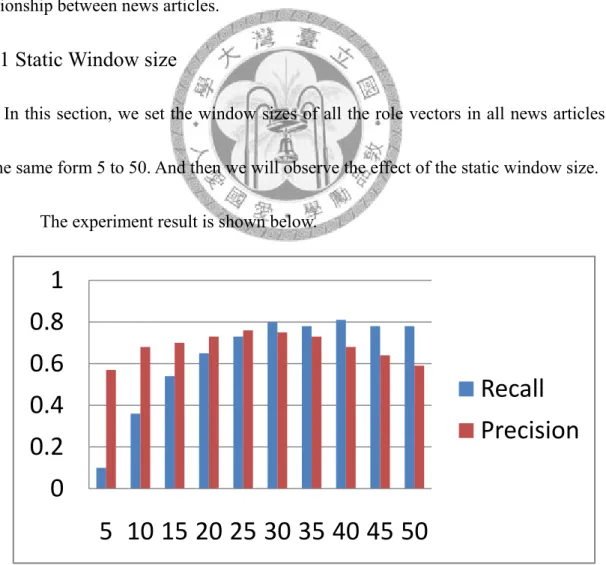
5.6.1 Static Window size
In this section, we set the window sizes of all the role vectors in all news articles be the same form 5 to 50. And then we will observe the effect of the static window size.
The experiment result is shown below.
Figure 10. Result of Different Window Size
0 0.2 0.4 0.6 0.8 1
5 10 15 20 25 30 35 40 45 50
Recall Precision
44
Window Size
5 10 15 20 25 30 35 40 45 Recall 0.10 0.36 0.54 0.65 0.73 0.80 0.78 0.81 0.78 Precision 0.57 0.68 0.72 0.73 0.76 0.75 0.71 0.68 0.64
Table 6. Static Window Size
The recall is very poor in low window size environment, It means that collect too less feature words to a role will lead to miss detect many correct relationship between news articles. But the recall rose as the raising of window size. After the window size of 30, the recall is sTable about 0.8 and it will not increase or decrease as the window size.
The precision rose as the raising of window size before window size 30 but go down since window size 30. It means that too long window size would collect too much noise for the role and detect many not correct relationships as correct.
5.6.2 Dynamic Window size
The section 6.7.1 shows the effect of window size for all roles in news articles. In this section, we will discuss how each role has different window size will affect the experiment result.
First of all, we make an experiment; we set all person roles’ the same window size from 5 to 50 and observe the recall of each role. Below is some result:
Window size
20 25 30 35 40
蔡美利 30/53 33/53 32/55 30/58 30/59
吳景茂 46/63 48/60 46/66 46/67 47/68
45
林德訓 13/17 15/21 20/27 22/27 20/30
蔡銘哲 69/90 78/101 87/113 84/120 85/127
葉盛茂 9/9 8/9 10/11 11/12 10/12
辜濂松 9/14 10/12 8/10 9/11 13/15
Table 7. Some Persons’ Precision in Different Window Sizes
The result shows that roles provide the best contribution to relationship detection with different window size, some maybe at 25, some maybe at 30 and some at 35 and some even at 40.
5.7 Experiment 3: Different Feature Word
In our work, we choose the Wiki titles as our feature words in roles’ feature vectors.
Are Wiki titles really suitable to be the feature words? We make an experiment to answer this question.
In this experiment, Instead of wiki keywords, we use the bigrams in role’s windows as the feature words and the weight of feature words still be the value of term frequency. Table 8 shows the experiment result.
B0 B1 B2 B3 B6 B7
ω
P VariantWeight
1.0 0.0 0.0 0.2 0.6
ω
L 0.0 1.0 0.0 0.2 0.1ω
O 0.0 0.0 1.0 0.2 0.1ω
N 0.1 0.0 0.0 0.0 0.2 0.146
ω
V 0.1 0.0 0.0 0.0 0.2 0.1Recall 0.78 0.66 0.53 0.37 0.75 0.66
Precision 0.48 0.36 0.37 0.51 0.37 0.37
Table 8. The Result of Bigram Feature Words
The Table shows that using bigram as feature words to detect the relationship will get a low precision of result, because using all the bigrams would collect much noise to a role. It proved that using the wiki titles as feature words of a role is suiTable.
5.8 Experiment 4: Different Feature Size
This experiment discuss should we use all feature words in feature vectors to calculate the relationship between news articles? Some words of them might be not important for describe the role played by a name entity, if we can discard some feature words which is not that important, it will be speedup to the calculation.
In this experiment, we use the term frequency as the feature to determine if we should keep a feature word in a feature vector or discard it. We keep the feature words with high term frequency, which high in the front 90% to 10% and observe the result.
The experiment result as below:
Tf-rate Role Topic Role & Topic
90% 0.8 ;0.79 0.8 ;0.79 0.8 ;0.79 80% 0.8 ;0.79 0.8 ;0.79 0.8 ;0.79 70% 0.8 ;0.79 0.8 ;0.79 0.8 ;0.79 60% 0.8 ;0.79 0.8 ;0.79 0.8 ;0.79 50% 0.8 ;0.75 0.8 ;0.77 0.8 ;0.76
47
40% 0.8 ;0.71 0.8 ;0.72 0.8 ;0.71 30% 0.8 ;0.69 0.8 ;0.70 0.8 ;0.69 20% 0.78 ;0.67 0.8 ;0.68 0.77 ;0.65 10% 0.76 ;0.64 0.76 ;0.65 0.75 ;0.63
Table 9. The Result of Different Feature Sizes
The result tells us even if we just use the 50% high tf feature words, it will get the same result as using all feature words. So we can just use a part of feature words to calculate the relationship to speed up the evolution detection.
48
Chapter 6 Conclusion and Future Work
6.1 Conclusion
This thesis provides a method to detect the dependency between news events using the role and topic information. The role information not only considers the name entities in news events but also considers the concept of the name entities. Besides the roles, we also use the topic information to detect event evolution; the topic information tells us what kind of news event this event is.
Our experiments prove that our method is usable for event evolution detection. In first experiment we observe the effect of weight combination, and we found that using all part of the role and topic information would help to detect the relationship between news articles mostly. And then we found that the dynamic weight strategy is better than the static combination strategy because of the focal of different new article pairs is not the same.
The second experiment shows that too big or too small window size is not suitable for a role to collect the feature words. We have to choose a suitable window size to
49
maintain the information quantity and control the noise of a role’s feature vector. And +then we observe that entity name pay different performance in different window size, the best window size for the whole data set is not the best for all entity names. We do not find the method to dynamic determine the best window size for each entity’s roles yet.
The 3’rd experiment prove that the wiki titles are suitable to be the feature words of roles, it contains less noise than using all bigrams as feature words. The last experiment proved that we do not have to use all feature words to calculate the similarity score but just to use part of them (maybe the important ones) will get a result as good as using all feature words.
6.2 Application
Our work detects the relationships between news events; we can use this information to build the evolution graph of news events. Figure 11 shows an example of evolution graph.
Figure 11. Evolution Graph
50
6.3 Future Work
In the future, we hope we can make our work better in some aspect. First, the feature words of topics were all nouns and verbs in news articles without our filter; it might lead to collect too much noise for the topic which is not suitable to represent the concept of the news articles. Second, we hope that we can find a method to detect the suitable window size for each roles and make the performance better.
51
Reference
[1] Nallapati, R., Feng, A., Peng, F., and Allan, J. Event threading within news topics. In CIKM04 conference proceedings, 446-453.(2004)
[2] Mei, Q. and Zhai, C.X. Discovering evolutionary theme patterns from text – an exploration of temporal text mining. In SIGKDD05 conference proceedings, 198-207.(2005)
[3] Chien Chin Chen, Meng Chang Chen, TSCAN: A Novel Method for Topic Summarization and Content Anatomy, SIGIR2008
[4] N. Uramoto, K. Takeda, A method for realting multiple news-paper articles by using graph, Proceedings of 36th conference on Association for computational linguistics (1998).
[5] NIST, Available at http://www.nist.gov, (2004).
[6] M. Henzinger, B.-W. Chang, B. Milch and S. Brin, Query-free news search, Proceedings International WWW Conference, Budapest, Hungary (2003).
[7]Allan, J., Carbonell, J., Doddington, G., Yamron, J., and Yang, Y. Topic detection and tracking pilot study: final report. In DARPA broadcast news transcription and understanding workshop proceedings, 194-218. (1998)
[8]Chen, C. C., Chen, M. C., and Chen, M. S. 2005 LIPED: HMM-based Life Profiles
52
for Adaptive Event Detection. In SIGKDD05 conference proceedings, 556-561.
[9]Yang, Y., Pierce, T., and Carbonell, J. 1998. A study on retrospective and on-line event detection. In SIGIR98 conference proceedings, 28-36.
[10] We. Ichiro, M. Hiroshi and K. Norio, Threading news video topics, Proc. of 5th ACM SIGMM International Workshop on Multimedia Information Retrieval (2003).
[11] P. Duygulu, J.-Y. Pan and D.A. Forsyth, Towards auto-documentary: tracking the evolution of news stories, Proceedings of the ACM Multimedia Conference (2004).
[12] H. Kozima, Text Segmentation Based on Similarity between Words, in Proceedings of the ACL, (1993).
[13] M.A. Hearst, Multi-paragraph Segmentation of Expository Text, in Proceedings of the ACL, (1994).
[14] Manoff & Shudson, 1986
[15] Cieri etal. 2002