行政院國家科學委員會專題研究計畫 成果報告
自動搬運車倉儲系統之設計研究
計畫類別: 個別型計畫
計畫編號: NSC95-2221-E-011-001-
執行期間: 95 年 01 月 01 日至 95 年 07 月 31 日 執行單位: 國立臺灣科技大學工業管理系
計畫主持人: 郭伯勳
報告類型: 精簡報告
處理方式: 本計畫可公開查詢
中 華 民 國 95 年 10 月 2 日
行政院國家科學委員會補助專題研究計畫 ☑ 成 果 報 告
□期中進度報告
自動搬運車倉儲系統之設計研究
CONCEPTUALIZATION TOOLS FOR UNIT LOAD WAREHOUSE DESIGN BASED ON AUTONOMOUS VEHICLE TECHNOLOGY
計畫類別:
☑
個別型計畫 □ 整合型計畫 計畫編號:NSC 95-2221-E-011-001-執行期間: 95 年 01 月 01 日至 95 年 07 月 31 日
計畫主持人:郭伯勳 共同主持人:
計畫參與人員:
成果報告類型(依經費核定清單規定繳交):
☑
精簡報告 □完整報告本成果報告包括以下應繳交之附件:
□赴國外出差或研習心得報告一份
□赴大陸地區出差或研習心得報告一份
□出席國際學術會議心得報告及發表之論文各一份
□國際合作研究計畫國外研究報告書一份
處理方式:除產學合作研究計畫、提升產業技術及人才培育研究計畫、
列管計畫及下列情形者外,得立即公開查詢
□涉及專利或其他智慧財產權,□一年□二年後可公開查詢
執行單位:國立台灣科技大學工業管理系
中 華 民 國 95 年 10 月 31 日
(一) 計畫中文摘要。(五百字以內)
物料搬運之效率關係著國家之經濟競爭力及國防。而倉儲系統為物料搬運的其中一 環,更是整體供應鍊之關鍵,自動化將會提高倉儲系統之效率。1970 年代開始,由於自 動化技術之發展,大量之研究投入於探討 crane-based automated storage and retrieval system (CBAS/RS) 之設計,這些研究大大地幫助此系統拓展其市場,此外也因為倉儲 業者在利用此系統之後,對此系統所產生的數據及研究報告,更進一步成為更多業者選 擇 CBAS/RS 之參考。但由於 CBAS/RS 系統之高成本,也常造成業者在欲使用自動化倉 儲系統時發生怯步。近年來,新的自動化倉儲系統 autonomous vehicle storage and retrieval system (AVS/RS) 利用自動搬運車(autonomous vehicles)來搬運貨品,大大減少了建構 成本。此新系統有效的改善高成本之考量,將有助於倉儲系統之全面自動化。本計畫之 研究目的為致力於加速倉儲系統之全面自動化,藉由本研究來縮減本系統(AVS/RS)硬體 及系統控制技術間配合之不成熟,並建立概念化設計工具來幫助業者更瞭解本系統,進 而利用 AVS/RS。本研究將利用等候模式來建立 AVS/RS 之分析模型基礎。經由此分析 模型,AVS/RS 將可與現今最廣泛的系統 CBAS/RS 作一詳細比較。再者,此分析模型有 助於更加瞭解 AVS/RS 之運作,例如:搬運車與升降梯之相互影響,存貨與取貨指令之 相互影響,如何分派搬運車存取,批量存取,以及考量倉庫外的裝載緩衝區等。進而讓 此系統能普遍為倉儲業者接受,而有效的降低自動倉儲系統之成本,提高物料搬運之效 率。本計畫將藉由等候理論來描述 AVS/RS 中搬運車與升降梯之運作。經由此數學分析 模式來分析搬運車與升降梯之效率、平均運作時間、平均等候時間。本研究另將建立模 擬程式來證實此分析模式之可信度。
關鍵詞:倉儲系統,自動搬運車,隨機儲存,搬運車停放點,等候模式。
(二) 計畫英文摘要。(五百字以內)
Material handling is a growing industry that is central to the nation's economic competitiveness and national defense. A major segment of this industry is unit load storage and retrieval (ULS/R) systems which form a critical link in global supply chains. Starting with a representation of forecasted system flow, the first step in ULS/R system design is
"conceptualizing" which establishes the configuration from which subsequent design details are derived. Most ULS/R system life cycle costs and capabilities are established during conceptualization including the selection of storage and retrieval device technology, unit load throughput rates, storage capacity and system configuration. Following the introduction of crane-based automation technologies in the 1970’s, industry practitioners used rules-of-thumb for ULS/R system conceptualization until recent advances in conceptualizing models for crane-based technology facilitated the development of integrated analytical tool suites, [Eldemir, et al 2004]. These tools enable the rapid development of cost effective crane-based automated storage and retrieval system (CBAS/RS) designs based on throughput demand and site specifications and reduce early system development costs in the highly competitive market for CBAS/RS’s. However, they have not had an impact on the rate at which automation has been adopted in ULS/R operations which is limited by the high cost of CBAS/R technology. Today, recent advances in “autonomous vehicle” hardware technologies have created the possibility of drastically reducing the scale of cost effective automation in moderate to low throughput ULS/R’s, especially for ULS/R systems with high storage capacity to transaction demand ratios. Given the pervasiveness of ULS/R systems in global supply chains, there is high potential for autonomous vehicle technology to yield major cost reductions in a wide breadth of industries.
We propose to accelerate the adoption of automation in ULS/R systems through research aimed at closing the gap between autonomous vehicle storage and retrieval system (AVS/RS) hardware and control system technology, and the design conceptualization tools needed to assess their impact on ULS/R operations. The proposed research will advance the analytical foundations of AVS/RS modeling through development of a new class of specialized queuing models and lead to creation and deployment of analytical conceptualization tools comparable to those available for CBAS/RS’s. The class of queuing models developed through this research will capture the unique features of AVS/R operations such as vehicle and lift interfacing, storage and retrieval interference effects, selective transaction dispatching, batching operations, consolidated load buffering, explicit linkage of S/R operations with in-process material flows, and other features characterizing ULS/R operations that can effectively exploit autonomous vehicle technology.
Key Words: unit load storage and retrieval, autonomous vehicles, random storage, vehicle dwell point, queuing models
1. Introduction
Adoption of new technology faces significant barriers when there is a dearth of analysis tools applicable in the conceptualizing phase of system development where technology selection decisions driving the majority of life cycle costs are made. Automation technology for unit load storage and retrieval systems (ULS/RS’s) provides an example. Given the pervasiveness of conventional ULS/RS’s in global supply chains, a significant increase in the use of automation could yield significant cost savings in many service and manufacturing industries. This
opportunity has not been fully realized because the dominant automation technologies for
ULS/RS’s are crane-based systems designed for high-end performance with respect to throughput and storage density. While these objectives apply to some extent in almost all ULS/RS’s, the high costs associated with crane-based technologies have raised the threshold for cost justification of automation to the point where there is a potentially large, technologically underserved market segment, [DeWeerdt 2004].
Recent advances in “autonomous vehicle” (AV) technologies offer the possibility of drastically reducing the scale of cost effective automation for ULS/RS’s. For this technology to penetrate the market, system suppliers of AV technologies must demonstrate performance benefits as well as and cost effectiveness to prospective system adopters. This has not occurred for two primary reasons. First, current and potential suppliers of AV ULS/RS technologies face a gap between the advanced state of their hardware and control system technology, and the design conceptualization models needed to assess the impact of this technology on ULS/RS operations.
The lack of analytical models to predict system performance has been a primary obstacle to the widespread automation for ULS/RS’s that operate at relatively low throughput volume to storage capacity ratios. The second reason is a risk-averse business culture among ULS/RS suppliers that exerts significant time pressure and uncertainty on the process of technology selection, [McHugh 2002]. Today, there is an unmet need for accurate and computationally efficient mathematical models that can be applied in the conceptualization phase of ULS/RS development to predict system performance as a function of the major design variables defining AV based ULS/R systems (AVS/RS’s).
A recently published study described early advances in the development of mathematical models for the design of AVS/RS’s, [Malmborg 2002]. Although simulation based validation studies have verified that these tools have sufficient accuracy for design conceptualization applications, they impose computational requirements that are inconsistent with the requirements of a decision making environment where broad enumeration of the design space is needed
identify candidate system profiles and minimize design risks. This environment requires computationally efficient and accurate models that can be packaged in a platform yielding the appearance of seamless, “spreadsheet like” implementation enabling the modeler to investigate highly disparate design alternatives with immediate feedback on performance. The recent development of design optimization models to compare crane-based and AV-based automation technologies with respect to cost was effective in capturing this aspect of this problem,
[Malmborg 2003]. However, there are no existing models of AVS/RS’s that effectively address the performance aspects the problem. The current study addresses this need.
The next section provides background information on AVS/RS technology including a discussion of the design variables and performance measures associated with system
conceptualization. The weaknesses of existing performance modeling tools are explained. The third section describes a cycle time performance model comparable in efficiency to those
available for traditional, crane-based ULS/RS’s. This model incorporates efficient computational performance with realistic assumptions with respect to movement kinematics, storage policy,
transaction dispatching, and dwell point policies. The fourth section describes computational experience including simulation-based validation, and illustrates the model over the design space of a realistic sample problem. The final section offers a summary and conclusions.
2.0 Background Discussion
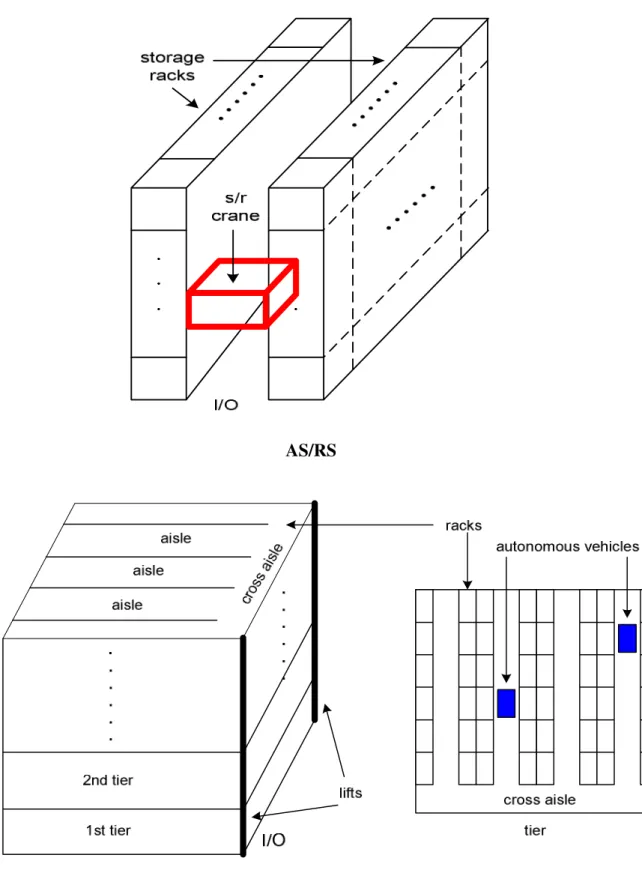
AVS/RS’s move unit loads using rail guided AV’s that follow three dimensional
rectilinear movement patterns. In traditional crane-based systems, loads are transported on aisle- captive cranes that move simultaneously in the horizontal and vertical dimensions. Figure 1 summarizes the key differences between crane-based and AV-based automation technologies.
AV technology can provide cost effective automation of ULS/R systems at low transaction volumes since it enables the designer to vary the number of storage/retrieval (S/R) devices, (vehicles), with the level of S/R transactions demand in a system. With traditional crane-based technology, aisle captive S/R devices utilize highly efficient Chebychev movement patterns within aisles. However, the high cost of crane-based systems raises the threshold for cost effective automation since many ULS/R system sites have restrictions limiting aisle depth and height, and/or high physical storage requirements with limited S/R transactions demand. In AVS/RS’s, horizontal vehicle travel is restricted to “cross-aisle” and “within-aisle” rails built into the storage rack. This structure imposes relatively inefficient rectilinear movement patterns.
Further, the use of lifts for vertical movement requires additional transfer operations and vehicle waiting times for lift service. The key features of AVS/RS’s are detailed in, [Malmborg AMM 2003].
For ULS/R systems using crane-based technology, numerous analytical performance models for system conceptualization are available, [Bozer and White 1984, Malmborg 2001]. A survey and comparison of these models with respect to accuracy and computational efficiency are provided in, [Eldemir et al, 2003]. Many have proven to be of high value to practitioners,
[Tompkins et al 2003, Zollinger 1996]. Design optimization models for direct cost comparisons between ULS/RS design profiles with crane and AV based technology are presented in,
[Malmborg AMM 2003]. These models apply the key drivers of ULS/R system cost including the number of S/R devices and the storage rack configuration defined by the number of aisles, aisle height, and aisle depth. They generate cost comparisons without direct linkages to system performance. The cost modeling aspects of these systems do not present significant computational issues. This is not true of performance modeling where existing models of AVS/RS cycle times are based on Markov Chains requiring the solution to high dimension systems of state equations describing the queuing dynamics of S/R devices. While it is not difficult to apply these models for individual combinations of design variables, the underlying calculations cannot be streamlined to the point where they are easily implemented for
enumerative exploration of the design space.
To understand the importance of computational efficiency in this application, consider the illustration of a typical ULS/RS design conceptualization study as illustrated in Figure 2. In this context, the design engineer visits the client location, assesses performance requirements, collects site and facility data, accesses networked information on cost and performance parameters, and then prepares a cost proposal for a system. When automation is considered, engineers can access a well-developed and computationally adapted suite of performance models and knowledge- based design tools for crane-based technology. The perceived reliability of these models has created an environment where early technology selection decisions are made on the strength of model-based analyses, [McHugh 2002]. Preliminary design proposals are ultimately subjected to detailed, simulation-based validation but this step is not usually undertaken prior to a significant financial commitment from the client, or the award of a system installation contract. Although
practitioners report a relatively low success rate for preliminary ULS/RS automation proposals due to uncertainty in clients’ capital budgeting forecasts and competition among system suppliers, the risks associated with preliminary proposal development are considerable. Under promising on system cost for a fixed performance level is likely to result in a non-competitive proposal. Over- promising carries serious reputational and financial liabilities for the system supplier or
consultant. In this decision-making environment, design engineers have little incentive to propose alternative technologies.
To consider AV-based technology as a serious alternative to crane-based technology, it is necessary to have accurate and efficient models of system performance. Expected cycle time (ECT) is among the most important performance measures in ULS/R systems since it drives resource utilization and transaction response times. Computationally efficient models of AVS/RS ECT’s with realistic operating assumptions have not been available to practitioners although reasonably accurate models based on Markov chains have been proposed, [Malmborg IJPR 2003].
These models define system states based on the number of vehicles and the transactions queue using a vector of the form, {v1, v2, …, vV, qs, qr}, where vi denotes the state of vehicle i, V denotes the number of vehicles, qs denotes the number of pending storage transactions in the queue, and qr denotes the number of pending retrieval transactions. For each vehicle, the state vector can take on values defined as, vi = 0, 1, 2 or 3, respectively denoting that vehicle i is idle, performing a storage cycle, performing a retrieval cycle or performing a combined S/R cycle.
Values of qs and qr can take on the values:
qs = 0, 1, …, Q-qr and, qr = 0, 1, …, Q-qs,
where Q denotes a positive integer greater than or equal to the maximum expected number of transactions observed in the queue during normal system operation.
Using this representation, random variation in system states is described using equations describing fluctuations associated with state changing events including service completions and transaction arrivals. State equations are formulated and used to solve for state probabilities of the form:
Pv1v1, v2, …, vV, qs, qr, = probability of state {v1, v2, …, vV, qs, qr}, where vi=0,1,2,3, i=1,…V, qs = 0, 1, …, Q-qr and qr = 0, 1, …, Q-qs.
The implementation difficulty of this approach lies in its dimensionality. The total number of vehicle states is given by 4V with the total number of queue states given as:
Σi=0,…,Q(Q+1-i).
Non-empty queue states can only exist for the 3V vehicle states where there are no idle vehicles.
The total number of feasible system states is therefore the product of the number of vehicle states with no idle vehicles and the total number queue states, plus the number of vehicle states with at least one idle vehicle, (in these states it must be that qs=qr=0, or S = Σi=0,…,Q(Q+1-i)3V + (4V-3V)).
It is not difficult to program the state equation model since all state equations fall into one of just four generic categories, (as (qs=qr=0), (qs=0, qr≥1), (qs≥1, qr=0), and (qs≥1, qr≥1)), and the underlying Markov chain is generally sparse. However, the dimensionality problem is still troublesome since the number of equations increases rapidly with Q and V. An alternative model designed to address these problems is presented in the following section.
3. A Computationally Efficient Cycle Time Model for AVS/R Systems
AVS/RS cycle times are determined by the storage rack configuration, vehicle movement kinematics, storage policy and vehicle dwell point policy. In this section, we present a vehicle movement model based on a storage rack configuration for random storage AVS/RS’s using the
point of service completion (POSC) dwell point policy. Storage policy refers to the rules used to assign loads to storage positions in a system. Due to high capital costs per storage position, nearly all automated ULS/R systems use random storage (RS), [Tompkins et al, 2003]. Under this policy, the storage position occupied by a unit load over time is a random variable, i.e., a given unit load is equally likely to be located in any storage position at an arbitrary point in time.
Random storage minimizes space requirements by enabling different loads to occupy the same storage position at different times. Dwell point refers to the rule used to locate a vehicle
following a cycle completion. Most automated ULS/RS’s use the POSC dwell point rule under which idle S/R devices, e.g. vehicles, remain at the location where the last cycle is completed until seized by the next arriving transaction. The POSC assumption eliminates empty travel from the storage position of the last transaction to the load transfer point thereby reducing the ECT.
Although the assumption of the load transfer point as the dwell point can be shown to yield a much simpler analytical form for the ECT, [Fukunari and Malmborg 2004], the POSC rule is more realistic in most practical applications since it is a resource conserving strategy. The ECT model presented in this section is based on the assumptions of random storage and the POSC dwell point policy.
The following notation is used to describe variables and parameters associated with the model:
A – the number of storage aisles in the system,
C – the number of (two sided) storage columns per aisle, T – the number of storage tiers in the system,
D – storage rack depth based on the number of aisles, W – storage rack width based on the number of columns, H – storage rack height based on the number of tiers, V – the number of vehicles in the system,
L – the number of lifts in the system
vh – the velocity of the vehicle’s horizontal movement, vv – the velocity of the lift’s vertical movement,
λS – the demand rate for storage transactions, (storages per hour), λR – the demand rate for retrieval transactions, (retrievals per hour),
(xi,yi,zi) – coordinates of storage positions at location i, (xi=1…A, yj=1…C, zk=1…T), f(x) – probability that aisle x is accessed on a transaction,
f(y) – probability that column y is accessed on a transaction, f(z) – probability that tier z is accessed on a transaction,
Design conceptualization for AVS/RS’s focuses on the level of five key variables, {A,C,T,V,L}, that determine system performance and drive the majority of initial system costs. The use of random storage implies that, f(x)=1/D, f(y)=1/W and f(z)=1/H. Due to the rectilinear travel patterns used in AV-based systems, the expected travel distances between any pair of storage positions at randomly selected rack locations 1 and 2, (x1,y1,z1) and (x2,y2,z2), can be modeled separately in three dimensions. In the x axis, the expected travel distance is given by:
∫0…D x1f(x1)dx1 + ∫0…D x2f(x2)dx2 = ∫0…D x1/Ddx1 + ∫0…D x2/Ddx2 = D for z1≠z2, and
∫0…D ∫0…D│x1-x2│f(x1,x2)dx1dx2 = ∫0…D∫0…D │x1-x2│/ D2 dx1dx2
= ∫0…D ∫0…x1(x1-x2) / D2 dx1dx2 + ∫0…D ∫x1…D(x2-x1) / D2 dx2dx1 = D/3 for z1=z2.
The expected travel distance in the x axis is then given by, dx = (T-1)D/T + D/3T. By similar arguments, expected distances in the y axis and z axis are given by:
∫0…D y1/Wdy1 + ∫0…D y2/Wdx2 = W for either z1≠z2 or z1=z2, x1≠x2 and
∫0…W ∫0…W│y1-y2│/ W2 dy1dy2 = W/3 for z1=z2 and x1=x2, yielding, dy = (T-1)W/T + (A-1)W/AT + W/3AT and
∫0…H ∫0…H│z1-z2│/ H2 dz1dz2 = H/3 yielding dz = H/3.
Adding the travel distances in each dimension provides the expected distance between any two storage positions as a function of the storage rack configuration:
dij = (T-1)D/T + D/3T + (T-1)W/T + (A-1)W/AT + W/3AT + H/3 for i,j = 1,…,ACT.
The expected travel distance between any storage position and the I/O point, (0,0,0), is then obtained using:
d0j = dj0 = ∫0…D (x/D)dx + ∫0…W (y/W)dy + ∫0…H (z/H)dz = (D+H+W)/2.
Under the assumptions of random storage and the POSC dwell point, transaction demands and the location of idle vehicles following completion of storage transactions are uniformly distributed in the storage rack. The location of idle vehicles following retrieval transactions is the load transfer point. A total of six storage and six retrieval SC cycle scenarios are possible under these assumptions. SC storage cycles can be identified using the vector, (n0,n1,n2) where n0 = S signifies a storage transaction, R signifies a retrieval transaction, n1 denotes the location of the vehicle when seized by a transaction, and n2 denotes the number of vertical movements on the cycle. The possible values for the latter two parameters are:
n1= 0 for the load transfer point, 1 for the first rack tier and 2 for rack tier two or higher, n2 = 0, 1 or 2 individual lift movements on the cycle.
The probability of each cycle type under random storage is summarized below:
Type: Probability:
(S,2,2) PS22 = {(T-1)/T}2 {λS/(λS+λR)} {λR/(λS+λR)}
(S,2,1) PS21 = {(T-1)/T2}{λS/(λS+λR)} {λR/(λS+λR)}
(S,1,1) PS11 = {(T-1)/T2}{λS/(λS+λR)} {λR/(λS+λR)}
(S,0,1) PS01 = {(T-1)/T}{λS/(λS+λR)}
(S,1,0) PS10 = {1/T2}{λS/(λS+λR)} {λR/(λS+λR)}
(S,0,0) PS00 = {1/T}{λS/(λS+λR)}
(R,1,2) PR12 = {(T-1)/T}2{λR/(λS+λR)} {λS/(λS+λR)}
(R,0,2) PR02 = {(T-1)/T}{λR/(λS+λR)}
(R,2,1) PR21 = {(T-1)/T2}{λR/(λS+λR)} {λS/(λS+λR)}
(R,1,1) PR11 = {(T-1)/T2}{λR/(λS+λR)} {λS/(λS+λR)}
(R,1,0) PR10 = {1/T2}{λR/(λS+λR)} {λS/(λS+λR)}
(R,0,0) PR00 = {1/T}{λR/(λS+λR)}
The expected cycle duration is influenced by the imbedded lift service process. Since the cost of lifts is significantly less than the cost of vehicles in AVS/RS’s, most systems use control rules where the vehicle seizes the lift for the duration of the vehicle’s cycle, [Zizzi 2000]. Under this type of rule, the arrival rate to the imbedded lift system is given by:
λL = λS (PS22 + PS21 + PS11 + PS01) + λR (PR12 + PR02 + PR21 + PR11).
The expected lift service time can be formulated based on the logic for each cycle type. It includes captive lift waiting time while vehicles complete the horizontal movements included on a cycle. For example, the lift service time for cycle type, (S,2,2), is given by, H/3vv+
H/2vv+TP/D+ H/2vv, corresponding to lift movement from the current tier to the tier of the controlling vehicle, travel to the load transfer point, and travel to the destination tier. By similar reasoning, the expected lift service times for each cycle type where lift movement is required is summarized below:
Type: Expected Lift Service Time:
(S,2,2) τLS22 = H/3vv+ H/2vv+ H/2vv
(S,2,1) τLS21 = H/3vv+ H/2vv
(S,1,1) τLS11 = H/2vv+ H/2vv
(S,0,1) τLS01 = H/2vv+ H/2vv
(R,1,2) τLR12 = H/3vv+ H/3vv+2(D/2+W/2)/vh + H/2vv
(R,0,2) τLR02 = H/2vv+ H/2vv+2(D/2+W/2)/vh + H/2vv
(R,2,1) τLR21 = H/3vv+ H/2vv
(R,1,1) τLR11 = H/3vv+ H/2vv
The expected lift system service rate is then given by:
μL=( PS22τLS22+PS21τLS21+PS11τLS11+PS01τLS01+PR12τLR12+PR02τLR02+PR21τLR21+PR11τLR11)-1. As a non-Poisson queuing process, the vehicle waiting times for lift service must be approximated. Several approximation tools are available for the imbedded G/G/L lift queuing system, [Whitt 1983, Nozaki and Ross 1978]. Using Whitt’s approximation, a rough estimate of the waiting time can be obtained using:
WQL = (ca2+cs2)/2 [(LλL/μL)LP0]/[L!LμL(1- λL/μL)2],
where ca2 is the ratio of the variance of the arrival rate to the square of the mean arrival rate, (i.e., the squared coefficient of variation (SCV) of arrivals), cs2 is the SCV of the service time, and P0
denotes the idle state probability from the M/M/L model with parameters λL and μL.
Given an approximation of the waiting time for lifts, it is possible to model the transaction queuing process as an M/G/V system with parameters:
λ = (λS + λR) and μ = (τSλS/(λS+λR) + τRλR/(λS+λR))-1,
where τS and τR respectively denote the service time for storage and retrieval transactions. These service times can be approximated using expected values based on the logic associated with each cycle type. For example, the vehicle service time for cycle type (S,2,2) is estimated as:
τVS22 = (D/2+W/2)/vh + WQL + H/2vv+ H/2vv+ (D/2+W/2)/vh.
By similar reasoning, the vehicle service times for various cycle types are given as:
Type: Expected Vehicle Service Time:
(S,2,2) τVS22 = (D/2+W/2)/vh + WQL + H/2vv+ H/2vv+ (D/2+W/2)/vh
(S,2,1) τVS21 = (D/2+W/2)/vh + WQL + H/2vv+ (D/2+W/2)/vh
(S,1,1) τVS11 = (D/2+W/2)/vh + WQL + H/2vv+ (D/2+W/2)/vh
(S,0,1) τVS01 = WQL + H/2vv + (D/2+W/2)/vh
(S,1,0) τVS10 = (D/2+W/2)/vh + (D/2+W/2)/vh
(S,0,0) τVS22 = (D/2+W/2)/vh
(R,1,2) τVR12 = (D+W)/2vh + WQL + H/3vv+ (D+W)/vh+ H/2vv
(R,0,2) τVR02 = WQL + H/2vv+ (D+W)/vh+ H/2vv
(R,2,1) τVR21 = (D/3+(W+(3W(A-1)))/3A)/vh + (D+W)/vh WQL + H/2vv
(R,1,1) τVR11 = (D+W)/2vh + WQL + H/2vv+ (D+W)/vh
(R,1,0) τVR20 = (D/3+(W+(3W(A-1)))/3A)/vh + (D+W)/2vh
(R,0,0) τVR00 = (D+W)/2vh + (D+W)/2vh
Using the definitions above, we obtain an estimate of ECT as:
ECT=PS22τVS22+PS21τVS21+PS11τVS11+PS01τVS01+PR12τVR12+PR02τVR02+PR21τVR21+PR11τVR11. Given the probability distribution of the ECT, additional key measures of AVS/RS performance can be estimated. Transaction waiting time is obtainable as:
WQV = (1+cs2)/2 [((ECT)V(λS+λR))VP0]/[V!V(ECT-1)(1- (λS+λR)ECT)2],
where cs2 is the ratio of the second moment to the square of the ECT, and P0 denotes the idle state probability from the M/M/V model with parameters λ=(λS+λR) and μ=1/ECT. Based on the proportion of time that vehicles are available each hour or “vehicle efficiency”, ε, vehicle utilization can be estimated as the ratio of the product of the total number of transactions each hour to the vehicle minutes available or:
U = (λS+λR)ECT/60εV.
In the next section, the models presented in this section are illustrated using a case problem.
4. Illustration of the AVS/RS Performance Models
To illustrate an application, a sample problem is adapted from the ACCESS system case studies presented by Retrotech, Inc., (http://www.retrotech.com/access.htm). The sample problem is modeled after a facility with approximately 24,000 storage positions that processes between 1,400 and 4,300 transactions per day, (i.e., λS=λR=0.5 to 1.5 transactions per minute), with
vh=400 fpm, and vv=200 fpm. In all calculations illustrating the design conceptualization process, we assume that clearances for individual storage positions are 5’x5’x6’ including all space
allowances, and that load transfer times and vehicle and lift acceleration/deceleration effects are negligible.
Prior to illustrating the model presented in section 3 in the conceptualization process, it is useful to illustrate results from simulation based validation studies. In these studies, a total of 3,072 sample problems are generated based on the design variable ranges given by:
Number of Storage Tiers: T = 4,8,12,16 Number of Storage Aisles: A = 5,10,15,20
Number of Storage Columns: C = 25, 50, 75, 100 Number of Lifts: L = 4,5
Number of Vehicles: V = 5,6,7,8,9,10,11,12.
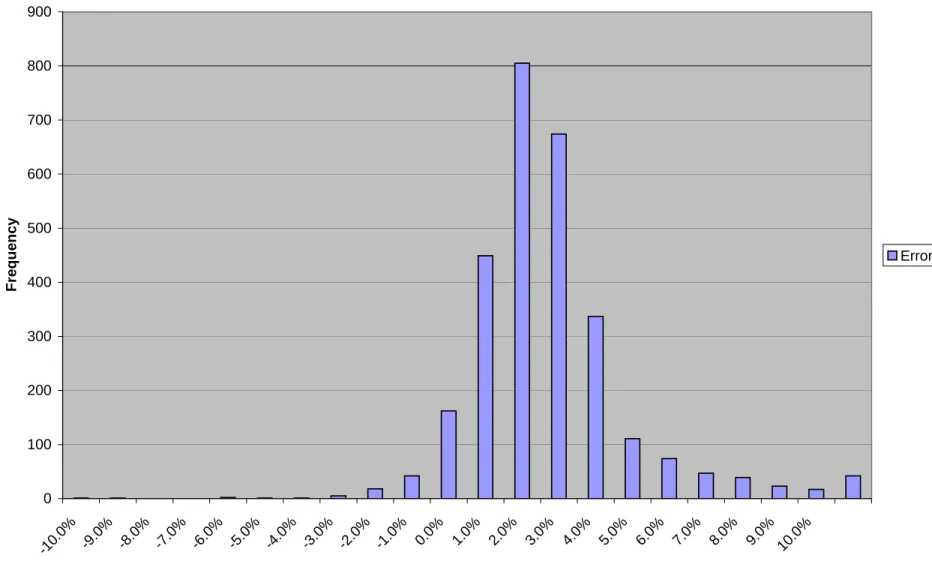
Each of the 3,072 problems is simulated, (simulation program written in C), with a run length of 50 days (1,200 hours). Statistics are collected on observed cycle times. A total of 2,851 of the simulated scenarios are feasible in that they correspond to vehicle utilization below 100%. The corresponding ECT values for these 2,851 scenarios are also computed using the analytical model and the percentage error for each feasible design scenario is computed as:
[(ECTsimulation – ECTanalytical)/ ECTsimulation] x 100%.
The average error for the 2,851 simulated design scenarios is 2.26% with an average error magnitude of 6.33%. This underestimation bias is also illustrated in figure 3 through a histogram of the percentage error values. The underestimation is attributable to the heuristic approximation of lift waiting times as described in section 3. Nevertheless, the model yields a level of accuracy well within an acceptable range for conceptualization applications where rules of thumb and analytical models with errors in the range of 10%-15% have been successfully applied by practitioners, [Eldemir et al, 2003, Malmborg 2001].
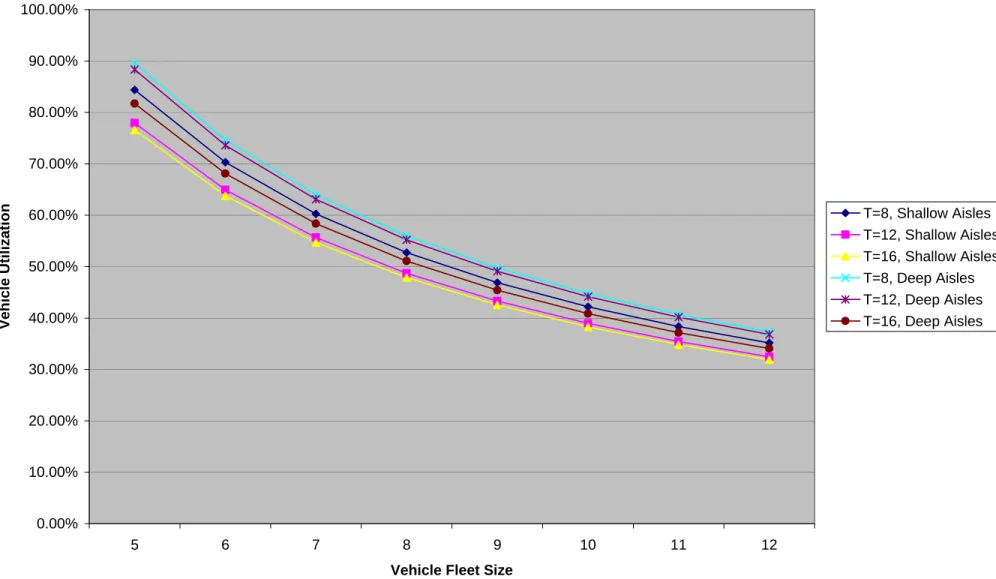
To illustrate the application of the model in the context of system conceptualization, results from sample design scenarios corresponding to 2ACT=24,000 storage positions are examined. Figure 4 summarizes fleet size and storage rack configuration effects on vehicle utilization with L=5 lifts, and an intermediate level of transactions demand, (λS=λR=2
transactions per minute). Each line in the figure corresponds to a different rack height and aisle depth combination yielding 2ACT=24,000 where “shallow” aisle scenarios correspond to rack configurations with lower values of C and higher values of A. A potentially useful observation from this figure concerns the interaction between aisle depth and rack height. For example,
significant cycle time reductions are achievable with tall racks and shallow storage aisles when vehicle utilization levels are high. This is a departure from what would be expected in traditional, crane-based AS/RS racks where simultaneous vertical and horizontal load movement takes place.
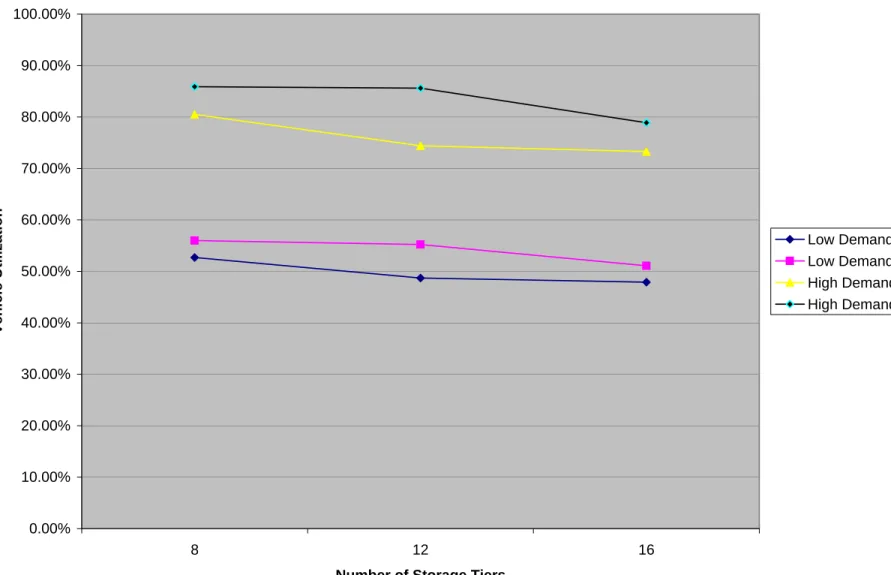
Figure 4 also illustrates a nonlinear reduction in vehicle utilization as the number of vehicles increases. This is attributable to a reduction in empty travel from the point of service completion to the load transfer point when more transactions accumulate in the active queue. Another perspective on some of these same results can be seen in figure 5 which shows the relationship between vehicle utilization and rack height with V=8 vehicles and L=5 lifts. In this case, the effect of the ratio of lift speed to vehicle speed enables taller racks to yield great travel time efficiencies than shorter rack configurations. As another example, figure 6 presents the average vehicle utilization for configurations with 24,000 storage positions for alternative combination of lift and vehicle fleet size. These results suggest that the reduction in vehicle utilization, (obtained by reduced lift waiting time), for an additional lift stabilizes when the number of vehicles exceeds V=8.
Observations such as those suggested above are used in the system conceptualization process to narrow the range of promising design alternatives for which to perform simulation based validation. For each design profile that meets user specified restrictions and requirements for throughput performance, cost and performance tradeoffs can be performed to further narrow the range of design alternatives using models such as those presented in, [Malmborg 2003].
5. Summary and Conclusions
A computationally efficient cycle time model for unit load storage and retrieval systems using autonomous vehicle technology is presented. The computational features of this model are important since the design conceptualization process for this problem requires nearly exhaustive enumeration of a design space involving several hundred thousand variable combinations in practical applications. The model yields an accuracy level that is generally sufficient for system conceptualization studies where the objective is to narrow the range of design profiles warranting more extensive simulation-based evaluation and validation. It also facilitates cost and
performance tradeoffs for autonomous vehicle systems thereby enabling direct comparisons with traditional crane-based systems. Although crane-based systems represent today’s dominant automation technology for unit load storage and retrieval systems, they are not usually cost effective in applications with low throughput capacity to storage requirements ratios. Since this is where autonomous vehicle systems may represent an economically viable alternative, the models presented in this study also have the potential to justify the expanded use of automation in many unit load storage and retrieval systems.
REFERENCES
Bozer, Y.A. and White, J.A., "Travel Time Models for Automated Storage and Retrieval Systems,"
IIE Transactions, 16, 4, 329-338 (1984).
DeWeerdt L.A., “Exploring the European Automated Warehousing Model for North America”, DSES Seminar Series, Rensselaer Polytechnic Institute, Troy, New York, April 2004.
Eldemir F., Graves R.J., Malmborg C.J., "A Comparison of Alternative Conceptualizing Tools for Automated Storage and Retrieval Systems", International Journal of Production Research, 41,18, 4517-4539 (2003).
Fukunari M., Malmborg C.J., “Analytical Design Tools for Autonomous Vehicle Unit Load Storage and Retrieval Systems”, Proceedings of the American Institute of Aeronautics and Astronautics Multidisciplinary Analysis and Optimization Conference, Albany, NY, September 2004.
Malmborg, C.J., "Rule of Thumb Heuristics for Configuring Storage Racks in Automated Storage and Retrieval Systems," International Journal of Production Research, 39, 3, 511-527 (2001).
Malmborg C.J., "Conceptualizing Tools for Autonomous Vehicle Storage and Retrieval Systems", International Journal of Production Research, 40, 8, 1807-1822, (2002).
Malmborg C.J., "Interleaving Dynamics in Autonomous Vehicle Storage and Retrieval Systems", International Journal of Production Research, 41, 5, 1057-1069, (2003).
Malmborg C.J., "Design Optimization Models for Storage and Retrieval Systems Using Rail Guided Vehicles", Applied Mathematical Modelling, 27, 12, pp. 929-941, (2003).
McHugh T., H.K. Systems, Milwaukee, WI, (personal correspondence), July 2002.
Nozaki S., Ross S., “Approximations in Finite Capacity Multiserver Queues with Poisson Arrivals”, Journal of Applied Probability, 13, 10, pp. 826-834, (1978).
Tomkins J.A., White J.A., Bozer Y., Tanchoco J.M.A., Facilities Planning, 3rd Edition, Wiley, New York, 2003.
Whitt W., “The Queuing Network Analyzer”, The Bell System Technical Journal, 62, 9, 2779-2815, (1983).
Zizzi D.V., "What's New in the Equipment Field", 2000 International Material Handling Research Colloquium, Material Handling Institute, York, Pennsylvania, June 2000.
Zollinger, H.A., "Expanded Methodology to Concept Horizontal Transportation Problem Solutions," Progress in Material Handling Research: 1996, R.J. Graves, L.F. McGinnis, D.J.
Medeiros, R.E. Ward and M.R. Wilhelm eds., Material Handling Institute, Charlotte, NC, 651- 663 (1996).
計畫成果自評
The anticipated results are:
a. Develop efficient analytical system performance models, b. Obtain vehicle and lift service time and utilization rates,
c. Study the performance of AVS/RS’s for different realistic system configuration designs,
d. Develop simulation models to validate the derived analytical models,
e. Develop regression models to establish the relationships between design factors and certain system performance which is hard to be obtained from analytical models.
Results of this research are:
a. Based on realistic assumptions, expected lift and vehicle travel times are derived.
Then lift and vehicle utilization rates are obtained.
b. System performance models are developed by applying queueing theories.
c. In numerical experiments, thousands of possible system configuration designs are studied.
d. Simulation models are developed for the above configuration designs to validate the proposed analytical models. The errors are within 15%, mostly less than 5%.
e. I n studying system performance, the interference effects of vehicles traveling in the system are ignored. Since the effects are hard to be modeled analytically, this research can not model them analytically. In future work, the other methods will be applied to study the interference effects.
AS/RS
AVSRS
Figure 1. Configuration of AS/RS and AVSRS
Figure 3. Validation Results for Expected Cycle Time
0 100 200 300 400 500 600 700 800 900
-10 .0% -9.0
% -8.0
% -7.0
% -6.0
% -5.0
% -4.0
% -3.0
% -2.0
% -1.0
% 0.0%
1.0%
2.0%
3.0%
4.0%
5.0%
6.0%
7.0%
8.0%
9.0%
10.0%
Percentage Error
Frequency
Error Frequency
Figure 4. Analysis of the Fleet Size and Configuration Effect on Utilization: Moderate Demand
0.00%
10.00%
20.00%
30.00%
40.00%
50.00%
60.00%
70.00%
80.00%
90.00%
100.00%
5 6 7 8 9 10 11 12
Vehicle Fleet Size
Vehicle Utilization T=8, Shallow Aisles
T=12, Shallow Aisles T=16, Shallow Aisles T=8, Deep Aisles T=12, Deep Aisles T=16, Deep Aisles
Figure 5. Analysis of Configuration and Utilization Relationships for V=8, L=5
0.00%
10.00%
20.00%
30.00%
40.00%
50.00%
60.00%
70.00%
80.00%
90.00%
100.00%
8 12 16
Number of Storage Tiers
Vehicle Utilization
Low Demand, Shallow Aisle Low Demand Deep Aisle High Demand, Shallow Aisle High Demand, Deep Aisle
Figure 6. Analysis of Lift and Vehicle Interactions for Rack Configurations with 2ACT=24,000
0 0.1 0.2 0.3 0.4 0.5 0.6 0.7 0.8 0.9 1
7 8 9 10 11 12
Number of Vehicles
Average Vehicle Utilization
L=4 Lifts L=5 Lifts