行政院國家科學委員會專題研究計畫 期中進度報告
腦內啡 mu 型受體作用藥改善胰島素抗阻性效果的研究(2/3)
計畫類別: 個別型計畫 計畫編號: NSC92-2320-B-006-043- 執行期間: 92 年 08 月 01 日至 93 年 07 月 31 日 執行單位: 國立成功大學藥理學科(所) 計畫主持人: 鄭瑞棠 報告類型: 精簡報告 處理方式: 本計畫可公開查詢中 華 民 國 93 年 5 月 18 日
行政院國家科學委員會補助專題研究計畫
□ 成 果 報 告
□期中進度報告
(計畫名稱)
腦內啡
mu 型受體作用藥改善胰島素抗阻性效果的研究(2/3)
計畫類別:□ 個別型計畫 □ 整合型計畫
計畫編號:NSC
92-2320-B-006-043
執行期間:
2003
年
08
月
01
日至
2004
年
07
月
31
日
計畫主持人:
鄭瑞棠
共同主持人:
計畫參與人員:
成果報告類型(依經費核定清單規定繳交):□精簡報告 □完整報告
本成果報告包括以下應繳交之附件:
□赴國外出差或研習心得報告一份
□赴大陸地區出差或研習心得報告一份
□出席國際學術會議心得報告及發表之論文各一份
□國際合作研究計畫國外研究報告書一份
處理方式:除產學合作研究計畫、提升產業技術及人才培育研究計畫、列管計畫
及下列情形者外,得立即公開查詢
□涉及專利或其他智慧財產權,□一年□二年後可公開查詢
執行單位:
國立成功大學藥理研究所
中 華 民 國 92 年 5 月 18 日 √ √ √中文摘要
本計畫利用 hyperinsulinemic euglycemic clamp technique 觀察長期餵食高果糖(60 % fructose)對胰 島素產生抗阻性(insulin resistance)的 Wistar 大鼠,其體內胰島素對葡萄糖的利用率(glucose disposal
rate)是否因為灌流β-endorphin (6 ng/kg/min) 而有所改善。希望解明嗎啡 mu 型受體(opioid
µ-receptor)在胰島素抗阻性形成過程中所扮演的角色。利用β-endorphin (6 ng/kg/min) 連續灌流 120
分鐘後發現大鼠體內胰島素對葡萄糖的利用率有明顯的改善,這項作用可被嗎啡 mu 型受體的阻斷劑
naloxone 或是 naloxonazine 所拮抗。在大鼠的離體骨骼肌,發現不論是胰島素受體磷酸化的程度或
是insulin receptor substrate (IRS)-1 的蛋白量及其磷酸化的情形,皆會因為胰島素抗阻性的形成而減 少。此外,p85 regulatory subunit of phosphatidylinositol 3-kinase (PI3-kinase) 及 Akt serine 磷酸化的程 度以及第四型葡萄糖轉運蛋白(GLUT 4)的表現量亦會因為胰島素抗阻性的形成而降低。但是,胰島 素受體蛋白的表現量並不會因為胰島素抗阻性的形成而有所影響。在已β-endorphin (6 ng/kg/min) 連 續灌流120 分鐘後的大鼠離體骨骼肌,原先因胰島素抗阻性的形成而降低表現的 IRS-1、p85 regulatory subunit of PI3-kinase 以及 Akt serine 的磷酸化程度和第四型葡萄糖轉運蛋白的表現量可恢復至接近
正常值。所以,藉由灌流β-endorphin 活化嗎啡 mu 型受體後可增強胰島素受體活化後的相關訊息路
徑,增加大鼠體內對胰島素的反應,藉以改善胰島素的抗阻性。
關 鍵 詞 : Akt; β-Endorphin; 第四型葡萄糖轉運蛋白; 胰島素受體; Insulin receptor substrate-1; Phosphatidylinositol 3-kinase
Abstract
In an attempt to probe the effect of β-endorphin on insulin resistance, we employed Wistar rats fed fructose-rich chow to induce insulin resistance. Insulin action on glucose disposal rate (GDR) was measured using the hyperinsulinemic euglycemic clamp technique, in which glucose (variable), insulin (40 mU/kg/min), and β-endorphin (6 ng/kg/min) or vehicle were initiated simultaneously and continued for 120 min. A marked reduction of insulin-stimulated GDR was observed in fructose-fed rats compared with normal control rats. Infusion of β-endorphin reversed the value of GDR that was inhibited by naloxone or naloxonazine at doses sufficient to block opioid µ-receptors. Activation of opioid µ-receptors by β-endorphin to improve insulin resistance can thus be considered. Next, soleus muscle was isolated to investigate the effect of β-endorphin on insulin signals. The insulin resistance in rats induced by excess fructose was associated with the impaired insulin receptor (IR), tyrosine autophosphorylation, and insulin receptor substrate (IRS)-1 protein content in addition to the significant decrease of IRS-1 tyrosine phosphorylation in the soleus muscle. The impaired glucose transportation was also due to signaling defects, which included an attenuated p85 regulatory subunit of phosphatidylinositol 3-kinase (PI3-kinase) and Akt serine phosphorylation. However, the IR protein level was not markedly changed in rats with insulin resistance. Infusion of β-endorphin reversed the fructose-induced decrement in the insulin-signaling cascade with the raise of GDR value. Except for the protein level of IR, infusion of β-endorphin reversed the decrease of protein expression for the IRS-1, p85 regulatory subunit of PI3-kinase, and Akt serine phosphorylation in the soleus muscle of fructose-fed rats. The decrease of insulin-stimulated protein expression of glucose transporter subtype 4 (GLUT 4) in fructose-fed rats was returned to near normal levels by β-endorphin infusion. Infusion of β-endorphin may improve the insulin resistance through the modulation of insulin signaling pathway to reverse the responsiveness of insulin.
substrate-1; Phosphatidylinositol 3-kinase
Introduction
Activation of opioid receptors in multiple effectors may result in various biological effects including analgesia, miosis, bradycardia, sedation, hypothermia, and depression of flexor reflexes [1]. Pain control is the best well-known role of opioids, although opioids also inhibit neurotransmitter release from dorsal root ganglion projections in the dorsal horn of the spinal cord [2]. In addition to the modulation of immune system, opioids also participate in the regulation of endocrine processes, including glucose metabolism [3]. It has been documented that exogenous β-endorphin induces acute increase of circulating insulin in humans with or without diabetes mellitus [4-6]. The effect of opioid on glucose homeostasis may be governed by other compounds in addition to insulin. We have shown elsewhere that β-endorphin may increase the glucose utilization via opioid µ-receptors activation, lowering plasma glucose levels in a streptozotocin-induced, type-1 diabetes-like rat model [7]. Also, the induction of insulin resistance was quicker in opioid µ-receptor knockout mice than in wild-type mice [8]. These findings support the notion of a beneficial effect of opioid µ-receptors activation on the improvement of insulin action.
Insulin resistance is a key feature of impaired glucose tolerance in type-2 diabetes [9] that can be characterized by a diminished ability of insulin sensitive tissues and a marked decrease of glucose metabolism in response to insulin. In target tissues of insulin, skeletal muscle is the primary site of insulin-mediated glucose disposal with a significant decrease of glucose uptake, as seen in insulin resistance [10]. Defects in the insulin signal cascade leading to impair glucose utilization have been proposed to play a key role in the pathogenesis of insulin resistance [11]. Also, insulin resistance is widely induced by the fructose-rich chow in animals [12, 13]. The present study was designed to characterize the effect of β-endorphin on insulin sensitivity in rats with insulin resistance using the hyperinsulinemic-euglycemic clamp.
Materials and Methods
Animal models
Male Wistar rats weighing 200-250 g were obtained from the Animal Center of National Cheng Kung University Medical College. They were maintained in a temperature-controlled room (25 ± 1 ℃) and kept on a 12:12 light-dark cycle (light on at 06:00 h). Food and water were available ad libitum. After 2 weeks on standard chow (Purina Mills, Inc.), half of the rats were randomly assigned to receive the fructose-rich chow (Teklad, Madison, WI) containing 60 % fructose for 4 additional weeks to induce insulin resistance. The other rats still received standard chow during the 4-week period. All animal procedures were performed according to the Guide for the Care and Use of Laboratory Animals of the National Institutes of Health, as well as the guidelines of the Animal Welfare Act.
Hyperinsulinemic euglycemic clamp
Food was withdrawn 12 h before the hyperinsulinemic euglycemic clamp protocol. Rats were then chronically cannulated under anesthesia with sodium pentobarbital (30.0 mg/kg, i.p.) in the femoral vein. The cannula allowed the infusion of glucose, tracer, β-endorphin, and insulin, with the femoral artery used for sampling. Animals were weighed and placed in a restrainer to which they had been acclimated before the clamp procedure. After the basal sample at -60 min, experiments were begun with a priming injection (2.5 µCi/0.5 ml) and constant infusion (0.167 µCi/min) of D-[3-3H] glucose (New England Nuclear, Boston. MA). Tracer glucose was diluted in saline containing 5.5 mmol/l unlabeled D-glucose (Sigma-Aldrich, Inc., Saint Louis, Missouri, USA) as carrier and 200 mg/dl sodium benzoate (Sigma-Aldrich, Inc.) as preservative. Fifty minutes after the start of tracer infusion, blood samples were collected in heparinized microtubes at -10 min for determination of plasma glucose concentration and glucose specific activity. At 0 min, normal Wistar rats and half of the fructose-fed rats were randomly assigned to infuse regular human insulin (Novo Industrias, Bagsvaerd, Denmark) at 40 mU/kg/min. The other fructose-fed rats were infused with regular human insulin (40 mU/kg/min) in combination with exogenous β-endorphin (Sigma-Aldrich, Inc.) at 6 ng/kg/min. The infusate of insulin or β-endorphin was diluted with saline containing 0.5% human
serum albumin (Baxter, Glendale, CA, USA). The opioid µ-receptor antagonists included naloxone (Research Biochemical Inc., Natick, MA) and naloxonazine (RBI). Each blocker was administered 30 min before β-endorphin infusion. Blood samples (10 µl) were drawn at 10-min intervals for the immediate determination of plasma glucose by the glucose oxidase method using an analyzer (Quik-Lab, Ames, Miles Inc., Elkhart, Indiana, USA). Based on these values, 20 % dextrose (Abbott, Chicago, IL) was variably infused to maintain the plasma glucose concentration at about 5.5 mmol/l. The steady state was generally achieved within 70-90 min, during which a blood sample was collected for determination of glucose specific activity. Plasma glucose specific activity was measured in duplicate after 5 % zinc sulfate and 0.3 N barium hydroxide deproteination. After termination of blood sampling at 120 min, animals were killed with a lethal dose of sodium pentobarbital (100.0 mg/kg, i.p.). The soleus muscle was excised, immediately quick frozen, and stored at –80℃ for subsequent Western blot analysis. The glucose disposal rate (GDR) at steady state was calculated using Steele’s equation [14].
Laboratory determinations
The concentration of plasma glucose was measured by the glucose oxidase method using a Quik-Lab analyzer (Miles Inc., Elkhart, Indiana, USA). The enzyme-linked immunosorbent assay (ELISA) for the determination of plasma insulin was done using a commercially available kit (Penisula Lab. Inc., Belmont, CA, USA).
Muscle processing
Soleus muscle samples used for measuring insulin signaling were weighed while still frozen and were homogenized in ice-cold lysisbuffer (1:10 wt/vol) containing 50 mmol/l HEPES (pH 7.6), 150 mmol/l NaCl, 20 mmol/l sodium pyrophosphate, 20 mmol/l β-glycerophosphate, 10 mmol/l sodiumfluoride, 2 mmol/l sodium orthovanadate (Na3VO4), 2 mmol/l EDTA (pH 8.0),1% Nonidet P-40, 10% glycerol, 1 mmol/l
phenylmethylsulfonyl fluoride, 1 mmol/l MgCl2, 1 mmol/l CaCl2, 10 µg/ml leupeptin, and 10 µg/ml
Homogenateswere incubated on ice for 20 min and then centrifuged at 15,000Xg for 20 min at 4°C.
Muscle debris was removed, and protein concentrationsof crude extracts were estimated by BioRad protein dye binding assay (Richmond, CA, USA). Supernatantwas stored at 80°C untilused.
Immunoprecipitation and immunoblotting
A 1-mg sample of total protein was used for immunoprecipitationwith anti-insulin receptor β-subunit antibody or anti-IRS-1 antibody at 4°C overnight, followed by the addition of Protein A-Sepharose beads (Sigma-Aldrich, Inc.) for 1 h. The protein bead-antibodycomplexes were precipitated by briefcentrifugation. The pellets were washed three times in ice-cold buffer (0.5% Triton X-100, 100 mmol/l Tris, pH 7.4, 10 mmol/l EDTA and 2 mmol/l sodium vanadate), and then resuspended in Laemmli sample buffer, and boiled for 5 min before sodium dodecyl sulfate-polyacrylamide gel electrophoresis (SDS-PAGE) (10 % acrylamide gel) using Bio-Rad Mini-Protein II system (55V and 130V during the stacking and separation gels, respectively). Protein was transferred to a polyvinylidene difluoride membrane using a Bio-Rad Trans-Blot system (2 h at 20 V in 25 mmol/l Tris, 192 mmol/l glyceine and 20 % MeOH). Following transfer, the membrane was probed with anti-insulin receptor β-subunit antibody (NeoMarkers, Fremont, CA, USA), anti-IRS-1 antibody (NeoMarkers) or anti-phosphotyrosine antibody (Santa Cruz Biotechnology, Inc., Santa Cruz, CA, USA) according to manufacturers instructions.
For the detection of the p85 regulatory subunit of PI3-kinase, Akt serine (Ser473) phosphorylation and CLUT 4 content, equal amounts (50 µg) of proteinwere prepared from muscle homogenates and subjected to SDS-PAGE, transferred to expand polyvinylidene difluoride membrane as describedabove and blotted with anti-PI3-kinase p85 subunit antibody (NeoMarkers), anti-phosphoserine (Ser473) Akt antibody (Cell Signaling Technology, Inc., Beverly, MA, USA) or anti-GLUT4 antibody (Genzyme Diagnostics, Cambridge, MA, USA) according to manufacturers instructions. The intensity of the blots incubated with mouse monoclonal antibody to bind the actin (Santa Cruz Biotechnology, Inc.) were used as controls to ensure that the amount of protein loaded into each lane of the gel was constant.
20), membranes were then incubated with the appropriate peroxidase-conjugated secondary antibodies. The membranes were then washed three times in TBST and visualized on X-ray film using the enhanced chemiluminescence detectionsystem (Amersham Corp., Braunschweig, Germany) according to the protocol of the manufacturer. Densities of the obtained immunoblots were quantified using a laser densitometer.
Statistical analysis
Data were expressed as the mean ± SE for the number (n) of animals in the group as indicated in the tables and figures. Statistical differences among groups were determined by using two-way repeated-measures ANOVA. The Dunnett range post-hoc comparisons were used to determine the source of significant differences where appropriate. A P-value < 0.05 was considered statistically significant.
Results
Four weeks after fructose feeding, rats were significantly heavier than those from the standard chow fed group (312.4 ± 7.2 g/rat vs. 201.1 ± 6.3 g/rat, P < 0.05). The fasting plasmaglucose concentrations were higher in the fructose-fed rats as compared with standard chow fed controls (10.2 ± 2.1 mmol/l vs. 5.5 ± 1.8 mmol/l, P < 0.05). In addition, the fasting plasma insulin concentration in the fructose-fed rats was also markedly increased as compared with that of standard chow fed controls (15.3 ± 3.8 µU/ml vs. 162.7 ± 7.1 µU/ml, P < 0.05).
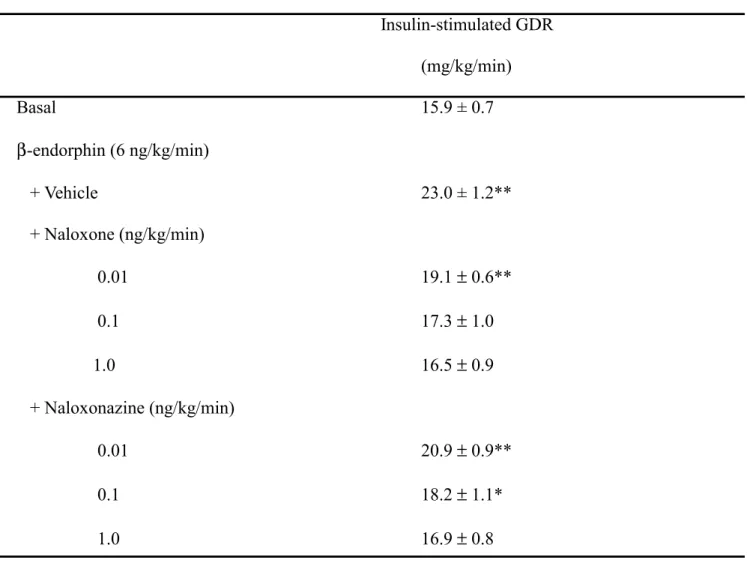
At the steady state of the hyperinsulinemic euglycemic clamp, a significant blunting in the insulin-stimulated GDR (16.6 ± 0.8 mg/kg/min) was obtained from fructose-fed rats as compared to that of the normal rats (25.7 ± 1.7 mg/kg/min) (Fig. 1). In the preliminary experiments, infusion of β-endorphin improved the fructose-induced decrement of insulin-stimulated GDR in a dose-dependent manner from 1 ng/kg/min to 6 ng/kg/min (Fig. 1). We used the most effective dose (6 ng/kg/min) of β-endorphin in the present study. The value of insulin-stimulated GDR in β-endorphin-treated group became 22.2 ± 1.9 mg/kg/min, which was shown no different to that of normal control group (Fig. 1). In the presence of naloxone (1 ng/kg/min), the action of β-endorphin was deleted and insulin-stimulated GDR became 16.5 ±
0.9 mg/kg/min that was close to the value in fructose-fed rats (Table 1). Similarly, pretreatment of naloxonazine (1 ng/kg/min) abolished the action of β-endorphin to result in the insulin-stimulated GDR (16.9 ± 0.8 mg/kg/min) near to that in fructose-fed rats (Table 1).
Figure 2 shows the representative Western blots of insulin receptor protein expression under insulin-stimulated conditions. There was no difference in the expression of insulin receptor between rats fed with or without fructose-rich chow. β-endorphin infusion did not modify these values. However, the insulin-stimulated increment in tyrosine phosphorylation of the insulin receptor in soleus muscle was significantly decreased in fructose-fed rats, which was about 60 % of that of the control group (Fig. 2). In fructose-fed rats, infusion of β-endorphin reversed the insulin-stimulated tyrosine phosphorylation of the insulin receptor in soleus muscle in a different manner different to that receiving vehicle treatment. However, the effect of β-endorphin on the degree of insulin receptor tyrosine phosphorylation was not significantly different between fructose-fed rats and the control group.
After insulin stimulation, the IRS-1 protein level exhibited a marked reduction in soleus muscle of fructose-fed rats as compared to the normal control group. The expression of IRS-1 protein in soleus muscle of fructose-fed rats during clamp was about 30 % of that from the control group under insulin-stimulated condition (Fig. 2). Although the IRS-1 protein expression was reversed in fructose-fed rats by β-endorphin infusion, the level did not recover to that of normal rats. There was about a 20 % decrease of IRS-1 protein level in β-endorphin-infused animals as compared to normal rats (Fig. 2). IRS-1 tyrosine phosphorylation in response to insulin stimulation in the soleus muscle of fructose-fed rats was about 23 % of that in normal animals. However, insulin-stimulated IRS-1 tyrosine phosphorylation was markedly reversed in the β-endorphin-infused group, which achieved the level near normal rats (Fig. 2).
The expression of p85 regulatory subunit of PI3-kinase in response to insulin in the soleus muscle of fructose-fed rats was decreased 53 % from that of the normal controls (Fig. 3). β-endorphin reversed the p85 regulatory subunit of PI3-kinase expression in soleus muscle of fructose-fed rats by approximately87 % of the values of normal animals (Fig. 3).
in the soleus muscle of fructose-fed rats. The reduction was about 50 % of that from normal rats (Fig. 3). Although the degree of insulin-stimulated Akt serine phosphorylation was reversed in fructose-fed rats by β-endorphin infusion, the level did not recover to that of normal controls (Fig. 3).
A significant decrease in GLUT 4 protein expression was observed in the soleus muscle of fructose-fed rats; only about 53 % of that from normal rats (Fig. 4). The protein level of GLUT 4 in β-endorphin-infused group was significantly elevated to about 1.8-fold of that in the fructose-fed rats who received vehicle treatment. GLUT 4 protein levels in the soleus muscle of fructose-fed rats was reversed to near normal control levels by β-endorphin infusion (Fig. 4).
Discussion
In insulin resistance, certain intracellular signaling pathways are more resistant to the stimulation of insulin than others [11]. Studies in rats have demonstrated that high intake of fructose produces a decline in insulin sensitivity in peripheral tissues associated with insulin resistance [12, 13]. Several methods have been established to assess the insulin sensitivity in animals and humans. Of these methods, the hyperinsulinemic euglycemic clamp is the most widely used [15]. The ability of insulin to stimulate glucose disposal assessed by this method is markedly impaired in chronic fructose-fed rats indicating the presence of insulin resistance. In the present study, we found that insulin-mediated glucose utilization identified by the rate of glucose disposal was raised in the β-endorphin-infused group. This shows that β-endorphin has the ability to improve the insulin sensitivity in insulin target tissues. This action of β-endorphin was abolished by naloxone or naloxonazine at doses sufficient to block opioid µ-receptors. Activation of opioid µ-receptors by β-endorphin to improve insulin resistance can thus be considered. These results are consistent with the previous finding that insulin resistance is more easily induced in the absence of opioid µ-receptors [8].
Skeletal muscle is recognized as the major tissue of insulin-stimulated glucose disposal, hence the impaired in vivo glucose disposal must be manifest in skeletal muscle [10]. Also, insulin action is greater in the red type I fibers of the soleus muscle [16]. It would be helpful to know the possible mechanism(s) of
β-endorphin to improve insulin resistance in relation with insulin signals. With this aim in mind, we prepared soleus muscle samples from all animals after the hyperinsulinemic euglycemic clamp.
The final mediator of reduced glucose clearance in fructose-fed rats is due to the decrease of glucose transporter subtype-4 (GLUT 4) function in skeletal muscle cell [17, 18]. Recent evidence favors the suggestion that a decrease of GLUT 4 activity is related to the abnormalities in insulin signal system involving insulin receptor substrate (IRS)-1 and phosphatidylinositol 3-kinase (PI3-kinase) [19, 20]. Thus, we analyzed the insulin signal pathway in soleus muscle of rats with insulin resistance induced by fructose-rich chow. There was no difference in the protein expression of insulin receptor among the groups of rats with or without fructose feeding, while the insulin stimulation of tyrosine phosphorylation of insulin receptor β-subunits was uniformly reduced. Moreover, the contents of IRS-1 and IRS-1 tyrosine phosphorylation, the subsequent step in insulin signal cascade, were markedly changed in this animal model with insulin resistance. The results support the view that excess fructose not only impaires insulin receptor autophosphorylation but also leads to a striking decrease in IRS-1 protein expression and less phosphorylation of IRS-1 in soleus muscle, whereas the insulin receptor protein is not changed. We found that β-endorphin reversed the defect in insulin receptor autophosphorylation, as well as the protein expression and the degree of phosphorylation in IRS-1 of soleus muscle from fructose-fed rats, while the protein expressions of insulin receptor were not changed (Table 2). Although the expression of insulin receptor protein in fructose-fed rats was not altered by β-endorphin infusion, the change of insulin receptor function cannot be ruled out. More experiments including the insulin receptor binding are needed to clarify this point.
Usually, IRS-1 tyrosine phosphorylation in response to insulin stimulation increased IRS-1 association with p85, the regulatory subunit of PI3-kinase, which is the main molecule linking insulin signal to glucose transport [21]. We found that protein expression of p85 regulatory subunit of PI3-kinase was markedly decreased in the soleus muscle of fructose-fed rats. Also, the expression of insulin-stimulated p85 regulatory subunit of PI3-kinase in fructose-fed rats was restored by β-endorphin infusion. Taken together, we suggest that excess fructose may interfere with insulin action by altering the intrinsic activity of insulin signals
resulting in the impairment of insulin sensitivity in peripheral tissue. The recovery of insulin action to enhance glucose disposal by β-endorphin was associated with an improvement in IRS-1/PI3-kinase pathway.
Although the signal intermediaries downstream from PI3-kinase remains to be delineated, the current data indicates that serine/threonine kinase protein B (PKB) (also known as Akt) is a potential link between insulin-stimulated PI3-kinase; IRS-1 association may enhance PI3-kinase to activate Akt [22, 23]. We observed the insulin-stimulated Akt serine phosphorylation (Ser473) was markedly decreased as compared with that in normal controls. Also, the insulin-stimulated Akt serine phosphorylation in fructose-fed rats was reversed by β-endorphin infusion. Impairment of Akt serine phosphorylation in cells from animals exhibited insulin resistance has been documented [24, 25]. The serine phosphorylation of Akt appears to be a sensitive marker of insulin resistance to reflect insulin-induced PI3-kinase activity. Therefore, our data provides a plausible explanation, nmaely that a marked decrease in insulin-stimulated serine phosphorylation of Akt accompanied by the lowering of insulin-stimulated PI3-kinase activity facilitates insulin resistance in rats receiving fructose-rich chow. Taken together, our observations are consistent with excess fructose causing insulin resistance as well as a decrease in IRS-1/PI3-kinase. The reversal observed using β-endorphin highlights the relational changes in IRS-1/PI3-kinase and insulin sensitivity.
Insulin increases glucose uptake into cells mainly through the action of GLUT 4 and impairment of GLUT 4 action in skeletal muscle of many animal models with insulin resistance [17, 18]. Recently, Akt has been implicated as one of the potential mediators in insulin signals for glucose transportation, in which glucose uptake and GLUT 4 action could be stimulated by phosphorylated Akt in the target tissues [23, 24]. In the present study, we used a membrane isolation-Western blotting procedure to localize GLUT 4 in soleus muscle of fructose-fed rats. There was a decrease of GLUT 4 protein immunoblot in the membrane fraction of soleus muscle from fructose-fed rats, which could be reversed by β-endorphin infusion. Although we did not compare the differences of GLUT 4 protein between the cytosol and membrane fractions, it seems reasonable to suggest that decrease of GLUT 4 protein in the membrane is related to the impairments of insulin signal pathways in fructose-fed rats. Thus, β-endorphin reversed the responsiveness to insulin in
animals with insulin resistance by an enhancement of PI3-kinase/Akt activity to raise more GLUT 4 in the membrane for glucose transportation.
The detailed mechanisms for the induction of insulin resistance in carbohydrate-fed animals are still not clear. According to our results, it seems that excess fructose may influence the insulin signals but not the change of insulin receptor protein content. Moreover, the intracellular mechanisms for insulin resistance in fructose-fed rats are similar with the defect caused in genetically obese Zucker rats. Insulin-stimulated PI3-kinase activity associated IRS-1 is markedly reduced, withAkt phosphorylation and translocation of GLUT 4 to the membrane also being impaired in response to insulin [25]. Although IRS-2 expression is less than IRS-1 in skeletal muscle [26], it is another substrate for the insulin receptor to regulate muscle glucose metabolism. Therefore, the effect of excess fructose on the IRS-2 related signals cannot be excluded and requires further study.
In the present study, the effect of β-endorphin on insulin resistance is mainly mediated by activation of opioid µ-receptors in a way that is consistent to previous findings [27]. Protein kinase C (PKC) activation in a phospholipase C (PLC) dependent-mechanism is the main signal linked to opioid µ-receptors [28-32]. PLC and PKC may participate in the insulin signals linked to the glucose transporter system [28, 29]. A beneficial effect of opioid µ-receptors on the morphine-induced supraspinal antinociception linked the PI3 kinase and PLC pathway has been documented in the mouse [30]. The mechanism of the opioid tolerance involves a number of signals including PLC-PKC pathway has been established [31]. Also, opioid µ-receptors activation to lower the plasma glucose concentration has been demonstrated via the PLC-PKC pathway in insulin deficient animals [32]. Furthermore, diacylglycerol-sensitive PKCs did not appear to be required for insulin effects on glucose transport, whereas the atypical PKCs was essential for insulin stimulation of glucose transport in adipocytes and muscle tissue [33, 34]. Although atypical PKCs located downstream from IRS-1 and PI3 kinase in the established insulin signal pathways, IRS-1 is also a novel physiological substrate for atypical PKCs [35]. Therefore, further studies are required to define the role of PKC isoforms in the signaling of opioid µ-receptors linked to insulin signal pathways in the insulin resistant state. Nevertheless, our findings suggest that β-endorphin might improve insulin resistance. Injection of
exogenous β-endorphin produced only a transient lowering of plasma glucose in STZ-diabetic rats [36]. Thus, more experiments are required to evaluate the effect of chronic administration of β-endorphin on insulin resistance in advance.
In conclusion, the present study found that β-endorphin could amend the impairment of insulin-stimulated glucose disposal in fructose-fed rats. This improvement of insulin resistance was associated with an increase in insulin receptor autophosphorylation and tyrosine phosphorylated IRS-1, the expression of p85 regulatory subunit of PI3-kinase or/and Akt Ser473 phosphorylation to result in an increase of insulin-stimulated GLUT 4 protein in membrane for glucose transportation. Our data provide the beneficial effect of opioid µ-receptors activation on the improvement of insulin resistance. Due to the short half-life of peptide, development of β-endorphin in clinic might be limited. Therefore, development of chemical agents for activation of opioid µ-receptors without opiate-like central nervous effect seems helpful in the therapeutic handling of type-2 diabetic patients.
References
1. Chevlen E. Opioids: a review. Curr Pain Headache Rep 2003; 7: 15-23
2. Yaksh TL. Pharmacology and mechanisms of opioid analgesic activity. Acta anaesthesiol Scand 1997;
41: 94-111
3. Smith EM. Opioid peptides in immune cells. Adv Exp Med Biol 2003; 521: 51-68
4. Curry DL, Li CH. Stimulation of insulin secretion by beta-endorphin (1-27 and 1-31). Life Sci 1987;
40: 2053-2058
5. Locatelli A, Spotti D, Caviezel F. The regulation of insulin and glucagon secretion by opiates: a study
with naloxone in healthy humans. Acta Diabetol 1985; 22: 25-31
6. Khawaja XZ, Green IC, Thorpe JR, Titheradge MA. The occurrence and receptor specificity of
endogenous opioid peptides with pancreas and liver of the rat. Comparison with brain. Biochem J 1990; 267: 233-240
streptozotocin-induced diabetic rats. Horm Meta Res 2002; 34: 570-576
8. Cheng JT, Liu IM, Hsu CF. Rapid induction of insulin resistance in opioid mu-receptor knock-out mice.
Neurosci lett 2003; 339: 139-142
9. Kruszynska YT, Olefsky JM. Cellular and molecular mechanisms of non-insulin dependent diabetes
mellitus. J Invest Med 1996; 44: 413-428
10. DeFronzo RA: Pathogenesis of type 2 (non-insulin dependent) diabetes mellitus: a balanced overview.
Diabetologia 1992; 35: 389-397
11. Shulman GI. Cellular mechanisms of insulin resistance. J Clin Invest 2000; 106: 171-176
12. Higashiura K, Ura N, Takada T, Li Y, Torii T, Togashi N, Takada M, Takizawa H, Shimamoto K. The
effects of an angiotensin-converting enzyme inhibitor and an angiotensin II receptor antagonist on insulin resistance in fructose-fed rats. Am J Hypertens 2000; 13: 290-297
13. Lambert K, Py G, Robert E, Mercier J. Does high-sucrose diet alter skeletal muscle and liver
mitochondrial respiration? Horm Metab Res 2003; 35: 546-550
14. Steele R. Influence of glucose loading and injected insulin on hepatic glucose output. Ann N Y Acad
Sci 1959; 82: 420-430
15. Bessesen DH. The role of carbohydrates in insulin resistance. J Nutr 2001; 131: S2782-S 2786
16. James DE, Jenkins AB, Kraegen EW. Heterogeneity of insulin action in individual muscles in vivo:
euglycemic clamp studies in rats. Am J Physiol 1985; 248: E567-E574
17. Kurokawa K, Oka Y. Insulin resistance and glucose transporter. Nippon Rinsho 2000; 58: 310-314 18. King PA, Horton ED, Hirshman MF, Horton ES. Insulin resistance in obese Zucker rat (fa/fa) skeletal
muscle is associated with a failure of glucose transporter translocation. J Clin Invest 1992; 90: 1568-1575
19. Anai M, Funaki M, Ogihara T, Kanda A, Onishi Y, Sakoda H, Inukai K, Nawano M, Fukushima Y,
Yazaki Y, Kikuchi M, Oka Y, Asano T. Enhanced insulin-stimulated activation of phosphatidylinositol 3-kinase in the liver of high-fat-fed rats. Diabetes 1999; 48: 158-169
rats. J Clin Invest 1999; 104: 447-457
21. White MF. The insulin signalling system and the IRS proteins. Diabetologia 1997; 40: S2-S17
22. Kitamura T, Ogawa W, Sakaue H, Hino Y, Kuroda S, Takata M, Matsumoto M, Maeda T, Konishi H,
Kikkawa U, Kasuga M. Requirement for activation of the serine-threonine kinase Akt (protein kinase B) in insulin stimulation of protein synthesis but not of glucose transport. Mol Cell Biol 1998; 18: 3708-3717
23. Klippel A, Kavanaugh WM, Pot D, Williams LT. A specific product of phosphatidylinositol 3-kinase
directly activates the protein kinase Akt through its pleckstrin homology domain. Mol Cell Biol 1997; 17: 338-344
24. Lima MH, Ueno M, Thirone AC, Rocha EM, Carvalho CR, Saad MJ. Regulation of IRS-1/SHP2
interaction and AKT phosphorylation in animal models of insulin resistance. Endocrine 2002; 18: 1-12
25. Carvalho E, Rondinone C, Smith U. Insulin resistance in fat cells from obese Zucker rats--evidence for
an impaired activation and translocation of protein kinase B and glucose transporter 4. Mol Cell Biol 2000; 206: 7-16
26. Cusi K, Maezono K, Osman A, Pendergrass M, Patti ME, Pratipanawatr T, DeFronzo RA, Kahn CR,
Mandarino LJ. Insulin resistance differentially affects the PI 3-kinase- and MAP kinase-mediated signaling in human muscle. J Clin Invest 2000; 105: 311-320
27. Goldstein A. Binding selectivity profiles for ligands of multiple receptor types: focus on opioid
receptors. Trends Pharmacol Sci 1987; 8: 456-459
28. Ishizuka T, Cooper DR, Hernandez H, Buckley D, Standaert M, Farese RV. Effects of insulin on
diacylglycerol-protein kinase C signaling in rat diaphragm and soleus muscles and relationship to glucose transport. Diabetes 1990; 39: 181-190
29. Van Epps-Fung M, Gupta K, Hardy RW, Wells A. A role for phospholipase C activity in
GLUT4-Mediated glucose transport. Endocrinology 1997; 138: 5170-5175
30. Narita M, Ohnishi O, Nemoto M, Aoki T, Suzuki T: The involvement of phosphoinositide 3-kinase
antinociception in the mouse. Nihon Shinkei Seishin Yakurigaku Zasshi 2001; 21: 7-14
31. Freye E, Latasch L: Development of opioid tolerance - molecular mechanisms and clinical
consequences. Anasthesiol Intensivmed Notfallmed Schmerzther 2003; 38: 14-26
32. Liu IM, Liou SS,Chen WC, Chen PF, Cheng JT. Signals in the activation of opioid µ-receptors by
loperamide to enhance glucose uptake into cultured C2C12 cells. Horm Meta Res (in press)
33. Bandyopadhyay G., Standaert ML, Kikkawa U, Ono Y, Moscat J, Farese RV: Effects of transiently
expressed atypical (zeta, lambda), conventional (alpha, beta) and novel (delta, epsilon) protein kinase C isoforms on insulin-stimulated translocation of epitope-tagged GLUT4 glucose transporters in rat adipocytes: specific interchangeable effects of protein kinases C-zeta and C-lambda. Biochem J 1999; 337: 461-470
34. Vollenweider P, Menard B, Nicod P: Insulin resistance, defective insulin receptor substrate 2-associated
phosphatidylinositol-3' kinase activation, and impaired atypical protein kinase C (zeta/lambda) activation in myotubes from obese patients with impaired glucose tolerance. Diabetes 2002; 51: 1052-1059
35. Ravichandran LV, Esposito DL, Chen J, Quon MJ. Protein kinase C-zeta phosphorylates insulin
receptor substrate-1 and impairs its ability to activate phosphatidylinositol 3-kinase in response to insulin. J Biol Chem 2001; 276: 3543-3549
36. Liu IM, Niu CS, Chi TC, Kuo DH, Cheng JT. Investigations of the mechanism of the reduction of
Table 1 Effects of opioid µ-receptor antagonists on insulin-stimulated GDR at steady state of
hyperinsulinemic euglycemic clamp in fructose-fed rats with β-endorphin infusion Insulin-stimulated GDR (mg/kg/min) Basal 15.9 ± 0.7 β-endorphin (6 ng/kg/min) + Vehicle 23.0 ± 1.2** + Naloxone (ng/kg/min) 0.01 19.1 ± 0.6** 0.1 17.3 ± 1.0 1.0 16.5 ± 0.9 + Naloxonazine (ng/kg/min) 0.01 20.9 ± 0.9** 0.1 18.2 ± 1.1* 1.0 16.9 ± 0.8
Values (mean ± SE) were obtained from each group of 8 animals. *P < 0.05 and **P < 0.01 versus data from fructose-fed rats treated with vehicle.
Fig. 1 0 5 10 15 20 25 30 Insuli n-sti m ulat ed G DR (m g/k g /m in )
vehicle vehicle B-endorphin
(1 ng/kg/min)
Normal rats Fructose-fed rats
B-endorphin (2 ng/kg/min) B-endorphin (4 ng/kg/min) B-endorphin (6 ng/kg/min) ** ** *
Fig. 1 Changes of insulin-stimulated GDR at steady state of hyperinsulinemic euglycemic clamp in
fructose-fed rats with or without β-endorphin infusion. Values (mean ± SE) were obtained from each group of 6 animals. *P < 0.05 and **P < 0.01 versus data from normal rats treated with vehicle.
Fig. 2
Fig. 2 Representative immunoblot of protein expression and insulin-stimulated tyrosine phosphorylation in
isolated soleus muscle of rats after hyperinsulinemic euglycemic clamp. The lanes show vehicle-treated normal rat (lane 1), vehicle-treated fructose-fed rat (lane 2), β-endorphin-infused fructose-fed rat (lane 3). Similar results were also obtained in another four determinations.
Fig. 3
Fig. 3 The representative immunoblot of p85 regulatory subunit of PI3-kinase (PI3k (p85α)) expression and
insulin-stimulated Akt serine phosphorylation (pAkt (S473)) in isolated soleus muscle of rats after hyperinsulinemic euglycemic clamp. The lanes show vehicle-treated normal rat (lane 1), vehicle-treated fructose-fed rat (lane 2), β-endorphin-infused fructose-fed rat (lane 3). Similar results were also obtained in another 4 determinations.
Fig. 4.
Fig. 4 Representative immunoblot of GLUT 4 expression in isolated soleus muscle of rats after
hyperinsulinemic euglycemic clamp. Lanes show vehicle-treated normal rat (lane 1), vehicle-treated fructose-fed rat (lane 2), β-endorphin-infused fructose-fed rat (lane 3). Similar results were also obtained in another 4 determinations