• 沒有找到結果。

Taiwanese Public Awareness and Attitudes about Global Warming and Intentions to Participate in Planting Trees for

N/A
N/A
Protected

Academic year: 2021

Share "Taiwanese Public Awareness and Attitudes about Global Warming and Intentions to Participate in Planting Trees for "

Copied!
21
0
0

加載中.... (立即查看全文)

全文

(1)

Taiwanese Public Awareness and Attitudes about Global Warming and Intentions to Participate in Planting Trees for

Carbon Sequestration

Jiunn-Cheng Lin, 1) Chin-Shien Wu, 1) Wan-Yu Liu, 2,3) Chun-Chih Lee 1) ȪSummaryȫ

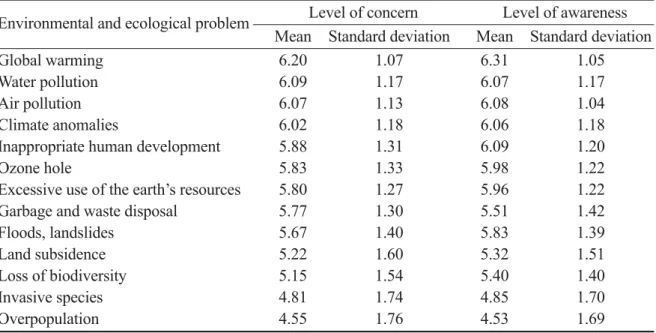
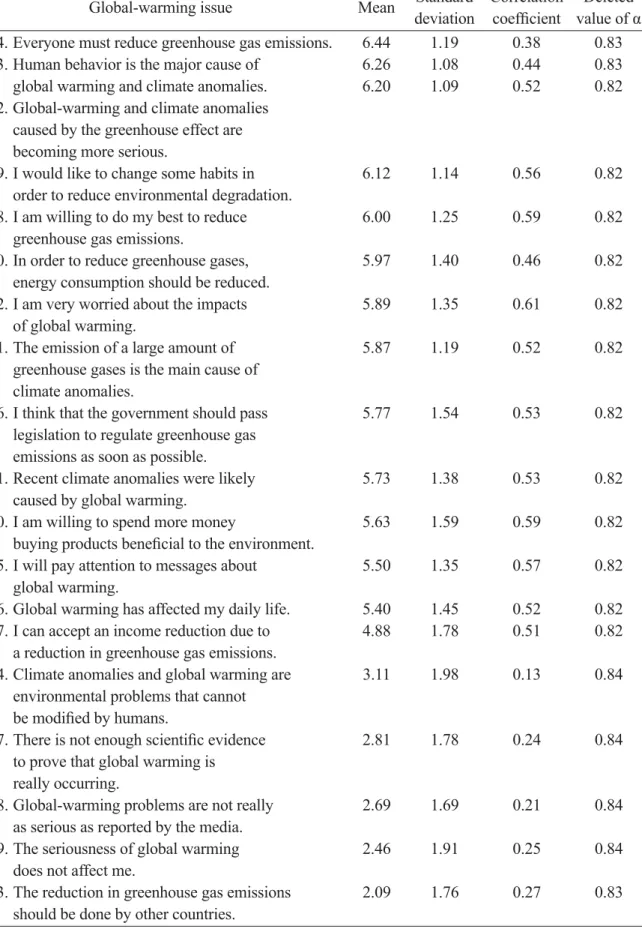
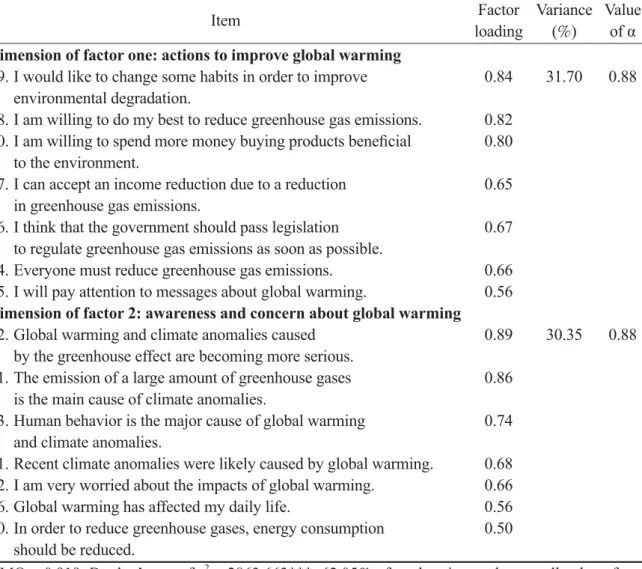
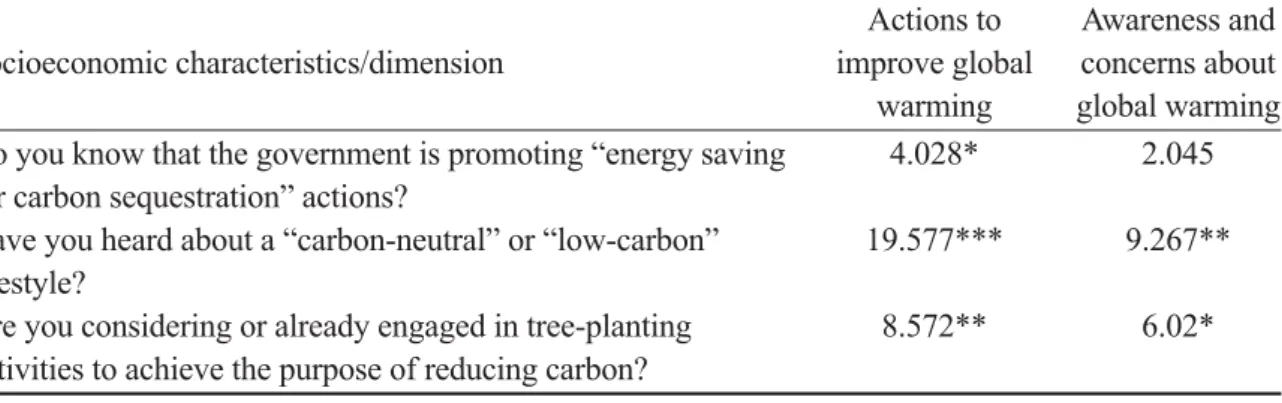
As planting trees is one of the feasible strategies for reducing greenhouse gases, this study conducted a mail questionnaire survey on the topics of global warming and planting trees, in which respondents were the general public in Taiwan. Based on this survey, we determined and analyzed the general public’s feelings, attitudes, and awareness about some environmental and ecological problems, such as global warming and climate change, and further investigated the extent to which they might participate in planting tree for carbon sequestration. Our results showed that respon- dents were most concerned about global warming among environmental and ecological problems, and also thought that global warming was the most serious problem. By a one-way ANOVA, it was found that significant differences existed in the level of respondents’ concern about global warm- ing based on their age and educational level. By a factor analysis, 2 common factors of ‘improved action of global warming’ and ‘awareness of and concern about global warming’ were extracted from the ‘improved action of global warming’ dimension, where the highest level of education and occupation showed significant differences. The percentage of respondents who considered or had been engaged in tree-planting activities to reduce carbon accounted for 81.4L of the total. Among 5 suggested programs for planting trees, the ratio of planting trees in a personal garden or on one’s balcony was the highest, which accounted for 79.0L. On the impetus for policies, this study dis- covered that if the public understood the contents of policies more clearly, then their intention to participate in planting trees would also rise. As a consequence, it is suggested to enhance persua- sion and guidance of the public to participate in planting trees to reduce carbon, so as to increase their understanding of related information about planting trees, and also to achieve effective com- munication.

Key words: global warming, climate change, carbon sequestration, planting trees, afforestation in- tention.

Lin JC, Wu CC, Liu WY, Lee CC. 2012. Taiwanese public awareness and attitudes about global warming and intentions to participate in planting trees for carbon sequestration. Taiwan J For Sci 27(1):59-79.

1 )

F o r e s t r y E c o n o m i c s D i v i s i o n , Ta i w a n F o r e s t r y R e s e a r c h I n s t i t u t e , 5 3 N a n - H a i R d . , Ta i p e i 1 0 0 1 4 ,

Taiwan. ݔཿၑᡜܛݔཿစᔽಣȂ10014ᇄіҀϜҔୣࠓ੖ၰ53ဵȄ

2)

Department of Tourism Information, Aletheia Univ., 32 Zhenli St., Tamsui Dist., New Taipei City

25103, Taiwan. ઎౪τᏱᢏӏ኶՞ޤᜌᏱقȂ25103ུіҀసЬୣ઎౪ຘ32ဵȄ

3)

Corresponding author, e-mail:[email protected] ೾ଊձ޲Ȅ

Received August 2011, Accepted January 2012. 2011Ԓ8Уଛቸ 2012Ԓ1У೾ႇȄ

(2)

ःفൣ֚

Җಁᄈӓ౩ཹϾޤញȃᄙ࡚ᇅෛݔ෶ᆈཏ᜺ϟःف

ݔ߹Ԛ 1) ֕߹፲ 2) ࢪஏ। 3,4) ؄߹ע 2)

ᄣ ्

ෛᐚആݔ࣐ྤࡊ੊ᡞ෶໕ޠѠ՘๋౲ϟΚȂҐःفпᇄᢋҖಁ࣐ᄈຬໍ՘໐஛ୱڣ።ࢦȂпᕤ

၍Җಁᄈє֥ӓ౩ཹϾޠޤញᇅᄙ࡚ȂໍΚؐ௥فᄈෛݔ෶ᆈޠ୥ᇅཏ᜺Ȅ๗ݏึ౫Ȉڨ೥޲ᄈȶӓ ౩ཹϾȷޠᜱЗโ࡚ഷାȂηᇰ࣐ȶӓ౩ཹϾȷ࣐ഷᝓ२ޠᕘძᇅҢᄙୱᚡȄᔗң൑ӱφᡑ౵኶ϸݚ ๗ݏȂڨ೥޲ᄈӓ౩ཹϾޠᜱЗโ࡚ӶԒឮІᏱᐤαԥᡘ຀ৰ౵Ȃܛᇰޤޠᝓ२โ࡚αȂࠍڨ೥޲Ᏹ ᐤІᙜཿαԥᡘ຀ৰ౵ȄᙥҦӱષϸݚȂӔ๶ڦяȶӓ౩ཹϾޠ׾๢՘୞ȷІȶӓ౩ཹϾޠᇰޤᇅᜱ ݨȷΡঐӔӤӱષȂӶȶӓ౩ཹϾޠ׾๢՘୞ȷӱષᄻ८๗ݏȂࠍӶഷାᏱᐤІᙜཿαԥᡘ຀ޠৰ

౵Ȅڨ೥޲Մኍܗϑ௄ٲෛᐚആݔٿႁԚ෶ᆈޠҭޠ޲ќ81.4LȂڐл्௵ڦޠ୥ᇅРԓȂӶܛӗя ޠ5ᆎѠ૗РԓϜȂпӶՍঢ়৴༫ܗ໩ѯෛᐚޠЩپഷାќ79.0LȄҐःفึ౫ᄈ࢈๋ޠ௱୞ȂԄҖಁ

ޤၿڐϲৡȂڐ୥ᇅཏ᜺ηཽණାȂ࡛ឋᔗђ஽ᄈෛݔ෶ᆈޠࡈᏳȂпቩђҖಁᄈࣻᜱޤᜌޠᕤ၍Ȃ ႁԚԥਞྜྷ೾Ȅ

ᜱᗥມȈӓ౩ཹϾȃ੊঑ᡑϾȃ෶ᆈȃആݔȃෛݔཏ᜺Ȅ

ݔ߹Ԛȃ֕߹፲ȃࢪஏ।ȃ؄߹עȄ2012ȄҖಁᄈӓ౩ཹϾޤញȃᄙ࡚ᇅෛݔ෶ᆈཏ᜺ϟःفȄѯᢋ ݔཿऌᏱ27(1):59-79Ȅ

INTRODUCTION

Global warming and climate change are recognized as unprecedented challenges by most countries worldwide. Climate change has already caused a great deal of serious damage, and if humans do not pay more at- tention to environmental protection, the greenhouse effect will become even more serious. According to the Intergovernmental Panel on Climate Change (IPCC), the Fourth Assessment Report estimated that by the end of this century, the average global tem- perature will have risen by 6.3ʨ, while the sea level was predicted to rise by 58 cm. If the average global temperature increases by 4ʨ, about 3 billion people will face a water- shortage crisis, and more aquatic creatures will become extinct. Another fact attesting to the seriousness of global warming is that

the average global temperature increased by 0.74 (0.56~0.92)ʨ from 1906 to 2005, which is higher than the estimated average global temperature rise from 1901 to 2000 in the IPCC Third Assessment Report (published in 2001) of an increase of 0.6 (0.4~0.8)ʨ (IPCC 2007).

During the past 2 decades, almost every

country in the world has expressed concern

about climate change and global-warming is-

sues (Thompson and Rayner 1998, DEFRA

2002, Poortinga and Pidgeon 2003, OST

and MORI 2004). According to Dunlap and

Scarce (1991), only 12 L of respondents

thought global warming was very serious

in 1982, while 36 L did not know about the

greenhouse effect. In 1988, for the same

question, 39 L of respondents thought that

(3)

global warming was very serious, while only 15L did not know about the greenhouse ef- fect. By surveying the general public from 24 different countries, Dunlap (1994) found that the public in 13 countries thought global warming was very serious in 1992. Bord et al. (2000) conducted a survey of the level of understanding about knowledge of climate change of the public in 15 different European countries, for which only 53L of respondents had a good understanding or knowledge of climate change. GlobeScan (2000) investi- gated the public in 34 different countries and found that respondents from most countries thought that global warming was a serious en- vironmental problem, but compared to other environmental problems, global warming was ranked only seventh among 8 environmental problems. Leiserowitz (2003) surveyed stu- dents at the Univ. of Oregon (USA), among which 92L of respondents had heard about global warming, and 74 L of respondents were concerned about it. Norton and Leaman (2004) surveyed the public in the UK who were older than 16 yr on their opinions about global warming, and found that almost every- one had heard about global warming, but only 67 L of respondents understood issues related to it. Although climate change and global- warming problems have received increasing amounts of attention, they were previously not the public’s major concern in terms of environmental problems. For example, some previous surveys indicated that the public paid less attention to global warming than to other environmental problems, such as water and air pollution (Bostrom et al. 1994, Kemp- ton et al. 1995, DEFRA 2002, Hinds et al.

2002, Poortinga and Pidgeon 2003, Bibbings 2004, The Polling Report 2004, Leiserowitz 2007). Curry et al. (2004) surveyed Ameri- cans about the level of their concern on 17 different environmentally related issues, and

found that water-pollution problems received the most attention, while global warming was ranked 6 among all environment-related is- sues. Leiserowitz (2004) had a similar result in which global warming was ranked fifth among 9 environmental issues.

Increasing scientific evidence has con- firmed the existence of climate change and global warming, and the resultant environ- ment changes have already greatly impacted our lives. As humans increasingly experience the seriousness of global warming, they are paying increasing attention to environmental issues caused by global warming (Leise- rowitz 2007). In a survey conducted by the Swedish Environmental Protection Agency, the ratio of Swedish respondents who had heard about climate change in 2008 was 97L, which was more than that in the 2002 survey results (89 L). And the ratio of those who thought that the situation with climate change was becoming more serious increased from 63L in 2002 to 71L in 2008 (Swed- ish Environmental Protection Agency 2008).

That study also analyzed the EU public’s

attitudes on climate change, and found that

global warming/climate change (62L) was

considered the second most serious environ-

mental problem in the world, which followed

poverty and a lack of food and drinking water

(68L). Compared to the previous survey, the

seriousness level of global warming/climate

change had increased (EU 2008). Sampei and

Aoyagi-Usui (2009) compared the Japanese

public’s awareness of environmental issues

in 1997, 2002, 2006, and 2007, and found

that the public’s awareness of environmen-

tal issues had gradually focused on global-

warming issues. Curry et al. (2005) found

that the environmental issue of most concern

to UK people was global warming (49 L). In

2006, the public in 10 different countries was

surveyed, and most of the respondents felt

(4)

threatened by environmental problems associ- ated with climate change in the next decade (Chicago Council on Global Affairs 2007).

The EU analyzed the EU public’s attitudes about climate change in 2008, and found that people in almost all of the countries thought global warming or climate change was a seri- ous problem. Among 27 countries, respon- dents from 12 countries thought global warm- ing or climate change was the most serious problem, while respondents from 13 countries thought poverty and a lack of food and drink- ing water was the most serious problem (EU 2008). GlobeScan (2000 and 2006) surveyed levels of the public’s concerns in 34 different countries about the severity of the greenhouse effect due to global warming and climate change in 2000 and 2006, respectively. The survey results showed that the ratio of respon- dents who thought the problem of climate change was increasingly serious significantly increased. In Taiwan, a survey conduced by Vision Magazine in 2007 showed that 88.5L of respondents considered global warming to be a serious problem (Vision Magazine 2007).

In light of the above, the seriousness of global warming has received a lot of attention in most countries of the world, and therefore, determining how to reduce the impacts of global warming and slow down the crisis due to climate change has been actively explored in each country in recent years. In general, there are 2 strategies to reduce greenhouse gases: reduce the emissions of greenhouse gases and increase the absorption of green- house gases. With the absorption strategy, photosynthesis by plants and trees is used to absorb and fix CO

2

from the atmosphere.

On the other hand, deforestation is the main source of CO

2

emissions. Therefore, changes in forestlands are playing key roles in the carbon cycle of the earth. When a tree is in the growth stage, carbon dioxide is seques-

trated. When a tree is harvested, a part of the sequestered carbon returns to the atmosphere, but most of the carbon is still stored and fixed in another form, i.e., wood products. In the carbon cycle, CO

2

does not disappear, but is just temporarily stored in forests and wood products. Through planting trees and forest management (e.g., see Niu and Duiker 2006), the absorption and storage of CO

2

can be in- cremented. Forests will play a key role in in- ternational climate change negotiations at the United Nations after 2012. Now, energy sav- ings and carbon reduction are major policies of the Taiwanese government, while the Coun- cil of Agriculture (COA) in Taiwan also lists energy savings and carbon reduction as one of 10 key industrial research teams, and pro- motes planting trees by target-based projects.

In light of the above information, it is

clear that public opinion can affect political,

economic, and social actions, which can ef-

fectively reduce specific risks (Leiserowitz

2007), and for the global-warming issue, the

public’s awareness and attitudes are a major

key to solving climate change, global warm-

ing, and other environmental issues

1)

. How-

ever, differences in the public’s personal char-

acteristics and levels of their awareness about

related knowledge can lead to differences in

attitudes and behaviors toward global warm-

ing and other environmental problems. There-

fore, understanding public opinion should

help governments develop and promote ef-

fective policies; e.g., Chang et al. (2009) con-

ducted a mail survey on forest pest outbreaks

and control to help policy makers and forest

managers arrive at publicly acceptable pest-

control policies and make better-informed

decisions. The success and failure of a policy

may depend on the public’s awareness and

attitudes toward that policy. Since planting

trees is one of the feasible strategies for car-

bon reduction, it is necessary to understand

(5)

the public’s attitudes toward planting trees for carbon reduction, so as to ensure that policies are successful. For this reason, we conducted a mail survey to understand the Taiwanese public’s feelings on global warming and other environmental issues, analyzed their attitudes and awareness about global warming, and further explored their participation in planting trees for carbon reduction, to provide a refer- ence for promoting relevant policies.

MATERIAL AND METHODS

Design of the questionnaire

Our questionnaire was designed by referring to previous studies. The question- naire consisted of 4 parts. In the first part, to understand the respondents’ awareness of environmental and ecological problems, they were asked the level of their concern and levels of their awareness about the serious- ness of 13 various environmental and eco- logical problems, using a 7-point Likert scale from 1 (not at all concerned or not severe) to 7 (greatly concerned or highly severe). In the second part, levels of the respondents’

attitudes toward global warming were also measured on a 7-point scale, in which 20 questions on global warming were asked. In the third part, respondents were asked about their socioeconomic characteristics, including gender, age, educational level, marital status, occupation, personal monthly income, place of residence, and whether they had ever par- ticipated in environmental or religious groups or activities. In the fourth part, we measured the respondents’ attitudes toward planting trees as a carbon sequestration policy, includ- ing whether they were aware that the gov- ernment was promoting energy-saving and carbon-reduction programs, whether they had ever heard of a carbon-neutral or low-carbon lifestyle, and whether they had considered or

had been engaged in planting trees for carbon sequestration.

Since Heffernan (2006) indicated that the goal of testing content validity can be achieved by using expert validity, this study applied expert validity to evaluate the content validity. To ensure that the questionnaire was clear and easy to answer

2)

, it was pre-tested by 5 experts with different socioeconomic characteristics and the public, and the feasi- bility of the questionnaire was discussed

3)

.

After incomplete statements were re- vised and several questions were deleted, our formal questionnaire was finalized.

Survey methodology and sampling

This study conducted a questionnaire survey by mail and adopted a stratified sys- tematic sampling method. The sample source was based upon the Household Registration and Conscription Information link data from the Ministry of Interior in 2009. The propor- tion of the population distributed in each county in Taiwan was used to choose people aged 15 yr or older in Taiwan as our sample.

The sample size was 2000. The distribution of samples was based upon the proportion of the population in each county in Taiwan, not the proportion of each village and town.

This survey was first carried out in July 2009, and then a request was sent by mail to those who had not yet replied in September. The deadline for the questionnaire survey was the end of October 2009. In total, 333 people completed the questionnaires, resulting in an effective questionnaire return rate of 16.7 L

4)

.

Questionnaire analysis method

The questionnaire results were analyzed

using the SPSS statistical software (Chicago,

IL, USA) for data entry and analysis. First,

descriptive statistics were used to analyze

the questions and parameters, including the

(6)

level of respondents’ concerns and the level of their awareness of the seriousness of envi- ronmental and ecological problems, the mean and standard deviation of their attitudes about global-warming issues, their socioeconomic characteristics, and their attitudes toward planting trees for carbon sequestration.

Furthermore, by a factor analysis, we extracted the factor dimensions from the re- spondents’ attitudes toward global-warming problems. Before the factor analysis, the results of Bartlett’s test of sphericity and the Kaiser-Meyer-Olkim (KMO) test were used to analyze whether the selected items were suitable for the factor analysis. Since the results of Bartlett’s test of sphericity were significant and KMO values were > 0.8, our survey was suitable for a factor analysis. Af- ter identifying suitable items, principal com- ponent factors were used to select common factors that were > 1, and then Varimax was used to extract common factors among the or- thogonal axis factors with a factor loading of

> 0.4 as the selection criteria items. We also conducted a reliability analysis on the factor dimensions of the items, and used Cronbach’s α coefficient to test the level of internal con- sistency of the factor dimensions of the items.

An analysis of variance (ANOVA) was used to determine whether respondents with differ- ent socioeconomic characteristics had signifi- cant differences in the levels of their concern about the seriousness of global-warming problems, and extracted factor dimensions of their attitudes about global-warming issues, and whether respondents’ willingness to par- ticipate in planting trees for carbon sequestra- tion showed significant differences from the extracted dimensions of their attitudes toward global-warming issues. If the results indicated significant differences, then Duncan’s multi- ple-range test was used to further explain the differences.

RESULTS AND DISCUSSION

Socioeconomic characteristics of respon- dents

The socioeconomic characteristics of re- spondents are shown in Table 1, in which the proportions of male and female respondents were similar (48.5 L and 51.5L of all respon- dents); the highest proportion was of the age 26~35 yr (which accounted for 27.6 L of all respondents), followed by 36~45 yr at 21.3L and those aged > 55 yr at 20.2 L. Respon- dents who were married, unmarried, and had divorced accounted for 66.1, 29.9, and 4.0 L, respectively. Respondents who had gradu- ated from university (college) accounted for 55.3L, followed by these with a senior high school education at 20.4 L of all respondents.

As to the respondents’ occupations, those engaged in commercial activities occupied a maximum of 22.6 L, followed by the military and civil servants/teachers, at about 15.0L each. As to the personal monthly income of respondents, the answer “no income” oc- cupied the highest percentage, accounting for 23.6L, the possible reason for which was that they were students or housekeepers, followed by those with NT$20,000~30,000/

mo, which accounted for 20.0 L. From the cumulative percentage, more than one-half of respondents had personal monthly income of

≤ NT$30,000. Those with a personal monthly income of NT$80,000 accounted for 5.6 L (at the time of the survey, the exchange rate was US$1.00 ≈ NT$30.13). A large proportion had never participated in any environmental or re- ligious groups (82.7 L), while only 17.3L of respondents answered that they had

5)

.

Respondents’ awareness of environmen- tal and ecological problems

Among 13 environmental and ecological

problems, global warming, water pollution,

(7)

Table 1. Socioeconomic characteristic of respondents

Item Percentage ( L)

Gender

Male 48.5 Female 51.5 Age (yr)

15~25 12.6

26~35 27.6

36~45 21.3 46~55 18.3

> 55 20.2

Marital status

Unmarried 29.9 Married 66.1 Divorced 4.0 Educational level

Less than senior high school 9.9

Senior high school 20.4

University (college) 55.3

Graduate school and above 14.4

Occupation

Military, civil servant, or teacher 15.0

Businessperson 22.6 Laborer 13.1 Student 6.4 Self-employed 7.3 Housekeeper 11.3 Retired 8.6 Unemployed 4.9 Other 10.7 Personal monthly income (NT$)*

None 23.6

< 20,000 9.4

20,000~30,000 20.0 30,000~40,000 14.2 40,000~50,000 10.9 50,000~60,000 8.5 60,000~70,000 4.2 70,000~80,000 3.6

> 80,000 5.6

Place of residence

Northern 48.2

Central 23.2

Southern 21.7

Eastern 6.9

(8)

air pollution, climate anomalies, and inappro- priate human development were the environ- mental and ecological problems of greatest concern, with respective means of 6.20, 6.09, 6.07, 6.02, and 5.88. Also, the above 5 prob- lems were more serious problems, but the rank slightly differed, with global warming still the most serious problem (with a mean of 6.31), followed by inappropriate human de- velopment (6.09), air pollution (6.08), water pollution (6.07), and climate anomalies (6.06), which showed that the awareness of the se- riousness of these 4 environmental and eco- logical problems exhibited small differences (Table 2). Comparing the ranks of the level of the respondents’ concerns and their level of awareness about the seriousness of environ- mental and ecological problems, inappropri- ate human development issues ranked fifth of 13, but the awareness level ranked second of 13. From the higher levels of respon- dents’ concerns and awareness about global warming, it is evident that respondents were aware of the seriousness of global warming to some extent. As for other environmental and ecological problems, the respondents had lower levels of concerns and awareness of the seriousness of overpopulation and invasive species. Climate change and global warming are better known due to increasing scientific evidence on global warming and its confirma- tion, deeper impacts due to actual changes in the surrounding environment, media reporting and propagation, the public’s attention and popularity of knowledge of climate change and global warming, international conferenc- es related to climate change and global warm-

ing, and the promotion of strategies (such as the United Nations Framework Convention on Climate Change and the Kyoto Protocol).

Therefore, environmental problems due to global warming have also received increas- ing attention. The public is likely to gradually become more aware to the seriousness of the global-warming problem.

Test of the difference between respon- dents’ socioeconomic characteristics and levels of their concern and awareness of the seriousness of global warming

An ANOVA was used to test for differ- ences between respondents’ socioeconomic characteristics and levels of concern and awareness of the seriousness of global warm- ing; if a significant difference existeds then Duncan’s multiple-range test was used to explain the difference. The results are shown in Table 3. Respondents had significant dif- ferences between the level of their concern about global warming and their age as well as education, while other socioeconomic char- acteristics showed no significant differences.

The respondents with a higher education were significantly more concerned about global warming than those with lower education. As to the realization of the seriousness, there was a significant difference between education and occupation, while other socioeconomic characteristics showed no significant differ- ences. Respondents with a senior high school education had significantly higher awareness of the seriousness of global warming than those with less than a senior high school education and more than a graduate school con’t

Involved in any environmental or religious groups?

No 82.7 Yes 17.3

* At this time of the survey (2011), the exchange rate was US$1.00 ɻ NT$30.

(9)

education. Respondents who were students and had no job had lower significant differ- ences in their awareness of the seriousness of global warming than those in the other

categories. In a previous study, Whitmarsh (2005) showed that male, highly educated (university), and middle-aged respondents’

levels of awareness and understanding of Table 2. Respondents’ awareness of environmental and ecological problems

Environmental and ecological problem Level of concern Level of awareness Mean Standard deviation Mean Standard deviation

Global warming 6.20 1.07 6.31 1.05

Water pollution 6.09 1.17 6.07 1.17

Air pollution 6.07 1.13 6.08 1.04

Climate anomalies 6.02 1.18 6.06 1.18

Inappropriate human development 5.88 1.31 6.09 1.20

Ozone hole 5.83 1.33 5.98 1.22

Excessive use of the earth’s resources 5.80 1.27 5.96 1.22

Garbage and waste disposal 5.77 1.30 5.51 1.42

Floods, landslides 5.67 1.40 5.83 1.39

Land subsidence 5.22 1.60 5.32 1.51

Loss of biodiversity 5.15 1.54 5.40 1.40

Invasive species 4.81 1.74 4.85 1.70

Overpopulation 4.55 1.76 4.53 1.69

Table 3. Different socioeconomic characteristics and awareness levels about global warming Socioeconomic characteristic Level Level

Duncan’s multiple-range test of concern of severity

Gender 0.11 0.15

Age 2.71

*

0.9 46~55 > 25 yr of age

Marital status 1.37 0.72

Educational level 3.07* 3.72* Senior high school, university (college), graduate school and above > less than senior high school and beyond graduate school

Occupation 1.86 2.46* Military, civil servants, teachers,

business, engineers,

self-employment, housekeepers,

retired > students, Unemployed Personal monthly income 0.27 0.62

Place of residence 0.27 1.82

Involvement in any environmental 0.21 0.01 or religious groups

* p < 0.05; each entry value in the table is the F-value. This table is the result of averaging the “level

of concern” and the “level of severity” and conducting an ANOVA and post-hoc test on different

socioeconomic characteristics.

(10)

climate change were higher. Other studies found that females paid greater attention to the impacts of climate change, believed more than males that climate change was mainly caused by human activities, and worried more than males about climate change (DEFRA 2002, O’Connor et al. 2002, Bibbings 2004).

More people aged 45~64 yr (78L) had heard about climate change than those 18~25 yr old (63L) (Whitmarsh 2005). Those of 25 yr and over 65 yr of age had less understanding of the causes of the impacts of climate change (DEFRA 2002, Hargreaves et al. 2003, Bib- bings 2004). Other studies showed that in general, females were more concerned about environmental issues and their risks than males (Baldassare and Katz 1992, Wither- spoon and Martin 1992, Stern et al. 1993, Hampel et al. 1996, Pidgeon and Beattie 1998, Barnett and Breakwell 2001). Some studies showed that young people were less concerned about climate change and other environmental issues than elderly people (Witherspoon and Martin 1992, Christie and Jarvis 2001, DEFRA 2002, Bibbings 2004).

People with certain personal socioeconomic characteristics, such as educational level, age, gender, occupation, and ethnicity, differed in their understanding of climate change issues (Aoyagi-Usui et al. 2003, Ester et al. 2003, Aoyagi-Usui 2008).

Respondents’ attitudes toward global warming

Among the 20 items asked about at- titudes towards global warming, the 4 items of “reducing greenhouse gas emissions is what everyone must to do” (mean, 6.44),

“human behavior is the major source caus- ing global warming and climate anomalies”

(mean, 6.26), “climate anomalies caused by the greenhouse effect and global warming are getting worse” (mean, 6.20), and “I am will-

ing to change some habits to improve the en- vironmental degradation trends” (mean, 6.12) had the highest levels of awareness. In con- trast, the following 6 items had lower levels of awareness “reducing greenhouse gas emis- sions is not my business” (mean, 1.80), “the reduction of greenhouse gas emissions should be done by other countries” (mean, 2.09), “the seriousness of global warming does not af- fect me” (mean, 2.46), “the global-warming problem is not really as serious as reported by the media” (mean, 2.69), “there is not enough scientific evidence to prove that global warm- ing is really happening” (mean, 2.81), and

“climate anomalies and global warming are environmental problems that cannot be modi- fied by humans” (mean, 3.11) (Table 4). Such results show that in recent years, the media’s propagation of a large amount of information related to climate anomalies and global warm- ing has made respondents concerned about these issues. Respondents have received the message to some extent, and were person- ally willing to make adjustments, rather than viewing those issues as something not related to themselves.

Using an item analysis and reliability estimates for all 20 items on respondents’

attitudes toward global warming, correlations

of items 15, 13, 9, 8, 7, and 4 were < 0.30,

and hence those items were deleted. After de-

letion, the total Cronbach’s α value increased

from 0.83 to 0.92. We conducted a factor

analysis on the remaining 14 items, and used

a principle component analysis to extract

common factors, which were determined ac-

cording to eigenvalues of > 1, and were trans-

formed using orthogonal varimax rotation, in

order to increase the factors’ explanatory abil-

ity. The analyzed results are shown in Table

5, which shows that by the factor analysis, 2

common factors were extracted, and the total

variance explained was 62.05 L.

(11)

Table 4. Reliability of respondents’ attitudes towards of global warming

Global-warming issue Mean Standard Correlation Deleted deviation coefficient value of α 14. Everyone must reduce greenhouse gas emissions. 6.44 1.19 0.38 0.83 3. Human behavior is the major cause of 6.26 1.08 0.44 0.83 global warming and climate anomalies. 6.20 1.09 0.52 0.82 2. Global-warming and climate anomalies

caused by the greenhouse effect are becoming more serious.

19. I would like to change some habits in 6.12 1.14 0.56 0.82 order to reduce environmental degradation.

18. I am willing to do my best to reduce 6.00 1.25 0.59 0.82 greenhouse gas emissions.

10. In order to reduce greenhouse gases, 5.97 1.40 0.46 0.82 energy consumption should be reduced.

12. I am very worried about the impacts 5.89 1.35 0.61 0.82 of global warming.

1. The emission of a large amount of 5.87 1.19 0.52 0.82 greenhouse gases is the main cause of

climate anomalies.

16. I think that the government should pass 5.77 1.54 0.53 0.82 legislation to regulate greenhouse gas

emissions as soon as possible.

11. Recent climate anomalies were likely 5.73 1.38 0.53 0.82 caused by global warming.

20. I am willing to spend more money 5.63 1.59 0.59 0.82 buying products beneficial to the environment.

5. I will pay attention to messages about 5.50 1.35 0.57 0.82 global warming.

6. Global warming has affected my daily life. 5.40 1.45 0.52 0.82 17. I can accept an income reduction due to 4.88 1.78 0.51 0.82

a reduction in greenhouse gas emissions.

4. Climate anomalies and global warming are 3.11 1.98 0.13 0.84 environmental problems that cannot

be modified by humans.

7. There is not enough scientific evidence 2.81 1.78 0.24 0.84 to prove that global warming is

really occurring.

8. Global-warming problems are not really 2.69 1.69 0.21 0.84 as serious as reported by the media.

9. The seriousness of global warming 2.46 1.91 0.25 0.84 does not affect me.

13. The reduction in greenhouse gas emissions 2.09 1.76 0.27 0.83

should be done by other countries.

(12)

Factor 1 contained 7 items (5, 14, 16, 17, 18, 19, and 20), which explained 31.70L of the total variance, and Cronbach’s α value of the internal consistency was 0.88. This group of items covered people’s attitudes to global warming, including “I will pay attention to

messages about global warming,” “I am will- ing to do my best to reduce greenhouse gas emissions,” “everyone must work to reduce greenhouse gas emissions,” “I would like to change some habits in order to improve en- vironmental degradation,” “I am willing to con’t

15. Reducing greenhouse gas emissions 1.80 1.60 0.26 0.83 is not my business.

The α value indicates the value of Cronbach’s α coefficient of reliability and is taken as the standard test, in which α < 0.30 is not trusted; 0.30 < α < 0.40 is for the initial study, with strained credibility; 0.4

< α < 0.05 has a little confidence; 0.50 < α < 0.70 is credible (the most common reliability range); 0.70

< α < 0.90 is very credible (second most common reliability range); 0.90 < α is very credible.

Table 5. Factor analysis of respondents’ attitudes on attitudes towards global warming

Item Factor Variance Value

loading (L) of α

Dimension of factor one: actions to improve global warming

19. I would like to change some habits in order to improve 0.84 31.70 0.88 environmental degradation.

18. I am willing to do my best to reduce greenhouse gas emissions. 0.82 20. I am willing to spend more money buying products beneficial 0.80

to the environment.

17. I can accept an income reduction due to a reduction 0.65 in greenhouse gas emissions.

16. I think that the government should pass legislation 0.67 to regulate greenhouse gas emissions as soon as possible.

14. Everyone must reduce greenhouse gas emissions. 0.66 5. I will pay attention to messages about global warming. 0.56 Dimension of factor 2: awareness and concern about global warming

2. Global warming and climate anomalies caused 0.89 30.35 0.88 by the greenhouse effect are becoming more serious.

1. The emission of a large amount of greenhouse gases 0.86 is the main cause of climate anomalies.

3. Human behavior is the major cause of global warming 0.74 and climate anomalies.

11. Recent climate anomalies were likely caused by global warming. 0.68 12. I am very worried about the impacts of global warming. 0.66 6. Global warming has affected my daily life. 0.56 10. In order to reduce greenhouse gases, energy consumption 0.50

should be reduced.

KMO = 0.919; Bartlett’s test of x

2

= 2863.663***; 62.05 L of total variance; the overall value of α =

0.92.

(13)

spend more money buying products beneficial to the environment,” “I can accept an income reduction due to a reduction in greenhouse gas emissions,” and “I think that the gov- ernment should enact legislation regulating greenhouse gas emissions as soon as possi- ble,” so they were labeled “actions to improve global warming.” Factor 2 contained items 1, 2, 3, 6, 10, 11, and 12, which explained 30.35L of the total variance, and Cronbach’s α value of factor internal consistency was 0.88. The items in this factor were correlated with the respondents’ knowledge and feelings about global warming, such as their feelings about the seriousness of global warming and climate anomalies caused by the greenhouse effect, major sources of and reasons for global warming and climate anomalies, and feeling the effects of global warming, so they were labeled “awareness and concern about global warming.”

Testing differences between respondents’

socioeconomic characteristics and fac- tors related to global-warming issues

An ANOVA was used to test differences in respondents’ socioeconomic characteris- tics and factors on global-warming issues;

if a significant difference was found, then Duncan’s multiple-range test was used to explain the difference. The analyzed results are shown in Table 6, which are summarized as follows. The respondents’ different socio- economic characteristics had no significant effects on the “awareness and concerns about global warming”, but education and occupa- tion had significant effects on the “actions to improve global warming”. Then, according to Duncan’s multiple-range test, the ratio of respondents with more than a senior high school education were significantly higher than those self-educated or with less than a senior high school education in the “actions

to improve global warming” dimension. The ratio of respondents with occupations of mili- tary, civil servants, teachers, businesspeople, self-employed, and retired were significantly higher than students; in addition, the ratio of retired respondents was also significantly higher than housekeepers.

Awareness of the “planting trees for car- bon sequestration” policy

As shown in Table 7, respondents who knew about the government’s promotion of

“energy saving and carbon sequestration”

accounted for 88.3L, while about 11.7L of respondents did not know. The proportions of respondents who had heard about a “carbon- neutral” or “low-carbon” lifestyle and those who had not were very similar, each of which accounted for 50.3 and 49.7L, respectively.

Planting trees is not only one of the feasible strategies for “energy saving and carbon se- questration”, but is also one of the ways to achieve personal or business carbon neutral- ity. Carbon offsets, mainly in terms of plant- ing trees, are one of the ways to respond to climate change. For the concept of carbon neutrality, participants thought that tour- ists also had the responsibility to use carbon offsetting, in creating and protecting natural carbon sinks (generally referring to forests) to absorb CO

2

(Becken 2004). Therefore, some carbon-offset programs encourage consumers to provide funds for planting trees or forest management to achieve individual carbon emission reductions (Carswell et al. 2003).

In addition to the benefits of carbon seques-

tration from planting tree, there are other

co-benefits, such as enhancing biodiversity

(Becken 2004, Egerton et al. 2007). Accord-

ing to a survey conducted by the Japanese

Fuji Research Graduate School, about 82 L

of respondents thought that carbon seques-

tration (mainly in terms of planting trees)

(14)

could slow down global warming. From a survey conducted by the Massachusetts In- stitute of Technology (USA), only 23L of respondents thought that carbon sequestration could slow global warming, but up to 73L of people were uncertain about the reduc- tion. The difference between the 2 surveys possibly resulted from differences in country conditions, the country’s greenhouse gas- reduction policies, cultural differences, and retrieval of information on carbon sequestra- tion. Results of the investigations between the 2 countries showed great differences (Curry 2004). Therefore, we know that citizens of different countries have different awareness levels about whether planting trees can slow down global warming. Curry et al. (2004) analyzed individuals’ opinions on feasible strategies for slowing down global warming, for which about 66L of respondents thought

that carbon sequestration could reduce CO

2

. Curry (2004) conducted another survey and found that 67L of respondents thought that carbon sequestration (planting trees) might reduce CO

2

, but that was still less than the proportions of respondents who thought that

“using solar energy” (82 L), “improving energy efficiency” (81L), “using energy- efficient vehicles” (81 L), and using “wind power” (76L) could reduce CO

2

. Curry et al.

(2005) investigated the UK public, and 76 L of respondents believed that planting trees can reduce the proportion of CO

2

. In a survey conducted by Leiserowitz (2003), about 49L of American respondents would plant trees in response to global warming. Reiner et al.

(2006) surveyed the ratios of the possibil- ity of using carbon sequestration (planting trees) for carbon reduction in the UK, Japan, the US, and Sweden, in which nearly 90L of Table 6. Effects of socioeconomic characteristics on attitudes toward global warming

Socioeconomic Actions to Awareness and

Duncan’s characteristic/dimension improve global concerns about

multiple-range test

warming global warming

Gender 0.388 1.727

Age 2.069 0.583

Marital status 0.304 1.588

Educational level 2.721* 1.544 Less than senior high school <

senior high school, university, and graduate school and above Occupation 2.409* 1.902 Military, civil servants,

teachers, business,

self-employed, and others >

students

Retired > students, housekeepers

Personal monthly income 1.771 1.527

Place of residence 0.882 0.238

Participation in organizations 0.674 0.257

* p < 0.05; each entry value in the table is the F-value. This table is the result of averaging the “level

of concern” and the “level of severity” and conducting an ANOVA and post-hoc test on different

socioeconomic characteristics.

(15)

Japanese respondents’ answers were positive.

In this study, 81.4L of respondents were considering or had been engaged in tree- planting activities to achieve the objective of reducing carbon, in which among the 5 sug- gested tree-planting programs, planting trees in their own garden or balcony accounted for the highest percentage (79.0L), while paying or donating money to support the govern- ment and relevant organizations in their tree- planting activities accounted for the lowest percentage (only 20.0L). If domestic non- governmental environmental organizations, universities, or government departments take money donated by individuals or businesses to carry out “planting tree for carbon se- questration” activities and take care of those planted trees for 20 yr, then the ratio of the

respondents who were willing to participate in such a program increased to 73.11L.

The analyzed results in Table 8 are sum- marized as follows. Respondents who did and those who did not know that the government was promoting “energy saving and carbon sequestration” actions had significant differ- ences in the “actions to improve global warm- ing” dimension, in which the ratio of those who knew about the actions was significantly higher than those who did not know about the actions. Respondents who had and those who had not heard about a “carbon-neutral”

or “low-carbon” lifestyle also had significant differences in the 2 dimensions of “actions to improve global warming” and “aware- ness and concerns about global warming”, in which the ratio of those who had heard of the Table 7. Respondents’ awareness of the issue of planting tree

Item Percentage ( L)

Aware that the government is promoting “energy saving, carbon sequestration” actions?

Know 88.3

Do not know 11.7

Had heard of a “carbon-neutral” or “low-carbon” lifestyle?

Heard 50.3

Never heard 49.7

Had considered or was already engaged in planting trees to achieve carbon sequestration?

No 18.6

Yes 81.4

Types of participation in “planting trees for carbon sequestration”

Planting trees on their own land 37.3

Participating in planting trees activities by the government and 35.1 relevant organizations

Providing land to the government to plant trees 33.2

Donating money to participate in the tree-planting activities of the government 20.0 and relevant organizations

Planting trees in their own garden or balcony 79.0

Taking care of planted trees

Not willing 26.8

Willing 73.0

(16)

2 terms were significantly higher than those who had not. Respondents who were consid- ering or had already been engaged in planting trees to reduce carbon emissions were signifi- cantly higher than those with no actions in the 2 dimensions of “actions to improve global warming” and “awareness and concerns about global warming”. Therefore, to promote poli- cies, it is important that the public understand the policy contents, which will increase their willingness to participate in the program.

In other studies, Macnaghten and Jacobs (1997) and Weaver (2002) found that if the public understands environmental issues to a greater extent, it would be easier for them to take appropriate actions. Sampei and Aoyagi- Usui (2009) analyzed Japan’s newspaper re- ports and public opinion about global warm- ing from 1998 to 2007, and suggested that increasing the public’s understanding would help communication about mitigating global warming.

CONCLUSIONS

The public’s attitudes are key factors in mitigating climate change, global warming, and other environmental issues. Different personal socioeconomic characteristics and

awareness of related knowledge also cause differences in attitudes and behaviors toward global warming and other environmental problems. Since “planting trees for carbon se- questration” is one of the feasible mitigation strategies for global warming, it is necessary to understand the public’s attitudes, so as to frequently promote tree-planting programs.

Therefore, in this study, we conducted a mail survey to analyze the public’s attitudes and awareness of global warming, and further explored their participation in “planting trees for carbon sequestration” in Taiwan. A review of the literature showed that with more sci- entific evidence of climate change and global warming, the deepening impacts caused by real change in surrounding environments, media coverage and propagation, the popular- ity of information related to climate change and global warming, international confer- ences on climate change and global warming, and promotion of adopting strategies have focused increasing attention on the issue of global warming. In this survey on 13 listed environmental and ecological problems, the respondents were most concerned about global warming and also thought that global warming was the most serious environmental and ecological problem.

Table 8. Effects of “planting trees for carbon sequestration” on the “global-warming issues”

dimensions

Actions to Awareness and Socioeconomic characteristics/dimension improve global concerns about

warming global warming

Do you know that the government is promoting “energy saving 4.028* 2.045 for carbon sequestration” actions?

Have you heard about a “carbon-neutral” or “low-carbon” 19.577*** 9.267**

lifestyle?

Are you considering or already engaged in tree-planting 8.572** 6.02*

activities to achieve the purpose of reducing carbon?

This table applied an independent-sample t-test to investigate the variance test of 3 variables on 2 di-

mensions (i.e., actions to improve global warming, and awareness and concerns about global warming).

(17)

By the ANOVA, we found that signifi- cant differences existed between the respon- dents’ level of concerns and their age and edu- cation, but there was no significant difference in other socioeconomic characteristics. Re- spondents 46~55 yr old were more concerned than those older than 25 yr. Respondents with a senior high school education were more significantly concerned about global warm- ing than those with less than a senior high school education and those with more than a graduate school education. By using a factor analysis, 2 dimensions of “actions to improve global warming” and “awareness and con- cerns about global warming” were extracted, which explained 62.05 L of the total variance.

According to the ANOVA, there were no significant differences in the different socio- economic characteristics in the “awareness and concerns about global warming” dimen- sion, but there were significant differences in education and occupation in the “actions to improve global warming” dimension. By Duncan’s multiple-range test, we found that the ratio of the respondents with more than a senior high school education was signifi- cantly higher than that with a primary school education or self-educated for the “actions to improve global warming” dimension. The ratio of respondents who were in the military, civil servants, teachers, businesspeople, self- employed, other, and retired were significant- ly higher than students; the ratio of retired respondents was also significantly higher than housekeepers.

Respondents who were considering or had been engaged in planting trees to achieve the purpose of reducing carbon accounted for 81.4 L. For 5 suggested tree-planting programs, planting trees in their own garden or balcony accounted for the highest propor- tion (79.0L). For “planting trees for carbon sequestration”, 73.11 L of respondents were

willing to participate. The ratio of the respon- dents who were considering or had already been engaged in planting trees in the 2 dimen- sions of “actions to improve global warming”

and “awareness and concerns about global warming” were significantly higher than those with no actions. Therefore, to promote policies, it is important that the public under- stands the policy contents, and the public’s willingness to participate in planting trees activities for carbon sequestration will also increase.

The results of this study are subject to

the following limitations. Our questionnaires

were issued by post. After urging respondents

to reply to our questionnaires, the final over-

all response rate was only 16.7L. We found

that highly educated respondents accounted

for the the greatest proportion of the received

questionnaires, so the samples received might

not represent the general Taiwanese public,

and may lead to a random sampling error (i.e.,

the difference between sample statistics and

population parameters results from probabil-

ity when selecting samples). Lue and Chen

(1995) indicated that the overall response rate

by post usually falls between 10 and 40L. In

addition, Lee (1994) studied the influence of

rewarding incentives on a farmers’ question-

naire response rate by post, in which the over-

all response rates in different situations were

4.80, 6.98, 10.84, and 10.25 L. A low overall

response rate by post is unavoidable. As a

result, in subsequent research, it is suggested

that researchers should provide more incen-

tives when issuing questionnaires (Cycyota

and Harrison 2006). For example, we could

apply the following schemes to increase the

overall response rate: provide gift incentives

(Church 1993, Hopkins and Gullickson 1993,

Yammarino et al. 1991), improve the ques-

tionnaire design (Nowack 1990, Roszkowksi

and Bean 1990, Yammarino et al. 1991),

(18)

focus on issuing questionnaires to respon- dents that can send mail conveniently, and increase the times of reminding respondents (Roth and BeVie 1998, Cycyota and Harrison 2006).

LITERATURE CITED

Aoyagi-Usui M. 2008. An analysis of the ef- fective factors for promoting proenvironmental actions from the information gain and social capital point of view. Rev Environ Econo Policy Stud 1(2):37-50. [in Japanese].

Aoyagi-Usui M, Vinken H, Kuribayashi A.

2003. Pro-environmental attitudes and behav- iors: an international comparison. Hum Ecol Rev 10(1):23-31.

Baldassare M, Katz C. 1992. The personal threat of environmental problems as predictor of environmental practices. Environ Behav 24(5):602-16.

Barnett J, Breakwell GM. 2001. Risk per- ception and experience: hazard personality profiles and individual differences. Risk Anal 21(1):171-7.

Baron RA, Greenberg J. 1990. Behavior in organizations. 3rd edition. Boston, MA: Allyn

& Bacon. 25 p.

Becken S. 2004. How tourists and tourism experts perceive climate change and carbon- offsetting schemes. J Sustain Tour 12(4):332-45.

Bibbings J. 2004. Climate concern: attitudes to climate change and windfarms in Wales.

Cardiff, UK: Friends of the Earth Cymru and The Welsh Consumer Council. 52 p.

Bord RJ, O’Connor RE, Fisher A. 2000. In what sense does the public need to understand global climate change? Public Underst Sci 9:205-18.

Bostrom A, Morgan MG, Fischhoff B, Read D. 1994. What do people know about global climate change? 1. Mental models. Risk Anal 14(6):959-70.

Carswell F, Frame B, Martin V, Turney J.

2003. Exchanging emissions for biodiversity – in pursuit of an integrated solution in New Zealand. Ecol Manage and Restor 4:85-93.

CCGA. 2007. Climate change and the global environment. Chicago, IL: Chicago Council on Global Affairs (CCGA). 3 p.

Chang WY, Lantz VA, MacLean DA. 2009.

Public attitudes about forest pest outbreaks and control: case studies in two Canadian prov- inces. For Ecol Manage 257:1333-43.

Chiou H. 2011. Quantitative research methods III: Principles and techniques of testing and scale development. Taipei, Taiwan: Yeh Yeh Book Gallery. 152 p.

Christie I, Jarvis L. 2001. How green are our values? In: Park A, Curtice J, Thomson K, Jarvis L, Bromley C, editors. British social at- titudes: the 18th report. London: Sage Publica- tions. p 113-52.

Church AH. 1993. Estimating the effect of in- centives on mail survey response rates: a meta- analysis. Public Opin Q 57:62-79.

Curry TE. 2004. Public awareness of carbon capture and storage: a survey of attitudes to- ward climate change mitigation [master’s the- sis]. Cambridge, MA: Massachusetts Institute of Technology. Available at http://dspace.mit.

edu/bitstream/handle/1721.1/17908/56726887.

pdf?sequence=1. Accessed 14 July 2004.

Curry TE, Reiner DM, Ansolabehere S, Herzog HJ. 2004. How aware is the public of carbon capture and storage? In: Seventh International Conference on Greenhouse Gas Control Technologies, Vancouver, Canada. 10 p.

Curry TE, Reiner DM, de Figueiredo MA, Herzog HJ. 2005. A survey of public attitudes towards energy and environment in Great Britain. Cambridge, MA: MIT Laboratory for Energy and the Environment, Massachusetts Institute of Technology. Publication no. LFEE 2005-001 WP. 32 p.

Cycyota CS, Harrison DA. 2006. What

(19)

(not) to expect when surveying executives: a meta-analysis of top manager response rates and techniques over time. Organ Res Meth 9(2):133-60.

DEFRA. 2002. Survey of public attitudes to quality of life and to the environment: 2001.

London: Department for Environment, Food and Rural Affairs (DEFRA). Available at http://www.defra.gov.uk/statistics/files/pas- survey2001.pdf. Accessed 1 October 2002.

Dunlap RE. 1994. International attitudes to- wards environment and development. Green globe yearbook. Oxford, UK: Oxford Univ.

Press. p 115-26.

Dunlap RE, Scarce R. 1991. The polls—poll trends: environment problems and protection.

Public Opin Q 55:651-72.

Egerton C, Gaskell C, MacKerron G, Par- pia A. 2007. Valuing consumer preference for carbon offsetting. Available at http://www.

inference.phy.cam.ac.uk/sustainable/refs/car- bonoffsetsurveyreport.pdf. Accessed 16 March 2011.

Ester P, Vinken H, Simoes S, Aoyagi-Usui M, editors. 2003. Culture and sustainability:

a cross-national study of cultural diversity and environmental priorities among mass publics and decision makers. Amsterdam: Dutch Univ.

Press. 303 p.

EU. 2008. Europeans’ attitudes towards cli- mate change. Bruxelles, Belgique: European Union (EU). Available at http://ec.europa.eu/

public_opinion/archives/ebs/ebs_300_full_

en.pdf. Accessed 1 May 2011.

GlobeScan. 2000. Environics international en- vironmental monitor survey dataset. Toronto, Canada: GlobeScan. 20 p.

GlobeScan. 2006. 30-country poll finds world- wide consensus that climate change is a serious problem. Toronto, Canada: GlobeScan. 9 p.

Hampel B, Boldero J, Holdsworth R. 1996.

Gender patterns in environmental conscious- ness among adolescents. Aust NZ J Sociol

32(1):58-71.

Hargreaves I, Lewis J, Speers T. 2003. To- wards a better map: science, the public and the media. London: UK Economic and Social Research Council. 58 p.

Heffernan L. 2006. Gauging the reliability of scientific evidence in tort. Judicial Stud Inst J 6(1):140-70.

Hinds K, Carmichael C, Snowling H. 2002.

Public attitudes to the environment in Scotland 2002. Edinburgh, UK: Scottish Executive. 11 p.

Hopkins KD, Gullickson AR. 1993. Response rates in survey research: a meta-analysis of the effects of monetary gratuities. J Exp Educ 61:52-62.

IPCC. 2007. IPCC Fourth assessment report:

climate change 2007 (AR4). The AR4 synthe- sis report. New York: Intergovermental Panel on Climate Change (IPCC). Available at http://

www.ipcc.ch/publications_and_data/ar4/syr/

en/contents.html. Accessed 1 September 2011.

Kempton W, Boster JS, Hartley JA. 1995.

Environmental values in American culture.

Cambridge, MA: MIT Press. 336 p.

Lee SD. 1994. Effects of the reward incentives with mailed questionnaires to farmers’ return- ing ratio. Res Bull Kaohsiung Dist Agric Res Extens Station 5(2):44-55.

Leiserowitz A. 2003. Global warming in the American mind: the roles of affect, imagery, and worldviews in risk perception, policy pref- erences and behavior. Unpublished disserta- tion. Eugene, OR: Univ. of Oregon. 210 p.

Leiserowitz A. 2004. Before and after the day after tomorrow: a U.S. study of climate change risk perception. Environment 46(9):22-37.

Leiserowitz A. 2007. International public opinion, perception, and understanding of global climate change. Human Development Report 2007/2008 Fighting climate change: hu- man solidarity in a divided world. New York:

Human Development Report Office. 39 p.

Lue CC, Chen CC. 1995. Mail survey and

(20)

its follow-ups: Is there any response bias from reluctant respondents? J Outdoor Recrea Study 8(4):1-18.

Macnaghten P, Jacobs M. 1997. Public identification with sustainable development:

Investigating cultural barriers to participation.

Global Environ Changes 7(1):5-24.

Niu X, Duiker SW. 2006. Carbon sequestra- tion potential by afforestation of marginal ag- ricultural land in the midwestern U.S. For Ecol Manage 223:415-27.

Norton A, Leaman J. 2004. The day after tomorrow: public opinion on climate change.

London: MORI Social Research Graduate School and Above. 9 p.

Nowack KM. 1990. Getting them out and get- ting them back. Train Dev J 44:82-5.

O’Connor RE, Bord RJ, Yarnal B, Wiefek N. 2002. Who wants to reduce greenhouse gas emissions? Soc Sci Q 83:1-17.

OST, MORI. 2004. Science in society—find- ings from qualitative and quantitative research.

Conducted for the Office of Science and Tech- nology, Department of Trade and Industry.

London: MORI Social Research Graduate School and Above. 185 p.

Pidgeon NF, Beattie J. 1998. The psychology of risk and uncertainty. In: Calow P, editor.

Handbook of environmental risk assessment and management. Oxford, UK: Blackwell Sci- ence. p 289-318.

Poortinga W, Pidgeon N. 2003. Public per- ceptions of risk, science and governance: main findings of a British survey of five risk cases.

Norwich, UK: Univ. of East Anglia and MORI.

127 p.

Reiner D, Curry T, de Figueiredo M, Her- zog H, Ansolabehere S, Itaoka K, et al. 2006.

An international comparison of public attitudes towards carbon capture and storage tech- nologies. In: 8th International Conference on Greenhouse Gas Control Technologies, Trond- heim, Norway, June, 2006. Available at http://

sequestration.mit.edu/pdf/GHGT8_Reiner.pdf.

Accessed 19 June 2006.

Roszkowksi MJ, Bean AG. 1990. Believe it or not! Longer questionnaires have lower re- sponse rates. J Bus Psychol 4:495-508.

Roth LP, BeVier A. 1998. Response rates in HRM/OB survey research: norms and corre- lates, 1990-1994. J Manage 24:97-117.

Sampei Y, Aoyagi-Usui M. 2009. Mass-media coverage, its influence on public awareness of climate-change issues, and implications for Japan’s national campaign to reduce green- house gas emissions. Global Environ Changes 19(2):203-12.

Stern P, Dietz T, Kalof L. 1993. Value orien- tations, gender, and environmental concern.

Environ Behav 25(3):322-48.

Swedish Environmental Protection Agency.

2008. The general public and climate change 2008 report 5905. November 2008. Stockholm, Sweden: Swedish Environmental Protection Agency. 26 p.

The Polling Report. 2004. Environment. The Polling Report, April, 2004. Available at http://

www.pollingreport.com/enviro.htm. Accessed 25 September 2011.

Thompson M, Rayner S. 1998. Cultural discourses. In: Rayner S, Malone EL, editors.

Human choice and climate change, Vol. 1: The societal framework. Columbus, OH: Battelle Press. p 265-344.

Vision Magazine. 2007. Carbon into gold. Vi- sion Magazine. 255 p. [in Chinese].

Weaver A. 2002. Determinants of environ- mental attitudes. Int J Sociol 32:77-108.

Whitmarsh LE. 2005. A study of public un- derstanding of and response to climate change in the south of England [PhD thesis]. Bath, UK: Department of Psychology, Univ. of Bath.

427 p.

Witherspoon S, Martin J. 1992. What do we

mean by green? In: Jowell R, Brook L, Prior G,

Taylor B, editors. British social attitudes: the

(21)

9th Report, Social and community planning re- search. Hants, UK: Ashgate Publishing. p 1-26.

Yammarino FJ, Skinner SJ, Childers TL.

1991. Understanding mail survey response be- havior. Public Opin Q 55:613-9.

Zimbardo PG, Leippe MR. 1991. The psy- chology of attitude change and social influ- ence. New York: McGraw-Hill. 437 p.

FOOTNOTES

1) Baron and Greenberg (1990) mentioned that “attitude” includes evaluation, recogni- tion, behavior, etc., while Zimbardo and Leippe (1991) divided attitude into 3 lev- els: consciousness, emotion, and behavior.

Therefore, consciousness is a part of at- titude. Also, cognition and attitude are not equivalent, and have different meanings.

2) Validity is the correctness of a measure- ment, meaning the degree to which the characteristics of concern or function is measured by tests or other measurement tools. Higher validity implies a higher de- gree to which the measured results reflect actual characteristics. This study applied the “expert validity” method. In order to avoid a situation where the questionnaire content cannot achieve sufficient precision, the questionnaire should be designed to facilitate respondents’ responses. Hence, our experiments were first pretested and were based on purposive sampling. Five questionnaires were issued to scholars with expertise in related fields. They examined the feasibility of the questionnaire content, revised incomplete descriptions, and de- leted partial question items, so that a final questionnaire was achieved which guaran- teed expert validity.

3) Five experts were asked to assist in exam- ining the questionnaire content, in which each question had 3 options: “agree”, “agree after revised”, and “disagree”. This study further integrated the experts’ advice and suggestions to increase the content validity of the questionnaire, and deleted the ques- tions that satisfied the following conditions:

(1) the ratio of disagreeing with the ques- tion (including blank answers) exceeded 18 L; (2) the ratio of revising and disagree- ing with the question at the same time (including blank answers) exceeded 18 L;

and (3) if the question was suggested to be transfered to another level, it should be de- leted (Chiou 2011).

4) First, random sampling error is a kind of sampling error. Heffernan (2006) indicated that the level of random sampling error can be controlled by selecting the size of random samples. This study collected 333 effective samples, which should have ef- fectively decreased the sampling error. Sec- ond, nonsampling error includes processing errors, response errors, and nonresponse er- rors. This study used a postal questionnaire, which may have produced unavoidable

“nonresponse errors”. This is a limitation of the study.

5) Respondents who had graduated from uni- versity (college) or higher accounted for 69.7 L, which shows that the number of highly educated respondents who mailed their surveys back was greater than the less- educated. Indeed, this may have resulted in a statistical error, but the reason is that our study conducted the survey by mail, which cannot totally avoid biased statistics.

Hence, mailing the survey is a limitation of

the study.

數據

Table 1. Socioeconomic characteristic of respondents  Item  Percentage ( L) Gender  Male 48.5 Female 51.5 Age (yr)  15~25 12.6 26~35   27.6 36~45 21.3 46~55 18.3 &gt; 55  20.2 Marital status  Unmarried 29.9 Married 66.1 Divorced 4.0 Educational level
Table 3. Different socioeconomic characteristics and awareness levels about global warming Socioeconomic characteristic  Level  Level
Table 4. Reliability of respondents’ attitudes towards of global warming
Table 5. Factor analysis of respondents’ attitudes on attitudes towards global warming
+2

參考文獻

相關文件

The ontology induction and knowledge graph construction enable systems to automatically acquire open domain knowledge. The MF technique for SLU modeling provides a principle model

To nurture in students positive values and attitudes and enhance their literacy skills development through appreciation of and interaction with literary texts in the junior

• To enhance teachers’ knowledge and understanding about the learning and teaching of grammar in context through the use of various e-learning resources in the primary

vs Functional grammar (i.e. organising grammar items according to the communicative functions) at the discourse level2. “…a bridge between

Students read the adapted version of the fable “The Lion and the Mouse” to learn to be grateful and the English saying of wisdom “One good turn deserves another.” Teachers

220V 50 Hz single phase A.C., variable stroke control, electrical components and cabling conformed to the latest B.S.S., earthing through 3 core supply cable.. and 2,300 r.p.m.,

Wang, Solving pseudomonotone variational inequalities and pseudocon- vex optimization problems using the projection neural network, IEEE Transactions on Neural Networks 17

Consistent with the negative price of systematic volatility risk found by the option pricing studies, we see lower average raw returns, CAPM alphas, and FF-3 alphas with higher