國立臺灣大學電機資訊學院光電工程學研究所 碩士論文
Graduate Institute of Photonics and Optoelectronics College of Electrical Engineering and Computer
Science
National Taiwan University Master Thesis
使用三維追蹤倍頻顯微鏡系統診斷日光角化症 Application of a Three-dimensional Tracking System
with Harmonic Generation Microscope for Diagnosing Multiple Actinic Keratosis
潘益 Yi Pan
指導教授:孫啟光 博士 Advisor:Chi-Kuang Sun, Ph.D
2019. 4
Apr. 2019
致谢
這篇碩士論文記錄了我在台大近兩年半來的研究生涯,僅希望自 己在這方面的研究能為後來的學弟學妹提供一點幫助。首先我要感謝 指導教授孫啟光老師,無論是在研究方向、研究進展、實驗細節亦或 是科學寫作,我都在老師的幫助下獲益匪淺。感謝台大醫院廖怡華醫 生在臨床實驗和皮膚科學方面的指導。感謝Anatoly Ivanov 教授在 Cr:
forsterite laser 優化方面的指導。
感謝魏銘良學長、陳薈元學長、高健庭學長、林冠宏和高浩正學 長在 laser 和臨床實驗方面的教學和討論。感謝賴嘉宏和周廷翰的相 關討論,很有幸能與你們一起學習相關的課程。感謝陳勝澤和吳沛哲 的實驗協助,感謝你們的幫助。感謝Rebecca 和李敏慈在繁瑣的行政 事務方面的協助。感謝易強光電公司相關工程師的協助,順利完成了 導光臂。
感謝研究計劃(MOST 107-2321-B-002-006 和 MOST 106-2221- E-002-156-MY3)的經費資助。
最後我特別感謝我的父母以及女友冉冉,能讓我心無旁騖的研 究,完成學業。謝謝你們!
潘益 2019.4.22
摘要
日光角化症(AK)是一種常見的由太陽光引起的皮膚病變。它通 常會導致皮膚角質細胞增殖病變。日光角化症的治療非常重要。因為 它是浸入式鱗狀細胞皮膚癌(SCC)的癌前病變徵兆。而且,隨著年 齡的增大,人們患上日光角化症的機率會越來越高。日光角化症患者 通常會有多個病灶區域。為了日光角化症精確地診斷,本文提出了使 用倍頻顯微鏡系統(HGM)作為成像研究工具。倍頻顯微鏡系統提供 次微米級別的分辨率,這對於組織病理學檢查是至關重要的。而且倍 頻顯微鏡對生物組織造成很小的光學損傷。通過比較倍頻顯微鏡和傳 統切片的影像,本論文旨在尋找它們細胞形態學上的一致性,來說明 倍頻顯微鏡影像從某種程度上可以代替傳統的切片影像進行診斷。5 名年齡在 70 至 93 歲之間的日光角化症亞洲志願者(2 名女性和 3 名 男性)參與了這項研究。它含有 1 個離體樣品影像和 4 個活體影像。
為了更好地進行臨床試驗,本文還發展了帶導光臂的可移動倍頻影像 系統。在本文結果中,倍頻影像和傳統切片圖像均顯示角質層(SC)
角化不全和角化過度現象。在棘層(SS)中,顯示不規則棘皮症,棘 層結構異常,棘層細胞和細胞核的多形現象。在基底層(SB)中,均 顯示基底細胞擁擠,細胞形態結構異常。在真皮中,倍頻影像還可以 看出膠原蛋白組織日光彈性性變。此外,本文還說明了在倍頻圖像中 發現的樹突狀結構細胞。本文的案例研究顯示,倍頻顯微影像有潛力 成為日光角化症診斷的替代方案,也有助於醫師從事術後追蹤。
關鍵詞:倍頻顯微術,日光角化症,活體光學切片,細胞組織形 態
ABSTRACT
Actinic keratosis (AK) is a common cutaneous neoplasm consisting of proliferation of atypical epidermal keratinocytes resulting from severe solar damage.
AKs are important because of their potential to develop into invasive cutaneous squamous cell carcinoma (SCC) with the highest incidence in the aged population. AK patients usually have multiple AKs. To study the diagnosis of AK, in vivo harmonic generation microscopy (HGM) was proposed as the imaging tool. HGM provides submicron resolution crucial for histopathological examination and causes little optical damage in bio-tissues. With HGM, this thesis is aimed at seeking out the consistent cell morphology in comparison with the H&E stained histopathological images. Five Asian volunteers (2 females and 3 males) aged from 70 to 93 years old with AK were enrolled in this study. It contained 1 ex vivo and 4 in vivo examinations. Due to the clinical demands, we also developed movable HGM system with light guide in this study. HGM and H&E images of AK both show parakeratosis and hyperkeratosis in the stratum corneum (SC), irregular acanthosis, abnormal architecture and pleomorphism of cells and nuclei in the stratum spinosum (SS), crowding of keratinocytes, abnormal architecture and pleomorphism of cells and nuclei in the stratum basale (SB), and solar elastosis in the dermis. Moreover, we also found dendritic-like cells in AK through HGM images. Our case study indicates that noninvasive HGM may become an alternative to invasive biopsy in the diagnosis of AKs and also helps physician to improve follow-up treatment assessment.
Key words: harmonic generation microscopy, actinic keratosis, in vivo optical biopsy, cell morphology
CONTENTS
致谢... i
摘要... ii
ABSTRACT ... iv
CONTENTS ... vi
LIST OF FIGURES ... 1
LIST OF TABLES ... 11
Chapter 1 Introduction ... 13
1.1 Motivation ... 13
1.2 Thesis Scope ... 15
Chapter 2 Basic Concept ... 16
2.1 Harmonic Generation Microscope ... 16
2.2 Epidermis of Skin ... 18
2.3 Actinic Keratoses ... 19
2.3.1 Clinical Presentation of Actinic Keratoses ... 20
2.3.2 Histopathologic Features of Actinic Keratoses ... 20
2.3.3 Comparing AK and Normal Tissues with H&E Examination ... 22
2.3.4 Treatment ... 24
Chapter 3 Optical Tracking System Setup ... 26
3.1 3D Camera Tracking System ... 26
3.2 Optical System Setup ... 28
3.3 Movable Optical System Setup ... 31
Chapter 4 Materials and Methods ... 36
4.1 Protocol of the Clinical Trial ... 36
4.2 Image Acquisition ... 37
Chapter 5 Results and Discussion ... 39
5.1 Images of the 3D Tracking System ... 39
5.2 Images of HGM ... 40
5.2.1 Normal Epidermal Images of HGM ... 41
5.2.2 Result of the AK Patient 00 ... 42
5.2.3 Result of the AK Patient 01 ... 49
5.2.4 Result of the AK Patients 03 and 04 ... 52
5.2.5 Result of the AK Patient 02 ... 58
5.2.6 Summary ... 62
5.3 Discussion ... 63
REFERENCES ... 73
COPYRIGHT ... 76
LIST OF FIGURES
Fig. 2.1.1 (a) Second-harmonic generation process. (b) Energy level in second- harmonic generation. (p17)
Fig. 2.1.2 (a) Third-harmonic generation process. (b) Energy level in second-harmonic generation. (p17)
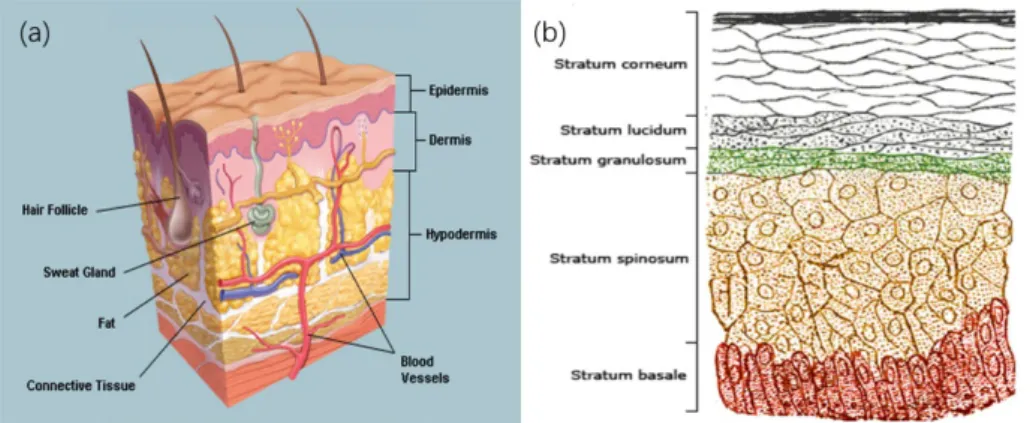
Fig. 2.2.1 (a) A cross-section of all skin layers. (b) A schematic image showing a transverse section of the epidermis, with epidermal layers labeled.[28] Copyright: H.
Gray, “Anatomy of the Human Body.” in public domain. (p18)
Fig. 2.3.2.2 (a) Histology (H&E) of AK. (b) Histology (H&E) of normal skin. Scale bar=20 μm. Copyright: J. Lanoue, C. Chen, G. Goldenberg, “Actinic keratosis as a marker of field cancerization in excision specimens of cutaneous malignancies.” Cutis.
2016, 2016, 97:6 (415-420) with permission from Wolters Kluwer health, Inc. (p22) Fig. 2.3.3.1 (a) Histology (H&E) of Bowenoid AK in the stratum corneum:
parakeratosis/hyperkeratosis in the arrows. Copyright: own work in Wikimedia commons, Nephron. With permission from owner Nephoron. (b) Histology (H&E) of normal skin in the stratum corneum. Scale bar=20 μm. Copyright: A. Day, S. M.
Holland, J. P. Scurry, “Normal vulvar histology: variation by site.” Journal of Lower Genital Tract Disease, 2016, 20:1 (64-69) with permission from Wolters Kluwer health, Inc. (p23)
Fig. 2.3.3.2 Histology (H&E) of AK. Scale bar=20 μm. It is marked the different situations in the stratum spinosum and the stratum basale. Copyright: J. Lanoue, C.
Chen, G. Goldenberg, “Actinic keratosis as a marker of field cancerization in excision specimens of cutaneous malignancies.” Cutis. 2016, 2016 ,97:6 (415-420) with permission from Wolters Kluwer health, Inc. (p23)
Fig. 3.1.1 3D Camera-EinScan-Pro 3D camera. (p27)
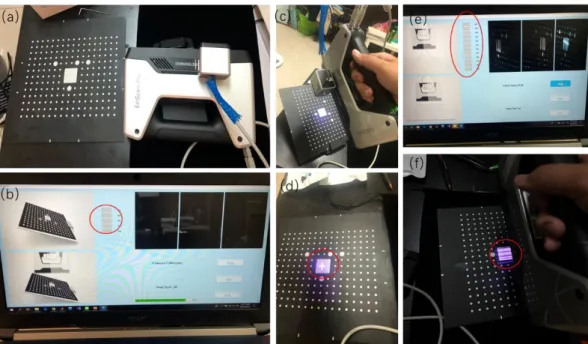
Fig. 3.1.2 (a) 3D Camera-EinScan-Pro 3D camera and the calibration plate. (b) The operation window with calibration step 1. Gray plaids need to be lighted on in the red circle. (c) The calibration plate is set obliquely. The camera shoots a purple cross of light to the white area. (d) The purple cross of light in the white area. (within the red circle) (e) The operation window with calibration step 2. Gray plaids need to be lighted on shown as in the red circle. (f) The camera shoots purple lines (in the red circle) of light to the white area. (p27)
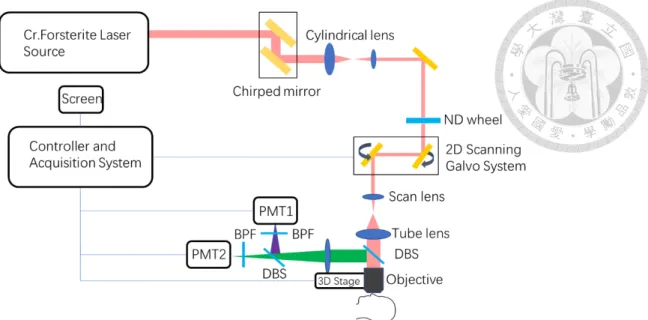
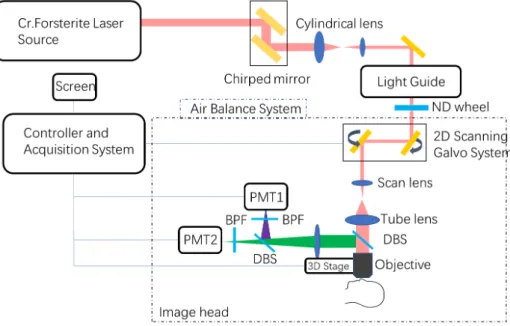
Fig. 3.2.1 A schematic diagram of the optical harmonic generation microscopy system used in the clinical trials. DBS: dichroic beam splitter; PMT: photomultiplier tube; BPS:
band-pass filter. (p30)
Fig. 3.2.2 The mechanical structure of the optical harmonic generation microscopy system. DBS: dichroic beam splitter; PMT: photomultiplier tube; SHG: second harmonic generation; THG: third harmonic generation. (p30)
Fig. 3.2.3 Photos of the harmonic generation microscopy system. (a) Side view. (b) Front view. (c) Upward front view. (p30)
Fig. 3.3.1 A schematic diagram of the movable optical harmonic generation microscopy system with a light guide. DBS: dichroic beam splitter; PMT: photomultiplier tube; BPS:
band-pass filter. (p31)
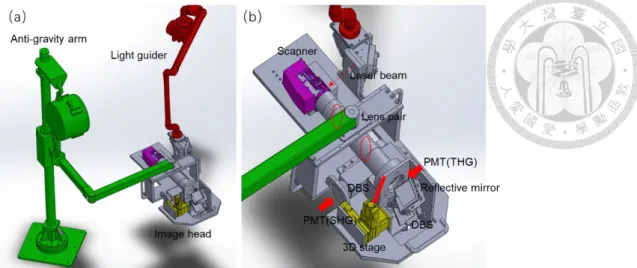
Fig. 3.3.2 (a) The mechanical structure of the optical harmonic generation microscopy system. Light guide and anti-gravity arm are integrated with an image head. (b) The detailed mechanical structure of the image head. DBS: dichroic beam splitter; PMT:
photomultiplier tube; SHG: second harmonic generation; THG: third harmonic generation. (p32)
Fig. 3.3.3 The whole system in reality. (a) Down view. (b) Side view. (c) Front view.
(d) Image head. (p32)
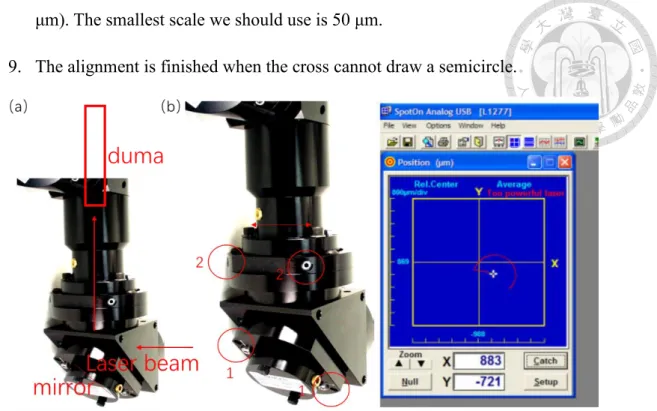
Fig. 3.3.4 (a) The sketch of alignment with duma. (b) Two adjustment screw pairs in the circles 1 and 2 in a part of light guide. (c) A small cross drawing a semicircle on the screen. (p35)
Fig. 4.1.2 The protocol of the whole clinical trial. (p36)
Fig. 4.2.1 (a) The illustration on how a plastic ring was used to prevent acquiring images outside the lesion. (b) The electric hospital bed with a volunteer. (p38)
Fig. 5.1.1 3D camera images of AK 01 patient’s lesion. (a) AK lesion area is 4.835 cm2. (Location in yellow marked.) (b) The length of AK lesion is 2.351 cm. (c) The width of AK lesion is 0.861 cm. (p39)
Fig. 5.1.2 3D camera images of AK 02 patient’s lesion. (a) The location and clinical presentation of the AK lesion before treatment (red circle). (b) The location and clinical presentation of the AK lesion 2 months after treatment (red circle). (c) The location and clinical presentation of the AK lesion 4 months after treatment (red circle). (p39)
Fig. 5.1.3 (a) 3D camera images of AK 03 patient’s lesion. The location of AK is marked with a red arrow. (b) 3D camera images of AK 04 patient’s lesion. The location of AK is marked with a red arrow. (p40)
Fig. 5.2.1 [(a) to (f)] A representative series of in vivo HGM images at different depths relative to the surface (5.4, 14.4, 30.6, 52.2, 75.6 and 111.6 μm). (a) Stratum corneum.
(b) Stratum granulosum. (c) Stratum spinosum. (d) and (e) Stratum basale. (f) Dermis.
Scale bar=50 μm. (p43)
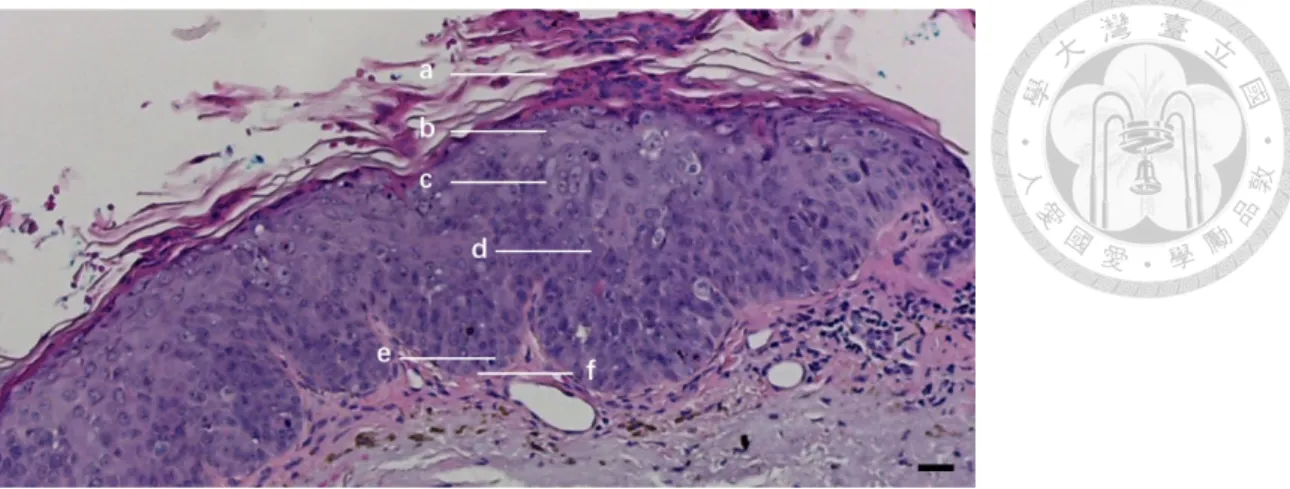
Fig. 5.2.2.1 A transverse histopathology section of the AK patient 00 on the skull. Lines a, b, c, d, e and f represent depths in the epidermis corresponding to en face sections in Fig. 5.2.2.2. Line a is in the stratum corneum. Line b is in the stratum granulosum. Lines c and d are in the stratum spinosum. Line e is in the stratum basale and line f is in the dermis. Scale bar=10 μm. (p43)
Fig. 5.2.2.2 Actinic keratoses [(a) to (f)] A representative series of ex vivo HGM en face sectioned images at different depths relative to the surface (24, 90, 127, 199, 233 and 248 μm) in AK patient 00. The lesion is on the skull. (a) Stratum corneum. There are nuclei (black hole) in the red arrow. (b) Stratum granulosum. (c) and (d) Stratum spinosum. (e) Stratum basale. (f) Dermis. Scale bar=50 μm. (p43)
Fig. 5.2.2.3 A transverse histopathology section of the AK patient 00 on the skull. (a) Stratum corneum. Parakeratosis and hyperkeratosis are obvious to see. The thickness of the stratum corneum is thicker than normal one. (b) Stratum granulosum and stratum spinosum. These cells are all in different sizes and abnormal architecture. Irregular acanthosis is noted in the stratum spinosum. In the circle 1, the pleomorphism of nuclei
is in the cell and cells are in different sizes. In the circle 2, the cell losses polarity and they are irregular acanthosis. (c) Stratum basale. Abnormal architecture is in the stratum basale. The cells are in different sizes and shapes crowding to each other. In the circle 1, the basal cells are slender and bending not like the normal ellipse. In the circle 2, cells are in pleomorphism. In the circle 3, cells are crowding to each other and in different sizes. Scale bar=10 μm. (p43)
Fig. 5.2.2.4 The noise HGM image of the normal volunteer. Scale bar=50 μm. (p46) Fig. 5.2.2.5 THG images and its pixel intensity changing. (a) The HGM image of normal connective tissues without SHG signal in normal volunteer. (b) The pixel intensity of THG signal of normal connective tissues in image(a). (c) The connective tissue of HGM image of AK patient 00 without SHG signal. (d) The pixel intensity of THG signal of AK patient 00’s connective tissues in image (c). Scale bar=50 μm. (p48) Fig. 5.2.2.7 The transverse sectioned images of the stratum basale of AK patient 00 in the same left cheek lesion. (a) The labeled image is HGM of AK. (b) The labeled image is the conventional histopathology of AK. In the red circle (a), the black hole representing the nuclei of the basal cell takes up the majority of the cell volume. In the red circle (b), the darker hole representing the nuclei of the basal cell takes up the majority of the cell volume. In the red arrows, cells are crowding to each other. In the green arrows, these cells are bending and slender. Scale bar=10 μm. (p47)
Fig. 5.2.3.1 A transverse histopathology section of the AK patient 01 on the skull. In the stratum corneum, it shows hyperkeratosis. In the stratum basale, it shows
architectural disarray, crowding keratinocytes and cytologic atypia with large and pleomorphic nuclei and cells (red circle). Scale bar=10 μm. (p49)
Fig. 5.2.3.2 In vivo HGM en face virtual sectioned images of AK patient 01 on the skull.
[(a) to (c)] A representative series of in vivo HGM images taken at different depths relative to the surface in AK patient 01. (a) Stratum corneum. (b) Stratum basale. (c) Stratum basale. In the red circles (b) and (c), it shows that nuclei take up the majority of the cell volume. Scale bar=50 μm. (p50)
Fig. 5.2.4.1 Two transverse histopathology sections of the AK patient 03 in the same lesion of cheek. (a) In the stratum corneum, hyperkeratosis is obvious to see and there is no parakeratosis. The thickness of the stratum corneum is thicker than the normal one. In the stratum spinosum, cell atypia is not obvious to see and it shows normal architecture. Irregular acanthosis exists in the stratum spinosum. In the stratum basale, abnormal architecture is obvious. The cells crowding to each other are in different sizes and shapes. In the circle 1, solar elastosis happens in the dermis. The connective tissues change into purple while the normal connective tissues are pink in H&E image. In the circle 2, the basal cells are pigmented. (b) In the red circle, cell atypia is obvious in the stratum spinosum. Scale bar=10 μm. (p52)
Fig. 5.2.4.2 Actinic keratosis [(a) to (d)] A representative series of in vivo HGM en face sectioned images at different depths relative to the surface in AK patient 03. The lesion is on the cheek. (a) Stratum corneum. There is hyperkeratosis and not parakeratosis. (b) Stratum spinosum. Stratum spinosum shows architectural disarray and cytologic atypia with large and pleomorphic nuclei and cells in the red circle. (c) Stratum basale. The
stratum basale shows architectural disarray, crowding keratinocytes and cytologic atypia with large and pleomorphic nuclei and cells. (d) Dermis. Scale bar=50 μm. (p52) Fig. 5.2.4.3 A transverse histopathology section of the AK patient 04 on the cheek. In the stratum corneum, hyperkeratosis is obvious to see and there is parakeratosis in label.
The thickness of the stratum corneum is thicker than the normal one. In the stratum spinosum, these cells are all in different sizes and it indicted abnormal architecture.
Irregular acanthosis is in the stratum spinosum. In the stratum basale, abnormal architecture is obvious. The cells crowding to each other are in different sizes and shapes. In the circle 1, connective tissues are normal and pink. In the circle 2, solar elastosis happens in the dermis. The connective tissues change into purple amorphous appearance. Scale bar=10 μm. (p53)
Fig. 5.2.4.4 Actinic keratosis [(a) to (c)] A representative series of in vivo HGM en face sectioned images at different depths relative to the surface in AK patient 04. The lesion is on the cheek. (a) Stratum spinosum. Stratum spinosum shows architectural disarray and cytologic atypia with large and pleomorphic nuclei and cells in the red circles. (b) Stratum basale. The stratum basale shows architectural disarray, crowding keratinocytes and cytologic atypia with large and pleomorphic nuclei and cells. (c) Dermis. Scale bar=50 μm. (p54)
Fig. 5.2.4.5 THG images without SHG signal and its pixel intensity changing. (a) The THG image of normal connective tissue without SHG signal in normal volunteer. (b) The pixel intensity of THG signal of normal connective tissue in the image (a). (c) The connective tissue of THG image of AK patient 03 without SHG signal. (d) The pixel
intensity of THG signal of AK patient 03’s connective tissue in image(c). (e) The connective tissue of THG image of AK patient 04 without SHG signal. (f) The pixel intensity of THG signal of AK patient 04’s connective tissue in the image (e). Scale bar=50 μm. (p56)
Fig. 5.2.5.1 A transverse histopathology section of the AK patient 02 on the cheek. In the stratum corneum, it is normal. In the stratum spinosum, it is normal as well. In the stratum basale, the cells crowding to each other are in different sizes and shapes in the circle 1. In the circle 2, basal cells are normal. Scale bar=10 μm. (p58)
Fig. 5.2.5.2 Actinic keratosis [(a) and (b)] A representative series of in vivo HGM en face sectioned images at different depths relative to the surface in AK patient 02. The
lesion is on the cheek. (a) Stratum spinosum. The stratum spinosum is normal. (b) Stratum basale. The stratum basale shows crowding keratinocytes and cytologic atypia with pleomorphic cells in the circle 1. In the circle 2, the basal cells are normal. Scale bar=50μm. (p59)
Fig. 5.2.5.3 THG images without SHG signal and its pixel intensity changing. (a) The HGM image of normal connective tissue without SHG signal in normal volunteer. (b) The pixel intensity of THG signal of normal connective tissue in image(a). (c) The connective tissue of HGM image of AK patient 02 without SHG signal. (d) The pixel intensity of THG signal of AK patient 02’s connective tissue in image(c). Scale bar=50 μm. (p59)
Fig. 5.2.5.5 En face sectioned HGM images of AK patient 02 in the same location after two months. [(a) to (c)] The lesion is on the cheek. (a) Stratum corneum. It is normal.
(b) Stratum spinosum. It is normal. (c) Stratum basale. It is normal. Scale bar=50 μm.
(p61)
Fig. 5.3.1 En face sectioned ex vivo and in vivo HGM images of AK patients in the stratum basale. (a) The stratum basale of AK patient 00. In the red circle, it shows dendritic-cell-like signals. (b) The stratum basale of AK patient 01. In the red circle, it is dendritic-cell-like signals. (c) The stratum basale of AK patient 03. In the red circle, it is dendritic-cell-like signals. (a) The stratum basale of AK patient 04. In the red circle, it is dendritic-cell-like signals. (p63)
Fig. 5.3.3 Example of OCT-images presented in the study set. (A) Normal skin located on the arm, showing a narrow, hyperreflective band corresponding to an entry signal (thick arrow). The epidermis is seen as a homogenous well-demarcated darker layer (marked by *). The dermis is seen as a lighter layer (marked by **) and the DEJ is seen as a clear transition between the layers (thin arrow). (C) AK lesion located on the scalp, showing thickening of the epidermis (marked by *) and purple streaks in the upper epidermis due to hyperkeratosis (thick arrow). The DEJ is disrupted beneath the thickened epidermis (marked by **). Copyright: J. Olsen, L. Themstrup, N. De Carvalho, M. Mogensen, G. Pellacani, G. B. E. Jemec, “Diagnostic accuracy of optical coherence tomography in actinic keratosis and basal cell carcinoma”, Photodiagnosis and Photodynamic Therapy, 2016, 16 (44-49) with permission from Elsevier. (p65) Fig. 5.3.4 Horizontal sections from depths in epidermis. Left column is conventional histopathology of AK, center is RCM of AK, and right column is RCM of adjacent normal skin. (A) Stratum corneum. (B) Stratum granulosum. (C) Stratum spinosum. (D)
Stratum basale. Copyright: D. Aghassi, R. Anderson, S. González, “Confocal laser microscopic imaging of actinic keratoses in vivo: A preliminary report.” Journal of the American Academy of Dermatology, 2000, 43 (42-48) with permission from Elsevier.
(p66)
Fig. 5.3.5 The stratum corneum (A–C) RCM images; (D–F) representative histologic images. Copyright: M. Mlrich, A. Maltusch, F.-D. Rius, J. Röwert-Huber, S. González, W. Sterry, E. Stockfleth, S. Astner, “Clinical applicability of in vivo reflectance confocal microscopy for the diagnosis of actinic keratoses.” Dermatologic Surgery, 2008, 34:5 (610-619) with permission from Elsevier. (p67)
Fig. 5.3.6 Stratum granulosum and stratum spinosum (A–C) RCM images; (D–F) representative histologic images. Copyright: M. Mlrich, A. Maltusch, F.-D. Rius, J.
Röwert-Huber, S. González, W. Sterry, E. Stockfleth, S. Astner, “Clinical applicability of in vivo reflectance confocal microscopy for the diagnosis of actinic keratoses.”
Dermatologic Surgery, 2008, 34:5 (610-619) with permission from Elsevier. (p67) Fig. 5.3.7 Dermis (A, B) RCM images; (C, D) representative histologic images.
Copyright: M. Mlrich, A. Maltusch, F.-D. Rius, J. Röwert-Huber, S. González, W.
Sterry, E. Stockfleth, S. Astner, “Clinical applicability of in vivo reflectance confocal microscopy for the diagnosis of actinic keratoses.” Dermatologic Surgery, 2008, 34:5 (610-619) with permission from Elsevier. (p67)
LIST OF TABLES
Table 2.3.2.1 Histopathologic feature of AK for diagnosis criterion of HGM images.
(p22)
Table 4.1.1 Information of every volunteers. (p36)
Table 5.2.2.5 The evaluation results of H&E and HGM for AK patient 00. “+”
represents that this feature can be recognized. “-” represents that this feature does not exist. “NA” represents that this feature is uncertain to recognize. (p47)
Table 5.2.3.3 The evaluation results of H&E and HGM for AK patient 01. “+”
represents that this feature can be recognized. “-” represents that this feature does not exist. “NA” represents that this feature is uncertain to recognize. (p51)
Table 5.2.4.6 The evaluation results of H&E and HGM for AK patient 03 and 04. “+”
represents that this feature can be recognized. “-” represents that this feature does not exist. “NA” represents that this feature is uncertain to recognize. (p57)
Table 5.2.4.4 The evaluation results of H&E and HGM for AK patient 02. “+”
represents that this feature can be recognized. “-” represents that this feature does not exist. “NA” represents that this feature is uncertain to recognize. (p60)
Table 5.2.6.1 Summary of diagnosis results of 5 patients. “+” represents that this feature can be recognized. “-” represents that this feature does not exist. “NA” represents that this feature is uncertain to recognize. AK grade represents the severity of AK. AK grade III represents serious AK. AK grade II represents middle AK. AK grade I represents mild AK. (p62)
Table 5.3.2 The basal distribution of THG-bright dendritic-cell-like signals in 5 AK patients. “+” represents that this feature can be recognized. “-” represents that this feature does not exist. AK grade represents the severity of AK. AK grade I represents mild AK. AK grade II represents moderate AK. AK grade III represents severe AK.
(p63)
Table 5.3.8 Comparison of OCT, RCM and HGM. (p69)
Table 5.3.9 Diagnosis criterions of HGM, RCM and OCT. “+” represents that this feature can be recognized. “-” represents that this feature is uncertain to recognize. (p69)
Chapter 1 Introduction
1.1 Motivation
Actinic keratosis (AK) is a common cutaneous neoplasm consisting of proliferation of atypical epidermal keratinocytes resulting from severe solar damage.[1][2] AKs are clinically important lesions because of their potential to develop into invasive cutaneous squamous cell carcinoma (SCC) with the highest incidence in the aged population.[3][4] SCC is a type of skin cancer and sometimes becomes fatal if left untreated. The probability that AK will evolve into SCC was estimated at 0.075- 0.096% per lesion per year.[5] Therefore, for a person with an average of 7.7 lesions of AK, the incidence of SCC would be 10.2% in 10 years.[6] Studies have also concluded more than 200,000 SCC cases each year in America. Approximately 10% of AKs will progress to SCCs.[7] What’s more, an estimated 1200 persons die of metastatic SCC each yearcurrently.[8] In addition to SCC, AK also represents a strong predictor for the development of melanoma or basal cell carcinoma.[9] Patients with AKs should be carefully screened for skin malignancy.
AKs are very common with estimated prevalence of 39.5 million in 2004 alone, 26 million of which were patients over 65 years of age all around the world.[4] In Taiwan, from a 7-year survey (1993-1999) for geriatric patients in National Taiwan University Hospital, AK is the second most common skin malignancy among 22.4% of the malignant tumor cases.[10] Within a total of 16,924 patients aged 65 years and older, cutaneous malignant tumors were found in 2.1%. That means there are about 11 AK
NTUH patients each year (Basal cell carcinoma occurred in 29.8%, actinic keratosis in 22.4%, Bowen's disease in 13.3% and squamous cell carcinoma 13.3%). In recent years, there is an increased disease burden of AK in Taiwan as the percentage of geriatric populations increased tremendously.
Most people get more than one AK lesion, and patients who have multiple AKs continue to get new AKs for life. Clinical diagnosis and treatment follow-up for multiple AKs mainly depend on visual inspection and direct counting of all visible lesions. Problems in the direct counting approach may reside in difficulty in dealing with small or almost contiguous lesions. In addition, it is difficult to track the same AK lesion according to the location on the face and its size progression if there are multiple lesions scattered on the whole face. Evaluating treatment efficacy also requires reliable quantification of AKs in the same position before and after treatment. For further research and possibility of automatic diagnosis and care of AKs, standardized and quantized tracking image database should be created.
Exact diagnosis is important to segregate premalignant and malignant lesions prior to treatment. Although histopathology is the gold standard for diagnosis of AK, however, it is not practical to perform invasive skin biopsy for each of the multiple lesions. Histological evaluation is necessarily performed in clinical cases nowadays. To reduce patients’ pain based on humanitarian and take care of every AK lesion, it’s a pressing need to consider a non-invasive way instead of the traditional biopsy.
Nowadays, there are many kinds of non-invasive way to diagnose AKs, such as optical coherence tomography (OCT) and reflectance confocal microscopy (RCM). They have
been reported to evaluate the morphological features of AKs and have the potential talent for the diagnosis.[11][12][13][14] The image results of these optical imaging modalities left some rooms for improvement due to the relatively poor resolution and contrast. Harmonic generation microscopy (HGM) has been proved to have better performance on in vivo human tissue observation with the characteristics of fine contrast, high resolution, deep penetration, and non-invasiveness.[15][16][17][18] In this thesis, we have conducted a clinical trial to examine the performance of the HGM on the diagnosis of AK.
1.2 Thesis Scope
This thesis is arranged in the following order. Chapter 2 introduces some background knowledge of the thesis, including what is harmonic generation microscope (HGM), basic optical principles of HGM, and what is AK. Chapter 3 details the clinical trial system including a 3D camera tricking system and the optical system we used.
Chapter 4 shows the method and protocol of our clinical trials. Finally, in Chapter 5 there are results and discussions. The conclusion and some future prospects are also in Chapter 5.
Chapter 2 Basic Concept
2.1 Harmonic Generation Microscope
Harmonic generation microscope (HGM) is a kind of nonlinear microscope with pulsed lasers to generate and drive different nonlinear processes within samples. For biological safety, HGM is guaranteed by its energy conversion mechanism with a high- peak power and low average power pulse laser. The peak power of a single pulse and the average power of laser are expressed as:
Ppeak=energy per pulse / pulse duration (2.1)
Pave= energy per pulse * number of pulses per second (2.2)
where the number of pulses per second is equal to the repetition rate of the laser.
Given the development of the femtosecond pulse laser and nonlinear optical techniques including multi-photon fluorescence[19], second-harmonic generation (SHG)[20] and third-harmonic generation (THG)[21], there have produced many new optical microscopes. For our HGM, SHG and THG are both used.
The SHG process can be described as in Fig. 2.1.1. Considering the nonlinearity in the atomic response, an atom under the input light field at an angular frequency ω generates new dipole moments at an angular frequency 2ω. When the relative phases of these dipoles are coherent, the field radiated by each dipole will add as the SHG radiation. Therefore, the SHG process does not involve any real state and it’s called a virtual-transition process. Given this, SHG is known with no energy absorption as shown in Fig. 2.1.1(b).
Fig. 2.1.1 (a) Second-harmonic generation process. (b) Energy level in second-harmonic generation.
The THG is a third-order nonlinear optical process. Three photons at angular frequency ω are combined as a new photon of angular frequency 3ω in the nonlinear material as shown in Fig. 2.1.2.
Fig. 2.1.2 (a) Third-harmonic generation process. (b) Energy level in second-harmonic generation.
By the theory of SHG and THG, we can know the resolution of SHG microscope and THG microscope as (‘n’ is the refractive index related to wavelength ‘λ’. ‘NA’ is the numerical aperture of objective.)[22]:
Lateral resolution of SHG microscope = 0.43 * n * λ / NA (2.3) Axial resolution of SHG microscope = 0.71 * n * λ / NA2 (2.4) Lateral resolution of SHG microscope = 0.35 * n * λ / NA (2.5) Axial resolution of SHG microscope = 0.58 * n * λ / NA2 (2.6)
HGM utilizing SHG and THG is well-developed to have high performance on in vivo human tissue observation with the characteristics of high resolution, deep penetration, and non-invasiveness.[23][24][25] SHG can provide contrast on materials with no centro symmetry such as collagen fibrils in skin; THG reveals miscellaneous
structures such as cell nucleus and melanin.[26] Unlike traditional histological transversal sectioned biopsies, HGM images are en face sectioned.
2.2 Epidermis of Skin
The epidermis is the outer layer of the three layers that make up the skin, with the inner layers being the dermis and hypodermis, as shown in Fig. 2.2.1.[27]
Fig. 2.2.1 (a) A cross-section of all skin layers. (b) A schematic image showing a transverse section of the epidermis, with epidermal layers labeled.[28] Copyright: H. Gray, “Anatomy of the Human Body.” in public domain.
The epidermis is composed of 4 or 5 sub-layers depending on the region of skin being considered. First sub-layer is the stratum corneum, composed of 10 to 30 layers of polyhedral, enucleated corneocytes. The stratum lucidum presents only in palms and soles. In the stratum granulosum, keratinocytes lose their nuclei and their cytoplasm appears granular. Cells in the stratum spinosum become connected through desmosomes and start produce lamellar bodies. The stratum basale is composed mainly of proliferating and non-proliferating keratinocytes. Below the stratum basale, it’s dermis. The papillary dermis is the uppermost layer of the dermis. It intertwines with the rete ridges of the epidermis and is composed of fine and loosely arranged collagen
fibers.[29] The reticular dermis is the lower layer of the dermis, found under the papillary dermis, composed of dense irregular connective tissue featuring densely packed collagen fibers. It is the primary location of dermal elastic fibers.[30]
2.3 Actinic Keratoses
Actinic keratoses are proliferations of transformed, neoplastic keratinocytes that are confined to the epidermis and induced by exposure to UV radiation in sunlight.
Neoplastic(of or related to or having the properties of a neoplasm,((腫瘤)瘤化的) transformation occurs in keratinocytes that have been exposed to UV radiation and is due primarily to mutations in the p53 gene. In times, these cells proliferate in the epidermis and eventually extend into the dermis, at which point metastatic(relating to or affected by metastasis, ((癌細胞的)轉移性,變性) spread can occur.[8] Cytologic atypia is visible in early stages and is identical to that seen in metastatic lesions or in SCC in the dermis. While these cells remain confined to the epidermis, the lesions that they cause are termed actinic keratoses, but when they extend more deeply to involve the papillary and/or reticular dermis, they are termed SCC. Thus, AK and SCC are rather a progression along a spectrum but not new.[31]
2.3.1 Clinical Presentation of Actinic Keratoses
Actinic keratoses occur on sun-exposed areas such as the face, lower lip, bald scalp, neck, arms, and hands. They appear as rough, scaly papules and plaques that range from skin tone to reddish brown. The papules and plaques range in size from 1 mm to 2.5 cm or more in diameter. Most affected individuals develop multiple lesions. Because AKs develop after years of sun damage, they occur on older patients and increase in number with age. We show clinical images of AKs in chapter 5.1.
The probability that AK would evolve into SCC was estimated at 0.075-0.096%
per lesion per year.[5] Therefore, for a person with an average of 7.7 lesions of AK, the incidence of SCC would be 10.2% in 10 years.[6] Other sources give even higher estimates, with rates of 13% to 20% of all untreated AK lesions of low and moderate grade will progress to SCC in situ and invade deeper dermal tissues if left untreated over a 10-year period.[32][33]
2.3.2 Histopathologic Features of Actinic Keratoses
The diagnosis of AK is usually made on the basis of clinical characteristics while a biopsy may be required to exclude deeper involvement especially when the lesion is large, bleeding, ulcerated, erythematous, indurated, or otherwise unusual. Because many other diseases cause the same symptoms. Several rare histologic variants, including pigmented, acantholytic (皮膚棘層鬆懈的), and hyperplastic (增生性,肥 大的) types, have also been described. All these rare variants share the characteristic
of atypical keratinolytic proliferation in the epidermis. For discussion in this thesis, only classical features will be mentioned in the comparation and discussion shown in Table 2.3.2.1. However, we still show some observed images on the above-mentioned rare histologic variants in Chapter 5.
In AK, microscopic changes are confined within the epidermis and initiate in the basal layer. Along the progress of the disease, aggregates of atypical, pleomorphic (多 形的) keratinocytes at the basal cells layer would extend to the granular and cornified layers. The epidermis thus demonstrates an abnormal architecture. The dermo epidermal junction appears irregular because of small round buds at the basal cells layer that protrude slightly into the upper papillary dermis. The basal layer of AK often looks closer crowding of atypical keratinocytes than normal basal layer. Hyperkeratosis(角 質層增厚) and parakeratosis(角質層角化不完全) are present in AK, the latter overlying the abnormal cells in the epidermis. The thickness of the stratum spinosum of AK is thicker than thickness of normal the stratum spinosum, which is called irregular acanthosis. Moreover, actinic keratoses almost always occur in association with solar elastosis and superficial inflammatory infiltrate in the dermis.
On cytologic grounds alone, AK contains atypical keratinocytes with loss of polarity, with nuclear pleomorphism, with disordered maturation, and with increased numbers of mitotic figures. Many of the keratinocytes are pleomorphic also in the cellular level.[34] Fig. 2.3.2.2(a) shows that an actinic keratosis demonstrates atypical keratinocytes along the basal layer with hyperchromatic nuclei and atypical maturation compared with the Fig. 2.3.2.2(b) which is the histology of normal skin. Thus, we
focused on the epidermis (especially the basal layer) in our in vivo clinical trials. Based on previous finding, here we summarize (Table 2.3.2.1) the histopathologic features in different epidermis layers, as the diagnosis criterion of our HGM studies of AKs.
Table 2.3.2.1 Histopathologic features of AK for diagnosis criterion of H&E and HGM images.
Fig. 2.3.2.2[35] (a) Histology (H&E) of AK. (b) Histology (H&E) of normal skin. Scale bar=20 μm. Copyright: J.
Lanoue, C. Chen, G. Goldenberg, “Actinic keratosis as a marker of field cancerization in excision specimens of cutaneous malignancies.” Cutis. 2016, 2016, 97:6 (415-420) with permission from Wolters Kluwer health, Inc.
2.3.3 Comparing AK and Normal Tissues with H&E Examination
Here we show some H&E examination images of AKs, with corresponding features in Table 2.3.2.1. This discussion will assist to form our judgement standard.
Fig. 2.3.3.1 (a)[36] Histology (H&E) of Bowenoid AK in the stratum corneum: parakeratosis/hyperkeratosis in the arrows. Copyright: own work in Wikimedia commons, Nephron. With permission from owner Nephoron. (b)[37]
Histology (H&E) of normal skin in the stratum corneum. Scale bar=20 μm. Copyright: A. Day, S. M. Holland, J. P.
Scurry, “Normal vulvar histology: variation by site.” Journal of Lower Genital Tract Disease, 2016, 20:1 (64-69) with permission from Wolters Kluwer health, Inc.
Fig. 2.3.3.1 shows the parakeratosis and hyperkeratosis, in comparison with the normal stratum corneum. From Fig. 2.3.2.2 (b), the thickness of the stratum corneum is one or two cell layers and the nuclei is disappeared. But in Fig. 2.3.3.1(a) keratinization is not complete in the labeled arrow “parakeratosis” due to the retention of nuclei. In the labeled arrow “hyperkeratosis” region, the thickness of the stratum corneum is thicker than the normal one due to proliferation of keratinocytes.
Fig. 2.3.3.2 Histology (H&E) of AK. Scale bar=20 μm. It is marked the different situations in the stratum spinosum and the stratum basale. Copyright: J. Lanoue, C. Chen, G. Goldenberg, “Actinic keratosis as a marker of field cancerization in excision specimens of cutaneous malignancies.” Cutis. 2016, 2016 ,97:6 (415-420) with permission from Wolters Kluwer health, Inc.
Fig. 2.3.3.2 shows the irregular acanthosis in the labeled location, where the thickness of the stratum spinosum is thicker than the thickness of the normal stratum spinosum in Fig. 2.3.2.2(b) and these cells are irregular. In Fig. 2.3.3.2, the circles show abnormal architecture in the stratum basale. These cells are in disordered array. Fig.
2.3.3.2 also shows the pleomorphism of cells and nuclei in the stratum spinosum and in the stratum basale. The shape of cells is not oval and cells vary in different size. In the stratum basale, Fig. 2.3.3.2 shows crowding of keratinocytes, where the cells are closer to each other than cells in Fig. 2.3.2.2(b). In the dermis, Fig. 2.3.3.2 shows the solar elastosis, where the elastosis fiber is purple. The normal collagen fiber is pink in the H&E section in Fig. 2.3.2.2(b). If the connective tissue is purple in H&E section, it means that solar elastosis happens. For all these histopathologic features of AK for diagnosis, the features in the stratum basale are the most important because the pathological changes started in the stratum basale in mild AK cases. The stratum corneum and the stratum spinosum are normal sometimes. For diagnosis in reality, the morphology of the stratum basale is also the main standard for pathologist.
2.3.4 Treatment
A variety of treatment options exist for AK, and the method most suitable varies depending on the size, location, and growth of the lesions, as well as on personal
preference. The most common treatment options are cryotherapy with liquid nitrogen, fluorouracil, and curettage. In our in vivo trails, we used cryotherapy to treat patients.
This treatment requires no anesthetic, and patients tolerate it well despite posttreatment swelling and blistering. The recurrence rate of AKs with this method, while unknown, appears to be low and has been estimated to be as low as 1.2%.[38]
Chapter 3 Optical Tracking System Setup
3.1 3D Camera Tracking System
Most patients get more than one AK and new AKs will continue to appear for life.
Early on, they may disappear only to reappear later. For comparing the effect of treatment, the same positions of AK lesions are also necessary. So, we should track the same lesion position for longtime. Moreover, we also want to record the all multiple locations of AK lesions. Common cameras only record 2D information and the location information cannot be the same in 3D coordinates, which means that we might not be able to take the HGM images in the same location after treatment. In same time, it is also notconvenient for record the location of lesion one by one. Furthermore, with 3D coordinate information it is possible to achieve automatic diagnosis by mechanical arm and AI. It is a fundamental and meaningful work for future. In our lab, we first use 3D camera to scan the head of patients to record the AK lesions. Our 3D camera is EinScan- Pro made by SHINING 3D shown in Fig. 3.1.1. The 3D camera can capture textured and colored objects ranging in size from 0.03 m (.0011 in) up to 4 m (13 ft). The scan speed is 10 frames/s. Moreover, whole scanning time is less than 2 mins due to the old patients. The image processing software is Mesh lab.
Fig. 3.1.1 3D Camera: EinScan-Pro.
When we use the 3D camera every time, we should perform the camera calibration.
The step is shown in Fig. 3.1.2.
Fig. 3.1.2 (a) 3D Camera-EinScan-Pro 3D camera and the calibration plate. (b) The operation window with calibration step 1.Gray plaids need to be lighted on in the red circle. (c) The calibration plate is set obliquely. The camera shoots a purple cross of light to the white area. (d) The purple cross of light in the white area. (within the red circle) (e) The operation window with calibration step 2. Gray plaids need to be lighted on shown as in the red circle.
(f) The camera shoots purple lines (in the red circle) of light to the white area.
The first step is to set the calibration plate obliquely and then the camera shoots a purple cross of light. We should focus the cross of light on the white area (the red circle shown in Fig. 3.1.2.(d)) and move the camera far and near to the plate, which lights all the gray plaids on (the red circle shown in Fig. 3.1.2.(b)). Moreover, we should repeat
the same process in four directions of the calibration plate and then the calibration step 1 is finished. In calibration step 2, we place the calibration plate horizontally on the desk first and then the camera shoots purple lines of light (the red circle shown in Fig.
3.1.2.(f)). Similar to step 1, we should focus the lines on the white area and move the camera far and near to the plate, which lights all the gray plaids on (Gray plaids are shown in the red circle in Fig. 3.1.2.(e)). After 2 steps, the calibration is finished.
Before we take 3D images of volunteers, we should let them wear eye masks. In next, we should make them sit down and keep still. When we start to take 3D image, we should scan the whole face of the volunteer stably until the image is complete in the computer. The whole process of scanning is usually limiting in 2 mins.
3.2 Optical System Setup
The system setup of the harmonic generation microscopy (HGM) for the AK clinical trial is shown in Fig. 3.2.1 to Fig. 3.2.3. In the whole system, we utilized a Cr:forsterite laser with a wavelength of 1260 nm, a bandwidth of 90 nm, a pulse width of 48 fs, average power in mode-locked of 605mW and a repetition rate of 105 MHz as the excitation source. The laser beam was collimated by a pair of cylindrical lenses to optimize the beam shape and by a chirped mirror pair to compensate the group velocity dispersion. The beam after passing through a ND wheel to attenuate the power to a safe level for clinical studies was guided into a galvo-resonant scanning head (Thorlabs Laser Scanning Essentials Kit) to perform 2D-scanning. Next, the laser beam was
focused by an infrared water immersion objective (UAPON340/40X/NA=1.15, Olympus, Tokyo, Japan) with a working distance of 250 μm to excite nonlinear signals in skin. By focusing the laser excitation beam underneath the skin surface, SHG signals at a wavelength of 630 nm and THG signals at a wavelength of 420 nm were generated at the laser focus and the signals originated from the excitation focus were epi-collected and collimated by the same objective and a dichroic beam splitter (DBS). THG and SHG signals were divided by another DBS and sent to two photo-multiplier tubes (PMT) for signal detection (Hamamatsu R4220P for THG and Hamamatsu R928P for SHG).
Before PMTs, they were filtered by two band-pass filters (D410/30 for THG and D615/10 for SHG) inserted. The objective was attached to a 3D step motor so that the position of the objective could be adjusted by both manual tuning and electrical control.
It is reported that conversion efficiency of SHG is ~2.0 * 10-7 and conversion efficiency of THG is ~1.4 * 10-9 in biotical skin tissue.[39] In our system, the radiant sensitivity of PMT is 7.4 x 10⁵ A/W. The background noise is mainly caused from dark current (3 nA). The pixelintensity of background noise is 100 while the pixel intensity of THG is 4000 and the pixel intensity of SHG is 10000. So, the conversion efficiency of SHG is at least ~4.1 * 10-12 and the conversion efficiency of THG is at least ~1.6 * 10-12.
An objective adapter (shown in Fig. 3.2.3(c)) with a cover glass was attached between objective and human skin. Water was dropped in the adapter due to the requirement for the water-immersed objective. Inside the adapter the objective could be moved vertically to take images at different depths.
Fig. 3.2.1 A schematic diagram of the optical harmonic generation microscopy system used in the clinical trials.
DBS: dichroic beam splitter; PMT: photomultiplier tube; BPS: band-pass filter.
Fig. 3.2.2 The mechanical structure of the optical harmonic generation microscopy system. DBS: dichroic beam splitter; PMT: photomultiplier tube; SHG: second harmonic generation;THG: third harmonic generation.
Fig. 3.2.3 Photos of the harmonic generation microscopy system. (a) Side view. (b) Front view. (c) Upward front view.
3.3 Movable Optical System Setup
Due to the shaking of patients, we further developed the optical harmonic generation microscopy system to be movable shown as Fig. 3.3.1.
Fig. 3.3.1 A schematic diagram of the movable optical harmonic generation microscopy system with a light guide.
DBS: dichroic beam splitter; PMT: photomultiplier tube; BPS: band-pass filter.
We redesigned the mechanical structure of optical harmonic generation microscopy system to integrate scanning systems into a box called “image head”. Air- pressure-based antigravity arm was responsible for holding the whole image head, which could move in 3 directions flexibly. The maximum movement range in x-y-z is 30 cm * 30 cm * 30 cm. To align the laser beam always into the image headin the same direction and positionwith the movement of whole system, a light guide containing 8 reflective mirrors was integrated. Therefore, the whole system could be moved with the shaking of patients while the relative position of the objective and the lesion is stablized, which makes the image still legible. The mechanical structure of image head is shown as Fig. 3.3.2 and the whole system in reality is shown as Fig. 3.3.3.
Fig. 3.3.2 (a) The mechanical structure of the optical harmonic generation microscopy system. Light guide and anti- gravity arm are integrated with an image head. (b) The detailed mechanical structure of the image head. DBS:
dichroic beam splitter; PMT: photomultiplier tube; SHG: second harmonic generation; THG: third harmonic generation.
Fig. 3.3.3 The whole system in reality. (a) Down view. (b) Side view. (c) Front view. (d) Image head.
In the new system, we still utilized the Cr:forsterite laser with a wavelength of 1260 nm, a bandwidth of 90 nm, a pulse width of 48 fs, average power in mode-locked of 605mW and a repetition rate of 105 MHz as the excitation source. The laser beam was collimated by a pair of cylindrical lenses to optimize the beam shape and by a chirped mirror pair to compensate the group velocity dispersion. The beam after passing
through a ND wheel to attenuate the power to a safe level for clinical studies was guided into the light guide. The light guide was from Laser Mechanisms, Inc (2.8 arm launch).
The process of light guide alignment is in handbook “2.8 Arm Launch With X-Y Adjuster” and we will introduce the alignment procedure at the end of this sub-section.
The movement range of the light guide was 30 cm X 30 cm X 30 cm in x-y-z directions respectively. The passing rate @1260 nm of light guide with 8 reflective mirrors was more than 96% and the angler bias of the light guide was 0.7 mrad. Then laser beam went into a galvo-resonant scanning head (Thorlabs Laser Scanning Essentials Kit, MPM2PKIT) to perform 2D-scanning. It was 8 kHz resonant scanner. In Fig. 3.3.2 (b), the reflective mirror was silver mirror (ME1S-P01, Thorlabs). The DBS below the reflective mirror was a long-pass dichroic beam-splitter (DMLP900R, Thorlabs). The DBS near the PMTs was a long-pass dichroic beam-splitter (DMLP550R, Thorlabs) while the mount of this DBS was a rotating platform (B3CR, Thorlabs). The objective (UAPON340/40X/NA=1.15, Olympus, Tokyo, Japan) was still with a working distance of 250 μm and PMTs were Hamamatsu R4220P for THG and Hamamatsu R928P for SHG. Before PMTs, two band-pass filters were D410/30 (CHROMA) for THG and D615/10 (CHROMA) for SHG. The field of view (FOV) of the new moveable system was 235 μm * 235 μm. The lateral resolution was 395 μm, whose theoretical resolution was 328 μm.
To align the light guide with laser beam, we should do the followings.
1. We should make the laser beam parallel to optical table.
2. We should move the launch of light guide accurately to match the laser beam into
the center of launch and set an iris in front of the launch.
3. We should record a position of laser beam in the far distance (ex. iris or cross target in the wall).
4. After blocking the original laser beam, we should put the He-Ne laser source in the launch and make the He-Ne laser beam through the recording position in step 2 and step 3. It means that the He-Ne laser beam matches the original laser beam.
5. We should align light guide with He-Ne laser beam. The detector tool is duma (He- Ne laser beam detector) containing a target lens. Duma connects to the computer and the software is SpotOn. We remove the first reflective mirror of light guide arm and set the detector instead shown in Fig. 3.4.4 (a). Fig. 3.4.4 (a) is the sketch of alignment with duma. The purpose is to align the He-Ne laser beam through duma with designing angle and position of light guide by adjustment screws.
6. The adjustment screws are shown in red circles in Fig. 3.3.4 (b). Screws shown in the circles 1 are used to adjust the angle of the mirror and screws shown in the circles 2 are used to adjust the relative position between duma and He-Ne laser beam shown in the double-headed arrow inFig. 3.3.4 (b). We should see a cross drawing a semicircle in screen (shown in Fig. 3.3.4 (c)) when rotating the light guide arm 180o in scale 200 μm. By adjusting screws (circles 1 in Fig. 3.3.4 (b)), we should move the cross to the center of the semicircle.
7. Then we should remove the target lens in the duma and repeat step 5 with adjustment screws (circles 2 in Fig. 3.3.4 (b)).
8. Next, we should repeat the step 6 and 7 in different zooms (200 μm, 100 μm, 50
μm). The smallest scale we should use is 50 μm.
9. The alignment is finished when the cross cannot draw a semicircle.
Fig. 3.3.4 (a) The sketch of alignment with duma. (b) Two adjustment screw pairs in the circles 1 and 2 in a part of light guide. (c) A small cross drawing a semicircle on the screen.
Chapter 4 Materials and Methods
4.1 Protocol of the Clinical Trial
This clinical trial was approved by the National Taiwan University Hospital Research Ethics Committee (No. 201606136DINB). The whole study involved 5 Asian volunteers with multiple AKs (1 ex vivo and 4 in vivo), where the details are shown in Table 4.1.1. The diagnosis of AK was made by a dermatologist Prof. Yi-Hua Liao. We also collected one volunteer as the normal comparison. This volunteer is from the IRB case No. 201612113DINC.
Table 4.1.1 Information of volunteers.
The protocol of the clinical trial in shown in Fig. 4.1.2.
Fig. 4.1.2 The protocol of the whole clinical trial.
First, we used the 3D camera tracking system to take 3D images of AK lesions.
Because the lesion was not in the same height, 2D images could not satisfy the need of surface area measurement. And also, 3D images could record information in 3D coordinates, thus avoiding the variation in photo-taking angles. Then, we took up to three image stacks for the AK lesion (The lesion is pointed by the doctor.) with HGM.
For each image stack, the process of imaging is less than 1 minute. With less than nine AK sites plus one normal site, the total exposure time of the laser light for each volunteer was less than 10 mins. With an average excitation power after the objective around but slightly less than 100 mW, the accumulated photon energy would be less than 60 J in each volunteer, well within the laser safety region..[40][41] The lesion we have taken HGM images was later-on skin biopsied (not the whole lesion) and then we compared the two types of images to find the comparison results. This step was aimed at studying if the HGM images can assist diagnosis of AK without biopsy. Next, patients got treatment (cryotherapy) in the lesion we took and we repeated taking 3D images and HGM images in two months after the treatment.
4.2 Image Acquisition
There were two types images we have taken: 3D facial images and HGM images.
For recording the all AK lesions, we used the 3D camera to scan the whole face of volunteer. The volunteer would be asked to sit down and wear eye shields. The process was less than 2 mins.
In next, we would take HGM images of AK lesions pointed by doctor. In order to ensure that the HGM images were acquired from AK lesions, a thin plastic ring with a hollow circle approximately of the size of the lesion was stuck on the subjects’ face (shown in Fig. 4.2.1 (a)). The SHG and THG signals would not be generated under the opaque plastic ring. When taking the HGM images, the volunteer would be asked to lie on an electric hospital bed with its height and bending angle adjustable (shown in Fig.
4.2.1 (b)). The environment of lab would be absolutely dark due to the working condition of PMTs. Because the AK volunteers were aged, the whole process of taking HGM images would be less than 30 mins. To control the condition of each experiment, there were some parameters to be determined. First, the excitation power after the objective should be measured before attaching the white adapter to make sure that it was around 100 mW. Second, the PMTs voltage, determining the amplification level of the signal, should be set at a certain level. For SHG modality, the voltage was set as 600 volts. For THG modality, the voltage was set as 700 volts. Finally, the step size along the optical axis of the automated step motor to which the objective was attached was set as 1.8 μm. During the acquisition, the software ThorImageSL 3.0 would be set to 512 * 512 pixels.
Fig. 4.2.1 (a) The illustration on how a plastic ring was used to prevent acquiring images outside the lesion. (b) The electric hospital bed with a volunteer.
Chapter 5 Results and Discussion
5.1 Images of the 3D Tracking System
With 3D camera system, we recorded images of 4 patients (AK patients 01 to 04) as shown in Fig. 5.1.1, Fig. 5.1.2 and Fig. 5.1.3.
Fig. 5.1.1 3D camera images of AK 01 patient’s lesion. (a) AK lesion area is 4.835 cm2. (Location in yellow marked.) (b) The length of AK lesion is 2.351 cm. (c) The width of AK lesion is 0.861 cm.
Fig. 5.1.2 3D camera images of AK 02 patient’s lesion. (a) The location and clinical presentation of the AK lesion before treatment (red circle). (b) The location and clinical presentation of the AK lesion 2 months after treatment (red circle). (c) The location and clinical presentation of the AK lesion 4 months after treatment (red circle).
Fig. 5.1.3 (a) 3D camera images of AK 03 patient’s lesion. The location of AK is marked with a red arrow. (b) 3D camera images of AK 04 patient’s lesion. The location of AK is marked with a red arrow.
In Fig. 5.1.1(a), we can calculate that the specific lesion area on a curved surface was 4.835 cm2 accurately. The feature and location of lesion is distinct compared to the normal photos. Fig. 5.1.2 shows that the lesion of AK patient 02 got flatten and pale after treatment. Fig. 5.1.3 shows location of lesion on the cheek of AK patients 03 and 04.
5.2 Images of HGM
The whole clinical trial contains 5 patients (AK patient 00 to 04), including 1 ex vivo and 4 in vivo. We show the en face sectioned HGM images of normal volunteer first. In next, we show the results of 5 patients case by case.
5.2.1 Normal Epidermal Images of HGM
Normal epidermal stratification of the stratum corneum, the stratum granulosum, the stratum spinosum, and the stratum basale can be visualized in serial en face label- free virtual sections by using HGM and has already been described before.[42] Thus, a stack of HGM images of normal epidermal on face shown in Fig. 5.2.1.1 are used as our standard for comparison. In other words, these images are used to compare with the results of 5 patients in the morphology as will be discussed below. In Fig. 5.2.1.1, we can see different layers in different depths where the morphology is consistent with Fig.
2.3.2.2(b). The thickness of the normal stratum corneum in face is 9(±2) μm.[43][44] If the thickness of the stratum corneum we measured is more than 11 μm, it would suggest hyperkeratosis. In stack of Fig. 5.2.1, the distance between each picture in z direction is 0.6 μm while the whole stratum corneum contains 15 pictures. So, the thickness of the stratum corneum in our normal comparison is 9 μm,less than theoretical value.
The thickness of the stratum spinosum depends on where it is located on the body.[45]
So, we use the thickness we measured in our normal volunteer. The thickness of our normal stratum spinosum is 16.2 μm (27 pictures). If the thickness of the stratum spinosum we measured is more than 19 μm (20% more), it would suggest irregular acanthosis.
Fig. 5.2.1 [(a) to (f)] A representative series of in vivo HGM images at different depths relative to the surface (5.4, 14.4, 30.6, 52.2, 75.6 and 111.6 μm). (a) Stratum corneum. (b) Stratum granulosum. (c) Stratum spinosum. (d) and (e) Stratum basale. (f) Dermis. Scale bar=50 μm.
5.2.2 Result of the AK Patient 00
Following the evaluation standard in Table 2.3.2.1, Fig. 5.2.2.1 exemplifies the H&E histopathology of the AK patient 00 in a transverse section, whereas Fig. 5.2.2.2 illustrates representative en face optically-sectioned HGM images of the same AK lesion, at depths in the epidermis that correspond to the lettered lines (a, b, c, d, e, f) in Fig. 5.2.2.1. For easier and clearer to explain, we show histopathology details in labeled Fig. 5.2.2.3.
Fig. 5.2.2.1 A transverse histopathology section of the AK patient 00 on the skull. Lines a, b, c, d, e and f represent depths in the epidermis corresponding to en face sections in Fig. 5.2.2.2. Line a is in the stratum corneum. Line b is in the stratum granulosum. Lines c and d are in the stratum spinosum. Line e is in the stratum basale and line f is in the dermis. Scale bar=10 μm.
Fig. 5.2.2.2 Actinic keratosis [(a) to (f)] A representative series of ex vivo HGM en face sectioned images at different depths relative to the surface (24, 90, 127, 199, 233 and 248 μm) in AK patient 00. The lesion is on the skull. (a) Stratum corneum. There are nuclei (black hole) in the red arrow. (b) Stratum granulosum. (c) and (d) Stratum spinosum. (e) Stratum basale. (f) Dermis. Scale bar=50 μm.
Fig. 5.2.2.3 A transverse histopathology section of the AK patient 00 on the skull. (a) Stratum corneum. Parakeratosis and hyperkeratosis are obvious to see. The thickness of the stratum corneum is thicker than normal one. (b) Stratum granulosum and stratum spinosum. These cells are all in different sizes and abnormal architecture. Irregular acanthosis is noted in the stratum spinosum. In the circle 1, the pleomorphism of nuclei is in the cell and cells are in different sizes. In the circle 2, the cell losses polarity and they are irregular acanthosis. (c) Stratum basale. Abnormal architecture is in the stratum basale. The cells are in different sizes and shapes crowding to each other. In the circle 1, the basal cells are slender and bending not like the normal ellipse. In the circle 2, cells are in pleomorphism. In the circle 3, cells are crowding to each other and in different sizes.Scale bar=10 μm.
From the H&E histopathologic features of AK patient 00, some conclusions can be made from Fig. 5.2.1, Fig. 5.2.2.1, Fig. 5.2.2.2 and Fig. 5.2.2.3.
(1) The thickness of the stratum corneum in H&E images of AK patient 00(Fig.
5.2.2.1(a)) is much thicker than the thickness of the normal stratum corneum shown in normal H&E images (Fig. 2.3.2.2(b)). It’s hyperkeratosis. The nuclei are still in the stratum corneum. Parakeratosis is obvious. In HGM images of AK patient 00 (Fig.
5.2.2.2(a)), the stratum corneum is 33.6 μm thick (56 pictures), which is much thicker than 11 μm.HGM thus suggests hyperkeratosis. Moreover, the nuclei shown as a dark hole in Fig. 5.2.2.2(a) are still in keratinocyte of the stratum corneum, different from Fig. 5.2.1(a). HGM thus also suggests parakeratosis.
(2) In H&E images of AK patient 00 (Fig. 5.2.2.3(b)), the stratum spinosum shows architectural disarray and cytologic atypia with large and pleomorphic nuclei and cells.
In the circle 1, pleomorphism of nuclei happens and cells are in different sizes and shapes. In the circle 2, the cell losses polarity and the thickness of the stratum spinosum is thicker than normal one. It is irregular acanthosis. In ex vivo HGM images (Fig.
5.2.2.2(c) and (d)), the thickness of the stratum spinosum is 55.8 μm (93 pictures), which is much thicker than 19 μm. HGM thus suggests irregular acanthosis.
Furthermore, in HGM images (Fig. 5.2.2.2(d)), it shows architectural disarray and
cytologic atypia with large and pleomorphic nuclei and cells different from normal one in Fig. 5.2.1(d). It reveals abnormal architecture and pleomorphism of cells and nuclei.
In HGM images, the morphology of stratum spinosum can be clearly recognized and is in consistency with H&E histopathology images (Fig. 5.2.2.3(b)).
(3) In the H&E histopathology image (Fig. 5.2.2.3(c)), the stratum basale still shows architectural disarray and cytologic atypia with large and pleomorphic nuclei and cells. The cells are close crowding to each other. In the circle 1, the basal cells are slender and bending rather than oval. Similar morphology can also be observed in HGM images (Fig. 5.2.2.2(e) and Fig. 5.2.2.2(f)). In the circle 2, cells are in pleomorphism.
In the circle 3, cells are crowding to each other and in different sizes. Similar morphology (architectural disarray) can also be observed in HGM images (Fig.
5.2.2.2(e) and Fig. 5.2.2.2(f)), different from normal (Fig. 5.2.1(f)), where basal cells are oval rather than slender and bending as shown in Fig. 5.2.2.2(f). Moreover, basal cells in Fig. 5.2.2.2(f) are more crowding to each other than cells in Fig. 5.2.1(f).
(4) In the dermis, H&E image shows solar elastosis. Partial connective tissues in the dermis are purple in Fig. 5.2.2.1. When solar elastosis happens, the deposition of elastin material will increase in the dermis so that it should enhance the intensity of THG signal.[46] We choose the HGM images (only retaining THG signals and shown as THG images) which only contains connective tissues in the dermis and measure all area of THG signals. Because the back ground noise is different in different PMTs, we chosen the normal HGM images as comparison with the same PMTs and same PMT settings (THG: 600v). The HMG images of the normal volunteer was from different

![Fig. 5.2.1 [(a) to (f)] A representative series of in vivo HGM images at different depths relative to the surface (5.4, 14.4, 30.6, 52.2, 75.6 and 111.6 μm)](https://thumb-ap.123doks.com/thumbv2/9libinfo/9604270.630486/50.892.136.787.111.498/fig-representative-series-images-different-depths-relative-surface.webp)