國立臺灣大學生命科學院分子與細胞生物學研究所 碩士論文
Graduate Institute of Molecular and Cellular Biology College of Life Science
National Taiwan University Master Thesis
藉由定量磷酸化蛋白質體學分析探討 MCM2 在肺癌細胞 中的調控網絡
Quantitative phosphoproteomic analysis uncovers the regulatory networks of minichromosome maintenance
protein 2 in lung cancer cells 張曉婷
Siao-Ting Chong 指導教授:阮雪芬 博士 Advisor: Dr. Hsueh-Fen Juan, Ph.D.
中華民國 104 年 7 月
July, 2015
II
誌謝
在 兩 年 的 研 究 所 學 習 過 程 , 隨 著 論 文 的 付 梓 , 即 將 劃 上 句 點 。 這 篇 論 文 能 順 利 完 成 , 幸 蒙 指 導 教 授 阮 雪 芬 老 師 花 費 精 力 與 時 間 , 不 吝 地 為 學 生 於 研 究 的 方 向 停 供 指 導 與 教 誨 。 感 謝 老 師 在 論 文 的 修 訂 上 提 供 了 寶 貴 且 專 業 的意 見,使 得本 論文 的 內容更 加 完 備充實。 師恩浩 瀚,永銘於 心。
我 還 要 感 謝 實 驗 室 的 所 有 成 員 , 所 有 曾 經 幫 助 過 我 的 學 長 學 弟 學 姊 學 妹 還 有 好 同 學 , 給 我 許 多 研 究 方 面 建 議 , 幫 我 解 決 各 式 各 樣 的 實 驗 問 題 。 謝 謝 你 們 平 常 的 照 顧 與 幫 助 , 伴 我 渡 過 這 兩 年 的 研 究 所 生 涯 。 研 究 室 成 員 們彼 此 的情誼, 我 會銘記 在 心及珍 惜 這個緣 分。
最 後 我 還 要 感 謝 我 最 摯 愛 的 父 母 , 哥 哥 及 三 位 弟 弟 , 感 謝 您 們 的 關 懷 照 顧 和 支持 ,讓我 能 專注於 課 業研究 中 ,願以 此 與家人 共享。
張 曉婷 分子與 細胞生 物學研究所 中華民 國一百 零四年七月
III
中文摘要
微小染色體維持蛋白 2(MCM2)是 DNA 複製的主要調控因子。 MCM2 與其它 MCM 蛋白結合形成六聚體複合物(MCM2-7),並發揮具有解旋酶活性的功能。
其功能除了用於 DNA 解旋,還會限制 DNA 在每個細胞週期僅複製一次。 MCM2 在增殖細胞中表現量高,因此在許多種癌症被廣泛用作生物標誌物。然而,
MCM2 的分子調控機制在肺癌細胞中研究甚少。在這項研究中,我們用 A549 (wild-type p53)和 H1299(p53-null)細胞株探討 MCM2 在肺腺癌扮演的角色。
研究結果顯示,在 A549 細胞中過表達 MCM2 會促進細胞增殖,而在 H1299 細胞 中抑制 MCM2 表達則會減少細胞增殖。接著,我們進行定量磷酸化蛋白質體學來 揭示在肺癌細胞中受 MCM2 調控的重要下游基因的網絡。我們在過度表達 MCM2 的 A549 細胞中共鑑定出 594 個磷酸化蛋白及 1494 個磷酸化位點。這些磷 酸化位點中,有 164 磷酸化蛋白具有顯著差異。此外,在低表達 MCM2 的 H1299 細胞中,我們鑑定 588 個磷酸化蛋白及 1599 個磷酸化位點。這些磷酸化位點中,
有 82 個磷酸化蛋白有顯著差異。這些有顯著差異的磷酸化蛋白參與了 RNA 剪接,
細胞週期和細胞骨架等功能。在表達 MCM2 的 A549 細胞過和低表達 MCM2 的 H1299 細 胞 中 , 我 們 發 現 一 個 共 同 被 調 控 的 磷 酸 化 位 點 , 即 是 絲 氨 酸 -99
(Ser99),它位在高遷移率族蛋白 HMG-Ⅰ/ HMG -Y(HMGA1)上。這表明 HMGA1-Ser99 對肺癌細胞有著重要的調節作用。我們的結果提供肺癌細胞受 MCM2 調控的磷酸化蛋白質體,並發現其調控磷酸化網絡。這些研究為肺癌治療提 供了新的目標。
關鍵詞:定量磷酸化蛋白質體學、微小染色體維持蛋白 2、調控網絡、肺癌
IV
ABSTRACT
Minichromosome maintenance protein 2 (MCM2) is a licensing factor for DNA replication. It interacts with other MCM proteins to comprise MCM2-7 complex, which acts as a helicase for DNA unwinding and limits DNA replication to one round per cell cycle. MCM2 has been widely used as a biomarker for proliferation in many types of cancer. However, the molecular regulation underlying MCM2 in lung cancer cells is poorly understood. In this study, we investigated the role of MCM2 in lung adenocarcinoma A549 (wild-type p53) and H1299 (null p53) cells. MCM2 overexpression increased cell proliferation in A549 cells while silencing MCM2 decreased cell proliferation in H1299 cells. We performed global quantitative phosphoproteomic analysis to uncover the important downstream networks regulated by MCM2 in lung cancer cells. We identified 1484 phosphorylation sites in 593 phosphoproteins of MCM2-overexpressed A549 cells. Of these phosphosites, 110 phosphoproteins were significantly changed in response to MCM2 overexpression. In addition, we identified 1599 phosphorylation sites in 592 phosphoproteins of MCM2- silenced H1299 cells. Of these phosphosites, 57 phosphoproteins were significantly changed in response to MCM2 silencing. The differentially regulated phosphoproteins are involved in biological functions such as RNA splicing, cell cycle and cytoskeleton regulation. Functional study demonstrated that MCM2 overexpression promoted cell migration in A549 cells. Moreover, silencing MCM2 inhibits cell migration and induces cell cycle arrest in H1299 cells. Furthermore, we observed a common phosphorylation change at Ser-99 of high mobility group protein HMG-I/HMG-Y (HMGA1) in both MCM2 overexpression and silencing, indicating an important regulatory effect of Ser-
V
99 HMGA1 on lung cancer cells. The phosphoproteomic profiling of MCM2 in lung cancer cells provides new insight about phosphorylation networks regulated by MCM2 and reveals novel targets for lung cancer therapy.
Keywords: Quantitative phosphoproteome, minichromosome maintenance protein-2, regulatory networks, lung cancer cells
VI
Contents
口試委員會審定書 ... I 誌謝 ... II 中文摘要 ...III
ABSTRACT ... IV LIST OF FIGURES ... IX LIST OF TABLES ... XI
Chapter 1 INTRODUCTION...1
1.1 Lung cancer ... 1
1.2 Minichromosome maintenance protein 2 (MCM2) ... 1
1.3 The MCM2 and cancer ... 2
1.4 Phosphoproteomics ... 2
1.5 Aim of the study ... 4
1.6 Experimental Design ... 4
Chapter 2 EXPERIMENTAL PROCESSES ...6
2.1 Cell Culture human lung epithelial cells ... 6
2.2 Protein extraction ... 6
2.3 Reduction, Alkylation and Protein Digestion ... 7
2.4 Dimethyl labelling ... 7
2.5 Phosphopeptide Enrichment ... 8
VII
2.6 NanoLC−MS/MS Analysis ... 8
2.7 Data Processing and Analyses ... 9
2.8 Plasmid construction and transfection ... 10
2.9 siRNA transfection ... 10
2.10 Site-directed mutagenesis ... 11
2.11 MTT and MTS cell viability assay ... 11
2.12 Colony formation assay ... 12
2.13 Cell migration assay ... 12
2.14 Cell cycle analysis using flow cytometry ... 12
2.15 Western blot ... 13
2.16 Statistics analysis ... 14
Chapter3 RESULTS ...15
3.1 Overexpression of MCM2 in A549 increased cell proliferation and silencing MCM2 in H1299 cells decreased cell proliferation ... 15
3.2 P53 might be the up-regulator of MCM2 ... 16
3.3 Phosphoproteome of MCM2 overexpression in A549 cells and silencing MCM2 in H1299 cells ... 16
3.4 Identification of differentially regulated phosphoproteins in response to MCM2 18 3.5 Overlap between phosphoproteome of MCM2 overxepression and silencing MCM2 ... 18
3.6 Functional annotation of MCM2-regulated phosphoproteins ... 19
VIII
3.7 Overexpression of MCM2 in A549 increased cell migration while silencing
MCM2 in H1299 cells decreased cell migration ... 20
3.8 Silencing MCM2 in H1299 cells induced cell cycle arrest... 20
3.9 Phosphorylation of HMGA1 at Ser99 is essential for viability ... 21
Chapter 4 DISCUSSION ...23
Chapter 5 CONCLUSION ...28
Chapter 6 FUTURE WORK ...29
ABBREVIATION ...30
REFERENCES ...32
FIGURES ...41
TABLES ...61
IX
LIST OF FIGURES
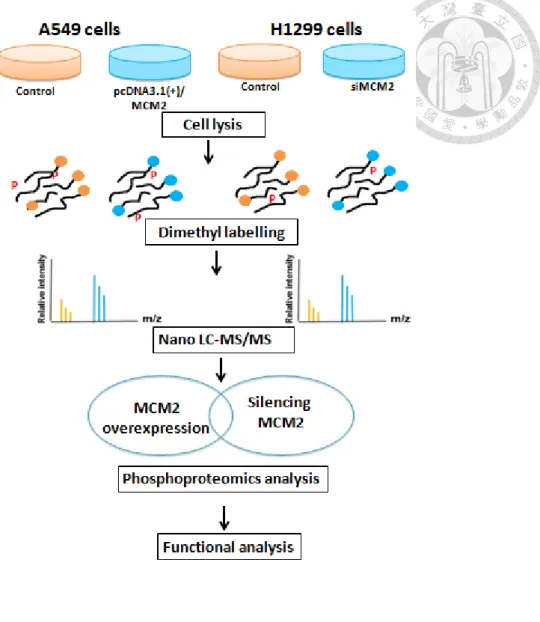
Figure 1. Schematic illustration of the experimental design of this study.
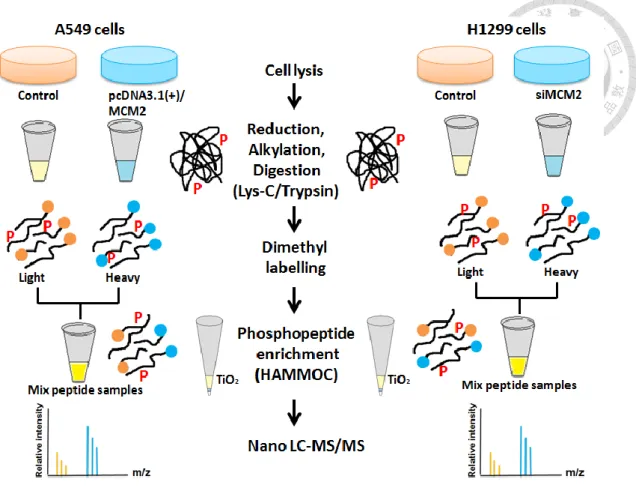
Figure 2. Schematic workflow of phosphoproteomics.
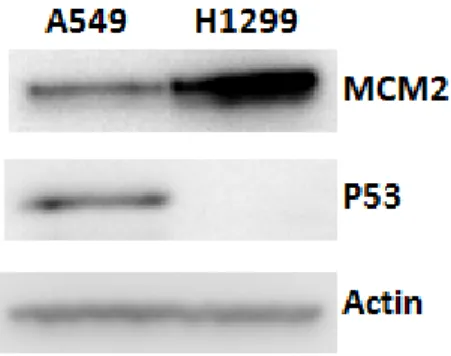
Figure 3. Endogenous expression of MCM2 in lung cancer cells.
Figure 4. Overexpression of MCM2 in A549 increased cell growth in lung cancer cells.
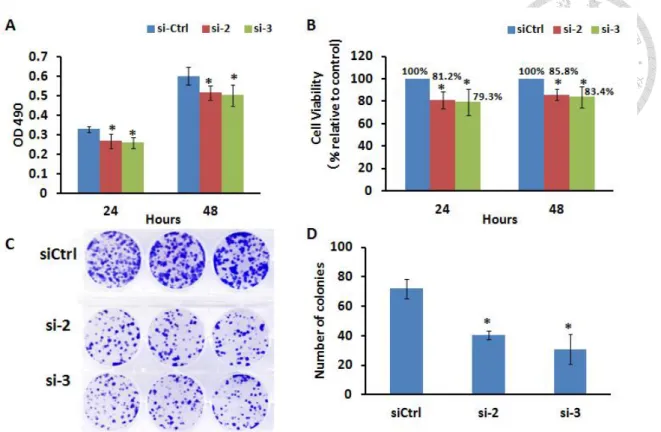
Figure 5. Silencing MCM2 in H1299 cells decreased cell proliferation.
Figure 6. The relationship between P53 and MCM2.
Figure 7. Confirmation of the MCM2 protein expression upon MCM2 overexpression in A549 cells and silencing MCM2 in H1299 cells.
Figure 8. Distribution of single, doubly, triply and quadruply phosphorylated peptides.
Figure 9. Distribution of phosphorylated serine, threonine, and tyrosine sites.
Figure 10. Phosphoproteome of MCM2 in lung cancer cells.
Figure 11. List of GO-term of regulated phosphoproteins in phosphoproteome of MCM2 overexpression in A549 cells.
Figure 12. List of GO-term of regulated phosphoproteins in phosphoproteome of silencing MCM2 in H1299 cells.
Figure 13. Protein enrichment analysis.
Figure 14. Overexpression of MCM2 in A549 increased cell migration.
Figure 15. Silencing MCM2 in H1299 cells decreased cell migration.
Figure 16. Silencing MCM2 in H1299 cells induced cell cycle arrest.
Figure 17. The MS/MS spectrum of the phosphopeptide KLEKEEEEGISQESSEEEQ from HMGA1 (high mobility group protein HMG-I/HMG-Y).
X
Figure 18. Phosphorylation of HMGA1 at S99 is essential for viability.
XI
LIST OF TABLES
Table 1. PCR primer sequences for plasmid construction.
Table 2. Number of phosphopeptides, phosphosites and phosphoproteins.
Table 3. List of all common differentially regulated phosphosites.
Table 4. List of all differentially regulated phosphosites.
Table 5. List of GO-term of regulated phosphoproteins in phosphoproteome of MCM2 overexpression in A549 cells.
Table 6. List of GO-term of regulated phosphoproteins in phosphoproteome of silencing MCM2 in H1299 cells.
Table 7. The phosphosites on MCM2 identified in the phosphoproteome data.
Table 8. The phosphosites on high mobility group (HMG) proteins identified in the phosphoproteome data.
1
Chapter 1 INTRODUCTION
1.1 Lung cancer
Lung cancer is the most common cancers in the world. Due to lacking of advances in diagnostic and therapeutic techniques, the overall 5-year survival rate of lung cancer remains low, which is less than 18%.1 In Taiwan, lung cancer remains the leading cause of cancer death which recorded the 5-year survival rate of 15.9%, with a median survival of 13.2 months.2 In general, there are two major types of lung cancer: small cell lung cancer (SCLC) and non-small cell lung cancer (NSCLC). NSCLC is further categorized into subgroups including adenocarcinomas, squamous cell and large cell carcinomas. NSCLC accounts for approximately 80–85% of lung cancer cases, with squamous cell carcinoma and adenocarcinoma being the most common histological subtypes.3
1.2 Minichromosome maintenance protein 2 (MCM2)
Mcm2-7 is a helicase complex which consists of six different subunits (historically numbered from 2 to 7). MCM2 is also called as DNA replication licensing factor, is one of six members of the minichromosome maintenance (MCM) protein family. Briefly, replication initiation starts with licensing process, which involved the assembly of pre- replicative complexes (pre-RCs) at replication origins. The six subunit origin recognition complex (ORC; subunits Orc1-6), Cdc6 and Cdt1 cooperate to load the hexameric MCM2-7 complex onto double-stranded DNA as an inactive double hexamer.4,5 At the G1/S transition, two kinases, CDK and Dbf4-dependent kinase (DDK), activate the MCM helicase, which involves the recruitment of Cdc45 and the heterotetrameric GINS complex to form the CMG complex.6-8 MCM complex forms the
2
part of the pre-replication complex (pre-RC) at origins of DNA replication and acts as of "licensing factor" to initiate DNA replication and to limit replication to one round per cell cycle.9,10
1.3 The MCM2 and cancer
MCM2 have been proposed as an excellent proliferation marker to evaluate the proliferation state in many types of cancer including colon cancer, gastric cancer, breast cancer and prostate cancer.11-14 Previous studies reported that MCM2 is a promising marker in premaglinant lung cells and non-small cell cancer.15,16 MCM genes are associated with lung cancer as evidenced by a study of 178 tumor genomes revealed that 10% of lung squamous cell carcinomas were found to contain amplifications and 12%
of lung squamous cell carcinomas contained point mutations in at least one of the six
MCM genes.
17 In in-vivo animal studies, an experimental reduction of MCM2 expression in transgenic mice caused lymphomas, implied that reductions in MCM2 expression levels are linked to human cancer.18,19 Recent studies revealed the role of MCM2 as a novel therapeutic target of anti-cancer drugs such as TSA in colon cancer cells and lovastatin in NSCLCs, suggested that MCM2 might play an important role in cancer treatment. 20,21 The molecular regulation of MCM2 in lung cancer has not been fully elucidated and the MCM2 offers a novel target for drug development to block uncontrolled cancer proliferation.1.4 Phosphoproteomics
Recently, phosphoproteomic technologies which primarily focusing on post-translation modifications have emerged as useful tools for large-scale study of phosphorylated proteins and contributed to the development of cancer biomarkers and drug targets.
Protein phosphorylation is the most frequent reversible post-translation modifications.
3
In eukaryotic proteome, upwards of 30% of the proteins are prone to be phosphorylated at some point during their existence.22 Study of phosphoproteomics is of great importance as protein phosphorylation governs most of the signal transduction processes and regulates a number of cellular processes, including cell cycle, growth, apoptosis, and differentiation. In phosphoproteomic experiments, the problem of low abundant phosphorylated proteins needed to be tackled. To date, there are various methods developed to enrich the low abundant phosphorylated proteins or peptides prior to MS analysis. The common approaches for serine/threonine and tyrosine phosphopeptide enrichment included the immobilized metal affinity chromatography (IMAC), IMAC with methyl esterification, strong cation exchange chromatography and metal oxide chromatography (MOC) using titania, zirconia and alumina.23-32 A more popular phosphopeptides enrichment method using MOC modified with aliphatic hydroxy acids named as Hydroxy Acid-modified Metal Oxide chromatography (HAMMOC) has proven to be successful in large scale phosphoproteomic studies with advantage of reducing non-specific binding of the acidic amino acid residues.33 In this study, we applied mass spectrometry-based phosphoproteomics using HAMMOC phosphopeptides enrichment method to characterize the phosphorylation events of MCM2 in NSCLC. We analyzed and interpreted the phosphoproteome data of NSCLC in response to MCM2 in order to identify the reliable candidate proteins for subsequent experimental studies or downstream analysis, to discover protein-protein interactions and to infer about the regulatory network. Here, we obtained a global view of protein phosphorylation events that occur downstream of MCM2 in lung cancer cells.
4
1.5 Aim of the study
1. To acquire the phosphoproteomic profile and characterize the phosphorylation events upon MCM2 overexpression and silencing MCM2.
2. To investigate and validate the biological process regulated by MCM2 in human lung cancer cells.
3. To identify the key phosphoproteins regulated by MCM2 and study its phospho-
regulation function.1.6 Experimental Design
The experimental design of this study is illustrated in Figure 1. We first compared the endogenous MCM2 protein expression level in two lung carcinoma cell lines A549 and H1299. Next, we optimized the transfection condition for MCM2 overexpression and silencing MCM2. For MCM2 overexpression in A549 cells, we transfect cells using 1 ug of MCM2-overexprssing plasmid and harvest cells after 24 hours. For silencing MCM2 in H1299 cells, we transfect cells using siRNA at final concentration of 10 nmol and harvest cells after 48 hours. Protein was extracted from cell lysates, subjected to the phosphoproteomics workflow (as shown in Figure 2) including reduction, alkylation and protein digestion, dimethyl labelling, phosphopeptide enrichment and nanoLC−MS/MS analysis. The raw LC-MS/MS data were analyzed by MaxQuant version 1.5.0.30 using the Andromeda Search engine and searched against the human Swiss-Prot database (reviewed, without isoforms) September 2014 release. We compared the overlap in phosphosites and phosphoproteins from phosphoproteome of MCM2 overxepression in A549 cells versus silencing MCM2 in H1299 cells.
Phosphoproteins that change phosphorylation level significantly are selected by ratio H/L normalized <= 0.67 (1.5-fold reduced) or >= 1.5 (1.5-fold increased). Ratio H/L
5
normalized represents peptide ratios provided by the MaxQuant output, which have been normalized for each LC-MS/MS run. Localization of PTM probabilities are required to be at least of 0.75.
6
Chapter 2 EXPERIMENTAL PROCESSES
2.1 Cell Culture human lung epithelial cells
Human lung epithelial cells A549 (ATCC, CCL-185) and H1299 (ATCC, CRL-5803) were obtained from American Type Culture Collection (Manassas, VA, USA). The A549 cells were cultured in Dulbecco’s modified Eagle’s medium (DMEM, Gibco, Grand Island, NY, USA) while the H1299 cells were cultured in RPMI 1640 medium (Gibco, Grand Island, NY, USA), both are supplemented with 10% fetal bovine serum (FBS, Biological Industries, Beit Haemek, Israel). The cell lines were maintained at 37°C in a controlled humidified atmosphere in an incubator containing 5% CO2.
2.2 Protein extraction
Cells were washed twice with PBS and trypsinized. Cell pellet was collected by centrifugation at 1000 ×g for 5 min and resuspended in PTS buffer (with aid of Phase- Transfer Surfactants) containing 12 mM sodium deoxycholate (SDC, Sigma-Aldrich, St.
Louis, MO, USA) and 12 mM sodium lauroyl sarcosine (SLS, MP Biomedicals, Santa Ana, CA, USA) in triethyl ammonium bicarbonate (TEABC, Sigma-Aldrich). Protease inhibitor cocktail (Bioshop, Burlington, Ontario, Canada), Tyrosine and Serine/Threonine phosphatase inhibitors cocktail (Bionovas, Bremerton WA, USA) were added before sonication. The cells were sonicated on ice using a homogenizer (LABSONIC® M ultrasonic homogenizer, Sartorius AG, Goettingen, Germany) with 60% amplitude and 0.6 cycle duration for 1 minute. The supernatant containing the protein extract was collected by centrifugation at 12000×g for 20 min and the protein concentration was measured using a Pierce™ BCA Protein Assay Kit (Thermo Fisher Scientific, Waltham, MA, USA) according to the user manual.
7
2.3 Reduction, Alkylation and Protein Digestion
Protein extract was reduced with 10 mM dithiothreitol (DTT, WAKO, Osaka, Japan) at room temperature for 30 min, and carbamidomethylated with 55 mM iodoacetamide (IAA, Sigma-Aldrich) at room temperature in darkness for 30 min. Alkylated protein was digested with endopeptidase Lys-C (1:100 w/w) (WAKO) for 2 h followed by sequencing grade modified trypsin (1:100 w/w) (Promega, Mannheim, Germany) for overnight at room temperature. The resulting peptide mixture was acidified with TFA to pH < 3, desalted using StageTips with SDB-XC Empore disc membranes (SDB-XC StageTip) (3M, Neuss, Germany) and eluted in a buffer containing 0.1% TFA and 80%
acetonitrile. The digested peptides solution is vacuum dried prior to dimethyl labeling.
2.4 Dimethyl labelling
The stable isotope dimethyl labelling involves the formation of a Schiff base via the reaction of formaldehyde with the primary amines, which is then reduced by cyanoborohydride. 34 The digested peptides from the control and treatment samples were reconstituted separately with 100uL of 0.1M TEABC. 4uL of 4% CH2O (37%
Formaldehyde solution, Sigma-Aldrich) for light or 4% 13CD2O (20% Formaldehyde-
13C, d2 solution, Sigma-Aldrich) for heavy together with 4 μL of 0.6 M sodium cyanoborohydride (NaBH3CN, Sigma-Aldrich) was added to the digested peptides from the control and treated samples, respectively and incubated for 1 h at room temperature, with shaking. The reaction was quenched by adding 16 uL ammonia solution (WAKO) to the samples on ice and subsequently added 25 µl of 10% formic acid (WAKO) to the samples. The light-labelled and heavy-labelled samples were mixed and acidified with 10 μL of TFA before proceed to stage-tip desalting.
8
2.5 Phosphopeptide Enrichment
The phosphopeptides were enriched with the aid of aliphatic hydroxy acid, which named as hydroxy acid-modified metal oxide chromatography (HAMMOC), as previously described.33 TiO2 has higher affinity toward phosphate groups followed by lactic acid, with weaker affinity to the carboxylic groups of acidic amino acid residues, i.e., aspartic and glutamic acid. To efficiently reduce the non-specific binding of acidic non-phosphorylated peptides to TiO2, the TiO2 beads are blocked with lactic acid first, phosphopeptides in successive loading step compete out lactic acid for TiO2 binding, whereas acidic non-phosphopeptides remain unbound due to the weaker affinity than lactic acid to TiO2.35 Briefly, custom-made HAMMOC tips were prepared by packing 0.5-mg TiO2 beads (10 μm, GL Sciences, Tokyo, Japan) into 10-μL C8 StageTips. Prior to sample loading, the HAMMOC tips were equilibrated with solution A containing 0.1%
TFA, 80% acetonitrile, and 300 mg/ mL of lactic acid. About 100 ug of the desalted peptide mixture was mixed with an equal volume of solution A and loaded onto the HAMMOC tips (100 μg of mixed peptides per tip). After successive washing with solution A and solution B (0.1% TFA and 80% acetonitrile), the resulting phosphopeptides were eluted by 0.5 and 5% piperidine (WAKO). The eluent was acidified with TFA and desalted with SDB-XC StageTip. After desalting with SDB-XC StageTip, the phosphopeptides were resuspended in 0.5% TFA and subjected to nanoliquid chromatography (nanoLC)−MS/MS analysis.
2.6 NanoLC−MS/MS Analysis
LTQ-Orbitrap XL hybrid mass spectrometer (Thermo Fisher Scientific, Breman, Germany) was used in this study. MS system was coupled with a Dionex Ultimate3000 LC system (Thermo Fisher Scientific) with an HTC-PAL autosampler (CTC Analytics,
9
Zwingen, Switzerland). Peptide mixtures were loaded onto a 100 μm × 150 mm fused- silica capillary column packed with C18 material (3 μm, Dr. Maisch GmbH, Amerbuch Germany). The injection volume for peptide samples was 5 μL, and the flow rate was 500 nL/min. The mobile phases consisted of (A) 0.5% acetic acid and (B) 0.5% acetic acid and 80% acetonitrile. A three-step linear gradient of 5−10% B in 5 min, 10−40% B in 60 min, 40−100% B in 5 min, and 100% B for 10 min was employed throughout this study. For LTQ-Orbitrap XL, the instrument was operated in the positive ion mode, and data was acquired as follows: a full MS scan (m/z 300−1500) was recorded, and the top 10 precursor ions were selected in the MS scan by the Orbitrap detector for subsequent MS/MS scans by ion trap in the automated gain control mode and the automated gain control values of 5.0 × 10⁵ and 1.0 × 10⁴ were set for full MS and MS/MS, respectively.
All the measurements in the LTQ Orbitrap XL were performed with a lock mass.36 For each sample, duplicate nanoLC−MS/MS analyses were performed.
2.7 Data Processing and Analyses
All raw LC-MS/MS data were analyzed by MaxQuant version 1.5.0.30 using the Andromeda Search engine and searched against the human Swiss-Prot database, the reviewed part of Uniprot, without isoforms (September 2014 release). Enzyme specificity was set to trypsin, allowing for cleavage N-terminal to proline and between aspartic acid and proline. The search included carbamidomethylation of cysteine as a fixed modification and N-acetylation and oxidation of methionine (and phosphorylation of serine, threonine, or tyrosine for phosphoproteins) as variable modifications. Up to two missed cleavages were allowed for protease digestion, and enzyme specificity was set to trypsin, defined as C-terminal to arginine and lysine excluding proline. The match between run feature and the second peptide option was disabled and everything else set
10
to the default values. The “identify” module in MaxQuant was used to filter (1% FDR) identifications at the peptide and protein level. Phosphorylation sites were considered localized at a site localization probability above 75%.
2.8 Plasmid construction and transfection
To construct Mcm2 expressing plasmid, a full-length sequence of MCM2 was amplified
by PCR using the primer pair
MCM2-Forward
(5’-GCTAGCGCCACCATGGCGGAATCATCGGAA 3’) and MCM2-Reverse (5’
CGCACGCGTACAAGCTTTCAGAACTGCTGCAGGAT 3’). The amplified PCR products was inserted into the NheI/HindIII sites of pcDNA3.1(+)(Invitrogen, Burlington,ON,USA). The p53 expressing plasmid pcDNA3.1(-)/TP53 was kindly provided by Dr. Hsin-Yi Chang (our laboratory). The shRNA targeting p53 and luciferase were obtained from the National RNAicore, Academia Sinica, Taiwan. All sequence of insert was confirmed by sequencing result. Prior to plasmid transfection into cells, 2x10⁵ of A549 cells or 5x10⁴ of H1299 cells were seeded on 6-well plates per well and allowed to attach overnight. Cells at 70-80% confluence were transfected with plasmid or shRNA (sh-TP53 in H1299 cells) using Lipofectamine 2000 or Lipofectamine 3000 (Invitrogen, Burlington, IA, USA) according to the manufacturer’s instructions.
2.9 siRNA transfection
H1299 cells were transfected with three different siRNA duplexes against MCM2 or control siRNA (Cat # SR302835, Origene, Rockville, MD, USA) using Lipofectamine 3000 (Invitrogen, Burlington,IA, USA) according to the manufacturer instructions. At 48 hours after transfection, cells were harvested and used for Western blotting.
11
2.10 Site-directed mutagenesis
The HMGA1 gene was amplified by PCR using the primer pair HMGA1-Forward (5’- AAAGGATCCGCCACCATGAGTGAGTCGAGCTCG 3’) and HMGA1-Reverse (5’
AAATTGGGCCCTCACTGCTCCTCCTCCGAGGACT 3’). The amplified PCR products was inserted into the ApaI/BamHI sites of pcDNA3.1(+)(Invitrogen, Burlington,ON,USA). Primers containing the desired mutation, are listed below:
HMGA1-S99A (5' GGAGGGCATCGCGCAGGAGTC 3'); HMGA1-S99E (5'
GGAGGGCATCCAGCAGGAGTCC 3'). Synthesis of the mutant strand was performed by PCR using the plasmid pcDNA3.1(+)/HMGA1-WT as template in the presence of Phusion high-fidelity DNA polymerase (Finnzymes, Espoo, Finland). Suitable cycling parameters were chosen according to the QuikChange site-directed mutagenesis kit (Stratagene, La Jolla, CA, USA). At the end of the PCR, 1 μL of the restriction enzyme DpnI (Merck) was added directly to each amplified product, and the reaction was incubated at 37°C for 1 h. Finally, 1 μL of the DpnI-treated DNA from each amplification reaction was transformed into the E. coli strain DH5-alpha. The plasmid DNA was sequenced at the DNA Sequencing Facility (Genomics BioSci & Tech.).
2.11 MTT and MTS cell viability assay
The MTT powder (3(4,5-dimethylthiazol-2-yl)-2,5-diphenyltetrazolium bromide Sigma- Aldrich) were prepared as stock in PBS at the concentration of 5 mg/ml and filtered.
The MTS reagent powder (3-(4,5-dimethylthiazol-2-yl)-5-(3-carboxymethoxyphenyl)- 2-(4-sulfophenyl)-2H-tetrazolium, inner salt, Promega) were prepared as stock in PBS at the concentration of 20 mg/ml and filtered. At 24 hours post-transfection, 5000 cells were reseeded in 96-well plate and incubate for 24 and 48 hours. 20 ul MTT solution was added to each well at each time point and followed by incubation for 3 hours at
12
37°C with 5% CO2 until the violate crystal formed. MTT was carefully aspirated and the formazan crystals were dissolved with 50 ul dimethyl sulfoxide (DMSO, Scharlau Chemie, Barcelona, Spain) and agitated avoided from light for 15 min to completely solubilize the crystals. The absorbance was measured at 570 nm on an ELISA reader (BioRad Laboratories, Hercules, CA, USA). For MTS assay, 20 ul mixture of MTS solution and PMS (phenazine methosulfate) at ratio 1:20 were added to each well at each time point and followed by incubation for 1 hours at 37°C with 5% CO2. The absorbance was measured at 490 nm.
2.12 Colony formation assay
At 24 hours post-transfection, 500 cells were seeded into 6-well plates. Colonies were allowed to form for 8 days. The colonies were washed with 1xPBS. The cells were fixed with methanol and stained with crystal violet (0.2mg/ml) for 15 minutes at room temperature.
2.13 Cell migration assay
A migration assay was performed using 8-μm pore size transwell plates (Corning, MA, USA). At 48 hours post-transfection, 3x10⁴ cells with serum-free medium were loaded into the inserts and medium containing 10% FBS was loaded into the lower compartments. The cells were incubated at 37°C for six hours. The cells were fixed for 30 minutes using 100% methanol and stained with 0.1% crystal violet for 30 minutes.
Cotton swabs were used to remove cells from the upper site of the inserts. Images of five different fields of each insert were captured and the number of cells was counted.
2.14 Cell cycle analysis using flow cytometry
Cells were collected, fixed in 70% ethanol (Sigma-Aldrich) and stored at -20°C for
13
overnight. Then, the cells were washed using PBS, resuspended in PBS containing 100 μg/ml RNase A and 0.1% Triton X-100 and incubated at 37°C for 1 hour. Cells were stained with 5 μg/ml propidium iodide (PI, Santa Cruz Biotechnology, Texas, USA) for 15 minutes in the dark. The DNA content of the cells was analyzed using a FACSCanto instrument (BD Biosciences Immunocytometry Systems, San Jose, CA, USA). At least 10,000 cells were collected for each measurement in a triplicate experiment. The percentage of cells in different phases of the cell cycle was analyzed using ModFit LT (Verity Software House, USA).
2.15 Western blot
Samples (30 ug) were mixed with sodium dodecyl sulfatepolyacrylamide gel electrophoresis (SDS-PAGE) sample buffer, boiled for 5 minutes, electrophoresed on a 10% SDS polyacrylamide gel, and transfered onto polyvinylidene difluoride (PVDF) membrane (Millipore). The membrane was blocked in 5% non-fat milk in TBST for 1 hour with gentle agitation. The membrane was incubated with the following primary antibody diluted in blocking buffer at 4°C overnight: rabbit anti-MCM2 (GeneTex, San Antonio, TX, USA; 1:1000), mouse anti-P53 (Santa Cruz, CA, USA; 1:1000), rabbit anti-HMGA1 (abcam, Cambridge, MA, USA; 1:1000) and mouse anti-Actin (Millipore;
1:5000). After washing, the membrane was incubated with appropriate horseradish peroxidase-labelled secondary antibody (Sigma-Aldrich; 1:100000) for 2 hours at room temperature. Signal was developed with Clarity Western ECL Substrate Kit (BioRad Laboratories, Hercules, CA, USA).
14
2.16 Statistics analysis
Results are expressed as the mean ± standard deviation. The Student's t test was used to analyze the cell viability assay, colony formation assay, migration assay and flow cytometry. The statistical significance in this study was set at P < 0.05.
15
Chapter3 RESULTS
3.1 Overexpression of MCM2 in A549 increased cell proliferation and silencing MCM2 in H1299 cells decreased cell proliferation
As described previously, MCM2 is known as good proliferation marker in various cancer cells. To investigate the role of MCM2 in lung cancer cells, we performed functional analysis of MCM2 overexpression and silencing MCM2 using A549 and H1299 cells. Both A549 and H1299 cells are lung carcinoma where A549 cells express p53 while H1299 do not. The H1299 cells have a homozygous partial deletion of the p53 protein and lack expression of p53 protein. We first compared the endogenous expression of MCM2 in two types of lung cancer cells, A549 and H1299 cells. Western blot analysis (Figure 3) showed that the endogenous expression of MCM2 in H1299 (p53 null) is higher if compared to A549 (p53 wild-type). Due to the significant different in endogenous MCM2 expression between these two cell lines, we performed MCM2 overexpression using A549 cells and silencing MCM2 using H1299 cells. MTT or MTS proliferation assay and colony formation assay were performed to evaluate the cell proliferation of A549 and H1299 cells in response to MCM2 overexpression and silencing MCM2 respectively. MCM2-overexpressed A549 cells exhibited a significant increase in cell proliferation (increased 65.0% and 38.2% of cell viability at 24 and 48 hours) and higher number of colonies formed as compared to control vector (Figure 4).
In contrary, MCM2-silenced H1299 cells (both si-2 and si-3) showed a significant decrease in cell proliferation and lower number of colonies formed as compared to control siRNA. As shown in Figure 5, si-2 reduced 18.8% and 14.2% of cell viability while si-3 reduced 20.7% and 16.6% of cell viability at 24 and 48 hours.
16
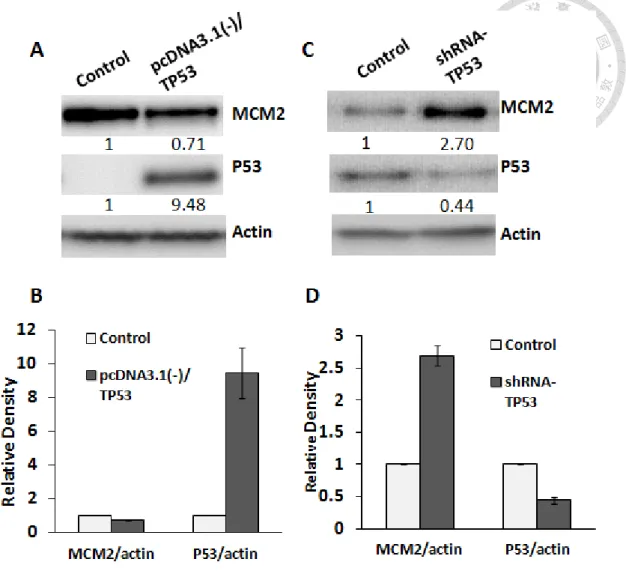
3.2 P53 might be the up-regulator of MCM2
As described previously, the endogenous expression of MCM2 in H1299 (p53 null) is higher if compared to A549 (p53 wild-type). We wondered if p53 exerts regulatory effect on MCM2 in lung cancer. Increased susceptibility to cancer is closely related to loss or mutation of p53.37 In lung cancer, TP53 gene abnormalities such as mutation or other alterations are frequently occur in both SCLC and NSCLC types. 38 However, the relationship between MCM2 and p53 has not been studied. In looking for a possible correlation between MCM2 and p53, we analyzed their protein expression level in lung cancer cells. To examine the effect of p53 overexpression in H1299 cells (p53 null), cells were transfected with either control plasmid or pcDNA3.1(-)/TP53 for 48 hrs.
Figure 6A and 6B showed that overexpression of p53 in H1299 resulted in downregulation of MCM2 expression. To further support the causal correlation between p53 and MCM2, we knockdown p53 expression in A549 cells using plasmid shRNA- TP53 (knockdown efficiency= 44%). Figure 6C and 6D showed that MCM2 protein expression was increased in p53-silencing cells. These results support that p53 could be the upregulator of MCM2 in lung cancer cells. Here, we established a basic regulatory relationship between p53 and MCM2 but their detailed regulation mechanism remains unclear. Since the data indicated that p53 might control the upstream regulation of MCM2, the p53 status in A549 cells and H1299 cells would not affect the downstream study of MCM2.
3.3 Phosphoproteome of MCM2 overexpression in A549 cells and silencing MCM2 in H1299 cells
In order to reveal the regulatory networks of MCM2 in lung cancer cells, we performed quantitative MS analysis of phosphorylated proteins in A549 cells and H1299 cells.
17
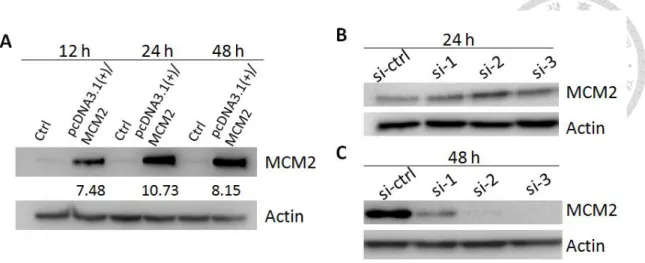
Quantitative phosphoproteomics provide information about the phosphorylation target sites and the quantitative phosphorylation level changes in response to genetic or environmental perturbations. As described previously, endogenous expression of MCM2 in H1299 (p53 null) is higher than in A549 (p53 wild-type). Thus, we performed MCM2 overexpression in A549 cells and silencing MCM2 in H1299 cells in order to detect the phosphorylation events induced by MCM2. For MCM2 overexpression, A549 cells were transfected with either control vector or MCM2 expressing plasmid (pcDNA3.1+/MCM2) and were cultured for 24 hours. This time point was selected because the overexpression level of MCM2 was highest at 24 hours post-transfection as shown in Figure 7A. For silencing MCM2, H1299 cells were transfected with either non-target siRNA or siRNA for MCM2 and were cultured for 48 hours. Two siRNAs for MCM2(si-1 and si-2) which showed high knockdown efficiency at 48 hours post-transfection (as shown in Figure 7B and 7C) were used in this phosphoproteomics experiment. In total, we performed phosphoproteomics experiments of MCM overexpression, silencing MCM2-si-1 and silencing MCM2-si-2 with two biological replicates and two LC-MS/MS measurements in each biological replicate.
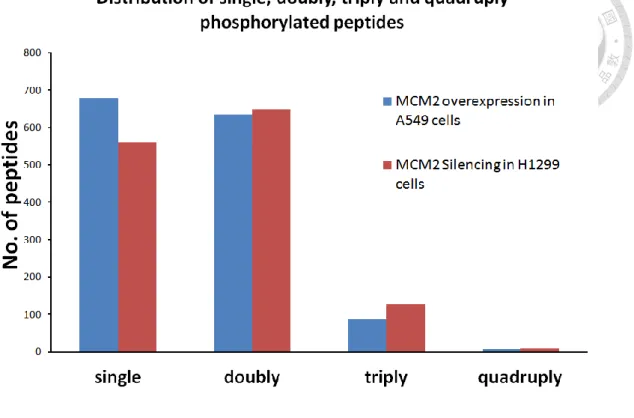
MaxQuant is a software platform that has been widely used for the analysis of shotgun proteomics data.39,40 As shown in Table 2, using MaxQuant software, we identified over 1409 phosphopeptides that mapped to 1494 phosphorylation sites on 594 phosphoproteins in MCM2-overexpressed A549 cells. In MCM2-silenced H1299 cells, we identified over 1347 phosphopeptides that mapped to 1599 phosphorylation sites on 588 phosphoproteins. In the phosphoproteome of MCM2 overexpression, a majority of phosphopeptides was either single (48.3%) or doubly (45.1%) phosphorylated, followed by a small portion of triply (6.2%) and quadruply (0.4%) phosphorylated (Figure 8)
18
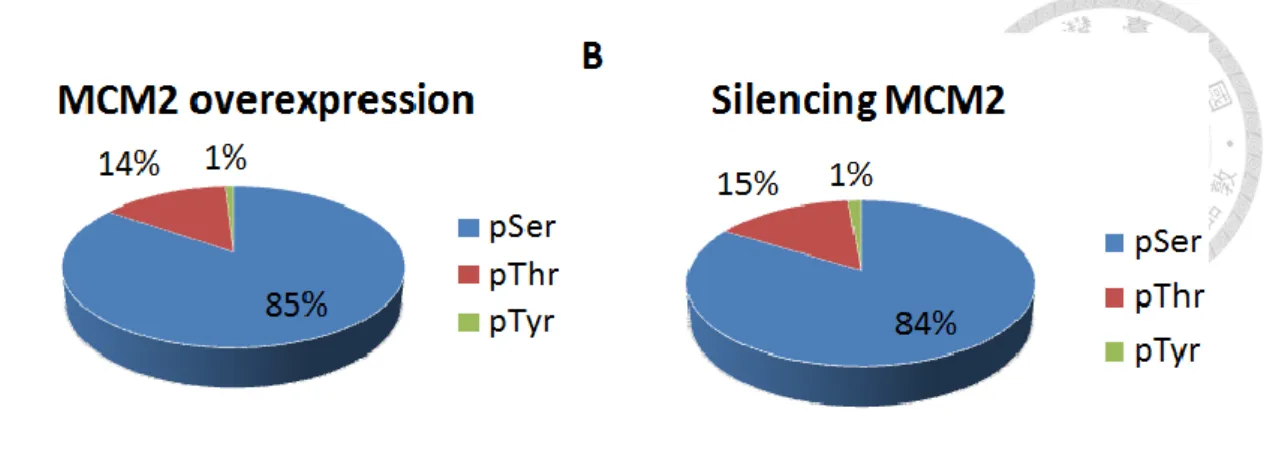
while in the phosphoproteome of silencing MCM2, a majority of phosphopeptides was either single (41.6%) or doubly (48.2%) phosphorylated, followed by a small portion of triply (9.5%) and quadruply (0.7%) phosphorylated (Figure 8). The distribution of phosphoserine (pSer), phosphothreonine (pThr) and phosphotyrosine (pTyr) identified in phosphoproteome of MCM2 overexpression was 85%, 14% and 1% respectively (Figure 9A) while in phosphoproteome of silencing MCM2 was 84%, 15% and 1%
respectively (Figure 9B). The percentages of serine, threonine and tyrosine phosphorylation sites identified in both phosphoproteome of MCM2 overexpression and silencing MCM2 are close to that observed in the most common forms of protein phosphorylation, including O-phosphorylations on serine (~90%), threonine (~10%) and tyrosine (~<1%).41
3.4 Identification of differentially regulated phosphoproteins in response to MCM2
Phosphorylation level of each phosphopeptide is represented as peptide ratios (Ratio H/L normalized) provided by the MaxQuant output, which have been normalized for each LC-MS/MS run. Phosphoproteins that change phosphorylation level significantly are selected by ratio H/L normalized <= 0.67 (1.5-fold reduced) or >= 1.5 (1.5-fold increased). Localization of PTM probabilities are required to be at least of 0.75. In A549 cells, a total of 105 phosphoproteins were significantly changed in response to MCM2 overexpression. In H1299 cells, a total of 54 phosphoproteins were significantly changed in response to MCM2 silencing (Table 4).3.5 Overlap between phosphoproteome of MCM2 overxepression and silencing MCM2
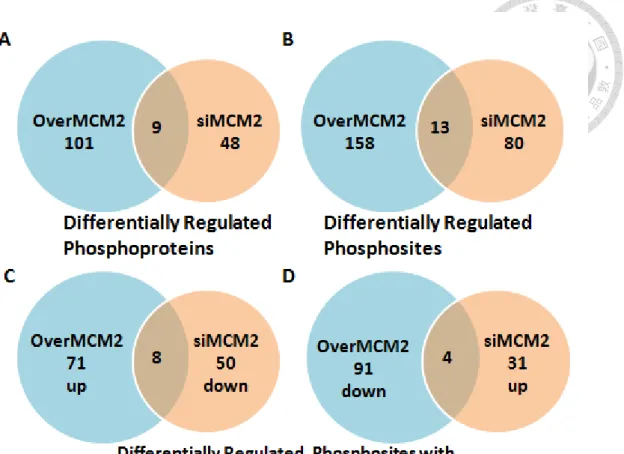
Our goal is to sort out the key phosphoproteins that are likely regulated by MCM2 regardless of types of cell line. We examined the overlap in phosphosites and
19
phosphoproteins from phosphoproteome of MCM2 overexpression in A549 cells versus silencing MCM2 in H1299 cells. MCM2 overexpression and silencing MCM2 are two contrast perturbations, thus we only considered the common regulated phosphoproteins with opposing phosphorylation change pattern in these two phosphoproteomes (Figure 10). The common differentially regulated phosphoproteins identified in both MCM2 overexpression and silencing MCM2 are HIV Tat-specific factor (Ser713), High mobility group protein HMG-I/HMG-Y(Ser99), Calnexin (Ser564), Protein DEK (Ser301, Ser302, Ser303, Ser304), DNA replication licensing factor MCM2 (Ser139, Ser27), Hsc70-interacting protein (Ser79); Putative protein FAM10A4 (Ser75), 28 kDa heat- and acid-stable phosphoprotein (Ser60, Ser63) and Membrane-associated progesterone receptor component 2 (Tyr211). Of these overlapping regulated phosphoproteins, there are only 8 phosphoproteins showed the opposing phosphorylation change pattern in phosphoproteome of MCM2 overexpression and silencing MCM2, which are HTSF1, F10A1/ST134, CALX, DEK, HMGA1, HAP28 and MCM2. PGRC2 showed decreased phosphorylation change in both phosphoproteomes (Table 3).
3.6 Functional annotation of MCM2-regulated phosphoproteins
To further elucidate the biological processes affected by MCM2, we used The Functional Annotation Tool on DAVID v6.7 to facilitate the annotation of up- and down-regulated phosphoproteins in each phosphoproteome. Functional annotation analysis showed that MCM2-overexpressed proteins were involved mainly in RNA splicing, protein folding, regulation of protein complex assembly, regulation of cytoskeleton organization, regulation of actin filament polymerization (Figure 11).
MCM2-silenced proteins were mainly involved in macromolecular complex subunit
20
organization, RNA processing, microtubule-based movement, DNA replication and cell cycle (Figure 12). Functional enrichment analysis showed that the regulated phosphoproteins were enriched in mRNA processing and microtubule-based process (Figure 13). From these analysis results, we inferred that MCM2 might regulate cell cycle and affect cell migration.
3.7 Overexpression of MCM2 in A549 increased cell migration while silencing MCM2 in H1299 cells decreased cell migration
Cell migration ability is closely associated with cancer metastasis. The biological functions enriched in both MCM2 overexpression and silencing MCM2 were regulation of cytoskeleton organization, regulation of actin filament polymerization and microtubule-based movement. To explore the role of MCM2 in cell migration, we performed transwell migration assay to assess the migration ability of MCM2- overexpressed cells and MCM2-silenced cells. MCM2-overexpressed cells show significant (p<0.05) increase in migrated cells as shown in Figure 14 while MCM2- silenced cells show significant decrease (p<0.05) in migrated cells as shown in Figure 15. These results suggested that MCM2 play an important role in cell migration in human lung cancer.
3.8 Silencing MCM2 in H1299 cells induced cell cycle arrest
Based on the results of functional annotation analysis, the differentially regulated phosphoproteins of MCM2 silenced H1299 cells were involved in cell cycle. To investigate whether the effect of cell growth inhibition induced by silencing MCM2 was caused by cell cycle regulations, we used propidium iodide staining and flow cytometry to evaluate whether MCM2 knockdown can interrupt the cell cycle progression in H1299 cells. The G1/S cell cycle arrest means the cell cycle arrests in G1 phase and
21
does not proceed to S phase, resulting increase in the percentage of G1 phase and decrease in percentage of S phase. As shown in Figure 16, the G1 and S phases were 46.46% and 49.47% in control cells, respectively. MCM2 knockdown with 10nM siRNA (si-2 and si-3) resulted in a increase in G1 phase (54.46% and 55.32%) and a decrease in S phase (38.13% and 36.55%) at 48 hours siRNA post-transfection, indicating a G1/S arrest and a DNA synthetic inhibition existed in H1299 cells. The accumulation of cells in G2/M phase was also observed in MCM2-silenced cells (5.41%
and 6.9%) as compared to control cells (3.13%).
3.9 Phosphorylation of HMGA1 at Ser99 is essential for viability
Previous studies showed that the high mobility group protein HMG-I/HMG-Y (HMGA1) is subjected to a number of post-translational modifications. By using mass spectrometry, we observed a common phosphorylation change at Ser99 on HMGA1 in both phosphoproteome of MCM2 overexpression and silencing. The MS/MS spectrum of the phosphopeptide KLEKEEEEGISQESSEEEQ from HMGA1 was showed in Figure 17. The biological significances of this phosphorylation site in lung cancer cells have not been investigated. We performed experiment to see if this phosphorylation site on HMGA1 is important for cell viability. Using the method of site-directed mutagenesis, we constructed two mutants of HMGA1 by substituting serine to non- phosphorylatable alanine (S99A) and phosphomimetic glutamic acid (S99E). The amino acid sequences showing the position to be mutated by substitution was illustrated in Figure 18A. The overexpression level of HMGA1 mutants was assessed by measuring the total HMGA1 protein. Western blot analysis (Figure 18B) showed the HMGA1 wild type and HMGA1 mutants (S99E and S99A) have similar total HMGA1 protein level, indicating that their overexpression efficiency are of the same magnitude. As illustrated
22
in Figure 18C, result revealed that mutation of Ser99 to alanine significantly reduced (
P<0.05)
the cell viability of A549 cells indicating the importance of this residue.23
Chapter 4 DISCUSSION
Cancer is tightly associated with abnormal uncontrolled proliferation. A new perspective of cancer progression proposes that DNA replication stress is induced by sustained proliferation, subsequently causing two other cancer hallmarks, escape from apoptosis and genomic instability.42 Small molecule inhibitors that block uncontrolled cancer proliferation by targeting leading or lagging strand synthesis have been used in cancer therapy, such as topoisomerases, DNA polymerases, DNA ligase, proliferating cell nuclear antigen (PCNA), ribonucleotide reductase, and telomerase.43-47 Eukaryotic replication factors are emerged as potential chemotherapeutic targets in cancer treatment but to date, little is known about the inhibitors targeting MCM proteins, which serve as a licensing factor in replication initiation. MCM2 is well-known for its good association with cell proliferation but its precise functional role in lung cancer cells has not been reported. Understanding the molecular basis of MCM2 in lung cancer cells enables us to discover alternative target for lung cancer therapy.
ZNF322 (Zinc finger protein 322) was isolated from an early human embryo heart cDNA library which encodes a zinc-finger protein containing 9 tandem repeated C2H2 type zinc fingers. Overexpression of ZNF322 increase transcription activities of SRE and AP-1, suggested the role of ZNF322 as transcriptional activator in MAPK signaling pathways.48 From our previous studies, proteomics analysis of ZNF322A in human lung adenocarcinoma cells A549 using Isobaric tags for relative and absolute quantitation (iTRAQ) identified several candidate proteins that are regulated by ZNF322A.49MCM2 is one of the candidate proteins that are up-regulated by ZNF322A and their regulation relationship was validated by western blot analysis.
24
In the present study, we explored the role of MCM2 in lung cancer cells. We first evaluated the endogenous expression of MCM2 in NSCLC cell lines A549 and H1299.
Western blotting demonstrated that H1299 cells showed higher level of endogenous MCM2 protein as compared to A549 cells. Cell viability analysis showed that MCM2 overexpression promotes cell proliferation in A549 cells and silencing MCM2 inhibits cell proliferation in H1299 cells. This is consistent with the essential role of MCM2 in cellular proliferation. Aberrant protein phosphorylation is often correlated with diseases.50,51 To better elucidate the post-translational events and to reveal the regulatory networks behind these effects, we set up a large-scale mass spectrometry- based quantitative phosphoproteomics study of MCM2 using HAMMOC-TiO2 phosphopeptide enrichment strategies. We compared the differential regulation of phosphorylated proteins in the NSCLC cell lines A549 and H1299 cells in response to MCM2 overexpression and silencing MCM2 respectively. Phosphoproteomic analysis using two different cell lines would provide a more comprehensive profiling of MCM2 downstream events. Surprisingly, our results show that nearly all phosphosites are uniquely response to MCM2 overexpression or silencing MCM2, respectively. There is only a small overlap in differentially regulated phosphosites between the two phosphoproteomes, suggesting that MCM2 downstream regulations are cell-type dependent.
Bioinformatic analysis showed that the regulated phosphoproteins from both phosphoproteome are enriched most in biological functions such as RNA splicing, protein folding, regulation of protein complex assembly, regulation of cytoskeleton organization, regulation of actin filament polymerization, macromolecular complex subunit organization, microtubule-based movement, DNA replication and cell cycle.
25
RNA has been linked to cancer-related functions in which defects in alternative splicing lead to various human diseases, primarily neurodegenerative diseases and cancer.52 Cancer cells with aberrant splicing profiles expressing isoforms that can promote cell proliferation, survival, migration and invasion, affect metabolism and in general involved in any aspect of tumor progression and maintenance.53 It has been also reported that MCM2 involved in regulation of cell migration and invasion in medulloblastoma.54 Not surprisingly, increased cell migration ability induced by MCM2 overexpression in A549 cells and reduced cell migration ability upon MCM2 knockdown in H1299 cells were observed in our study. Previous studies demonstrated that knockdown of MCM2 led to cell cycle arrest and cell apoptosis in colon cancer cells (HCT116) and NSCLCs (A549 and GLC-82).20,21 Our data from flow cytometric analysis indicated that silencing MCM2 in p53 null cell line H1299 induces cell cycle arrest in G1/S phase may result from a p53-independent pathway.
Phosphorylation of MCM2 occurs at multiple sites which resulted in a conformational change of the complex and activation of the helicase activity is essential for the initiation of DNA replication in human. Previous studies reported that three sites Ser40, Ser53 and Ser108 on MCM2 have been identified as Cdc7/Dbf4 phosphorylation sites in HeLa cells.55 The Ser108 site was found to be the site of phosphorylation by ATR in the presence of DNA damage.56 Furthermore, the Ser27, Ser41 and Ser139 sites have been identified as major Cdc7 phosphorylation sites in vitro and in HeLa cells confirming Ser139 as a Cdc7 phosphorylation site.57 Perturbations of MCM2 protein in cancer cells by overexpression or suppression would probably induce changes in phosphorylation level of MCM2, thereby alter the process of initiation of DNA replication. Our data identified four sites (Ser26, Ser27, Ser108 and Ser 139) on MCM2
26
itself to be differentially phospho-regulated and all of these sites have been reported previously. Of these phosphosites, Ser108 is identified only in A549 cells upon MCM2 overexpression while Ser26 is identified only in H1299 cells upon silencing MCM2.
The discrepancies of MCM2 phosphorylation sites between the two phosphoproteomes may due to the differences of cell lines used and the differences of perturbation to cell lines.
High mobility group (HMG) proteins are the most abundant non-histone chromatin associated proteins. The HMG proteins are categorized into three families based on their DNA binding domains: HMGA (containing AT-hooks), HMGB (containing HMG- boxes) and HMGN (containing nucleosomal binding domains).58,59 High mobility group A (HMGA) proteins bind the minor groove of AT-rich DNA sequences through three N-terminal basic domains called “AT-hooks”. The HMGA family consists of four members: HMGA1a, HMGA1b and HMGA1c (which are encoded through alternative splicing by the HMGA1 gene) and HMGA2 (encoded by the HMGA2gene).60,61 Recent study reported that elevated expression of HMGA1 correlates with the malignant status and prognosis of non-small cell lung cancer.62 HMGA1 protein is highly regulated by post-translational modifications, such as acetylation, methylation and phosphorylation.
Nearly all of HMGA1a and HMGA1b proteins are constitutively phosphorylated at the two or three serine occurred predominantly at the residues of the C-terminal peptide 88- 106, a region known to be critical for HMGA1-DNA contact.63,64 HMGA1 phosphorylation reduced DNA-binding activity of HMGA1 whereas protein dephosphorylation increases HMGA1-DNA binding affinity, resulted in gene repression or activation.65,66 Constitutive and inducible phosphorylation at serine residues Ser98, Ser101 and Ser102 has been reported to be dependent on PI-3K via a casein kinase 2
27
(CK2)-like specificity.64,66 HMGA1, specifically the HMGA1a isoform has proposed as a novel downstream target of the INSR signaling pathway, which may play an important role in the regulation of insulin signaling and action in vivo.67 In our phosphoproteome of MCM2 overexpression, tri-phosphorylated HMGA1 protein (Ser99, Ser102 and Ser103) was detected in A549 cells after 24 hours MCM2 overexpression but only the phosphosite of Ser99 show the significant increase in phosphorylation level. In phosphoproteome of silencing MCM2, a significant decrease of the tri-phosphorylated HMGA1 protein (Ser99, Ser102 and Ser103) was detectable in H1299 cells at 48 hours siMCM2 post-transfection. Interestingly, phosphorylated HMGN1 protein (Non-histone chromosomal protein HMG-14) at phosphosites of Ser86 and Ser89 was detected upon MCM2 overexpression but not in silencing MCM2. The phosphosite of Ser99 on HMGA1 was found to be differentially up-regulated upon MCM2 overexpression and differentially down-regulated upon silencing MCM2, thus is presented as a novel candidate for phosphoproteomics analysis. To further investigate the biological significances of HMGA1 phosphorylation at Ser99, we examined the cell viability of HMGA1 phosphorylation site mutants expressed in A549 cells. Our study showed that mutation of Ser99 to alanine significantly decreased cell viability of A549 cells, suggesting that phosphorylation of Ser99 of HMGA1 may play important roles in cancer proliferation. The function of this phosphorylation site is yet clearly understood.
Future studies are needed to clarify the importance of HMGA1 phosphorylation in lung cancer study which might result in a profound impact on lung cancer treatment.
28
Chapter 5 CONCLUSION
Mass spectrometry-based quantitative phosphoproteomics allowed identification of hundreds or thousands of phosphorylation sites in single experiment with quantitative information of phosphorylation sites. We investigated the phosphorylation events regulated by MCM2 in response to MCM2 overxepression and silencing MCM2 in human lung cancer cells. We evaluated the phosphoproteome data, inferred the gene ontology biological processes, identified key phosphoproteins for downstream analysis and performed functional analysis. We identified 1484 phosphorylation sites in 593 phosphoproteins of MCM2-overexpressed A549 cells and 1599 phosphorylation sites in 592 phosphoproteins of MCM2-silenced H1299 cells. Bioinformatics analysis demonstrated that the differentially regulated phosphoproteins were enriched in RNA splicing, cell cycle and cytoskeleton regulation. Functional analysis showed that MCM2 regulated several biological processes such as cell proliferation, cell migration and cell cycle. Furthermore, we found that phosphorylation site of Ser99 on HMGA1 is important for cell viability in lung cancer cells. This study helps to elucidate the role of MCM2 in regulation of biological processes in lung cancer cells which may contribute to cancer therapy development.
29
Chapter 6 FUTURE WORK
First, we attempt to validate the phosphorylation status of HMGA1 induced by MCM2 in lung cancer cells. Since the phospho-specific antibody for HMGA1are not available in market so far, we could not detect the phosphorylation of HMGA1 by western blot.
Both the MCM2-overexpressed A549 cells and MCM2-silenced H1299 cells showed the differential phosphorylation level of the phosphosites of Ser99 on HMGA1, indicating the important link between MCM2 and HMGA1 phosphorylation.
Phosphorylation of HMGA1 and its relevance to MCM2 needs substantial evidences and should be investigated in detail.
Second, it is still unclear that which specific pathway is induced by MCM2 to affect the biological processes such as cell proliferation, cell migration and cell cycle in human lung cancer cells. Future studies are needed to elucidate the molecular pathway regulating these biological processes in order to clarify the role of MCM2 in lung cancer cells.
Third, the western blot analysis showed that p53 is correlated with MCM2 but we did not know how exactly the p53 regulates MCM2. More experimental validations are needed to prove the relationship between p53 and MCM2 at transcriptional level.
30
ABBREVIATION
13CD2O 20% formaldehyde-13C, d2 solution ACN acetonitrile
CH2O 37% formaldehyde solution DMSO dimethyl sulfoxide
DTT dithiothreitol FDR false discovery rate
FDR false discovery rate
GO gene ontologyGO gene ontology
HAMMOC hydroxy acid-modified metal oxide chromatography IAM iodoacetamide
iTRAQ isobaric tags for relative and absolute quantitation LC-MS/MS liquid chromatography-tandem mass spectrometry LTQ linear Trap Quadrupole
LysC Lysyl endopeptidase
MTS 3-(4,5-dimethylthiazol-2-yl)-5-(3-carboxymethoxyphenyl)-2-(4-sulfophenyl)-2H- tetrazolium, inner salt
MTT 3(4,5-dimethylthiazol-2-yl)-2,5-diphenyltetrazolium bromide NaBH3CN sodium cyanoborohydride
PBS phosphate-buffered saline PI propidium iodide
PMS phenazine methosulfate
31
PTS phase-transfer surfactants PVDF polyvinylidene difluoride
SCX strong cation exchange chromatography SDB-XC polyStyrenedivinyl- benzene
SDC sodium deoxycholate
SDS-PAGE sodium dodecyl sulfatepolyacrylamide gel electrophoresis Ser serine
shRNA short hairpin RNA siRNA small interfering RNA SLS sodium lauroyl sarcosine StageTip Stop-and-go-extraction tip TEABC triethylammonium bicarbonate TFA trifluoroacetic Acid
Thr threonine TiO2 titanium dioxide Tyr tyrosine
32
REFERENCES
(1) Siegel, R.; Ma, J.; Zou, Z.; Jemal, A., Cancer statistics, 2014. CA Cancer J. Clin.
2014, 64 (1), 9-29.
(2) Wang, B. Y.; Huang, J. Y.; Cheng, C. Y.; Lin, C. H.; Ko, J. L.; Liaw, Y. P., Lung Cancer and Prognosis in Taiwan: A Population-Based Cancer Registry. J. Thorac.
Oncol. 2013, 8 (9), 1128-1135.
(3) Minna, J. D.; Roth, J. A.; Gazdar, A. F., Focus on lung cancer. Cancer Cell 2002, 1 (1), 49-52.
(4) Evrin, C.; Clarke, P.; Zech, J.; Lurz, R.; Sun, J.; Uhle, S.; Li, H.; Stillman, B.;
Speck, C., A double-hexameric MCM2-7 complex is loaded onto origin DNA during licensing of eukaryotic DNA replication. Proc. Natl. Acad. Sci. U S A 2009, 106 (48), 20240-20245.
(5) Remus, D.; Beuron, F.; Tolun, G.; Griffith, J. D.; Morris, E. P.; Diffley, J. F., Concerted loading of Mcm2-7 double hexamers around DNA during DNA replication origin licensing. Cell 2009, 139 (4), 719-730.
(6) Gambus, A.; Jones, R. C.; Sanchez-Diaz, A.; Kanemaki, M.; van Deursen, F.;
Edmondson, R. D.; Labib, K., GINS maintains association of Cdc45 with MCM in replisome progression complexes at eukaryotic DNA replication forks. Nat. Cell Biol.
2006, 8 (4), 358-366.
(7) Ilves, I.; Petojevic, T.; Pesavento, J. J.; Botchan, M. R., Activation of the MCM2-7 helicase by association with Cdc45 and GINS proteins. Mol. Cell 2010, 37 (2), 247-258.
33
(8) Moyer, S. E.; Lewis, P. W.; Botchan, M. R., Isolation of the Cdc45/Mcm2-7/GINS (CMG) complex, a candidate for the eukaryotic DNA replication fork helicase. Proc.
Natl. Acad. Sci. U S A 2006, 103 (27), 10236-10241.
(9) Lei, M.; Tye, B. K., Initiating DNA synthesis: from recruiting to activating the MCM complex. J. Cell Sci. 2001, 114 (8), 1447-1454.
(10) Kearsey, S. E.; Maiorano, D.; Holmes, E. C.; Todorov, I. T., The role of MCM proteins in the cell cycle control of genome duplication. Bioessays 1996, 18 (3), 183- 190.
(11) Burger, M., MCM2 and MCM5 as Prognostic Markers in Colon Cancer: A Worthwhile Approach. Dig. Dis. Sci. 2009, 54 (2), 197-198.
(12) Liu, M.; Li, J. S.; Tian, D. P.; Huang, B.; Rosqvist, S.; Su, M., MCM2 expression levels predict diagnosis and prognosis in gastric cardiac cancer. Histol. Histopathol.
2013, 28 (4), 481-492.
(13) Wojnar, A.; Kobierzycki, C.; Krolicka, A.; Pula, B.; Podhorska-Okolow, M.;
Dziegiel, P., Correlation of Ki-67 and MCM-2 proliferative marker expression with grade of histological malignancy (G) in ductal breast cancers. Folia Histochem.
Cytobiol. 2010, 48 (3), 442-446.
(14) Meng, M. V.; Grossfeld, G. D.; Williams, G. H.; Dilworth, S.; Stoeber, K.;
Mulley, T. W.; Weinberg, V.; Carroll, P. R.; Tlsty, T. D., Minichromosome maintenance protein 2 expression in prostate: Characterization and association with outcome after therapy for cancer. Clin. Cancer Res. 2001, 7 (9), 2712-2718.
(15) Tan, D. F.; Huberman, J. A.; Hyland, A.; Loewen, G. M.; Brooks, J. S.; Beck, A.
F.; Todorov, I. T.; Bepler, G., MCM2--a promising marker for premalignant lesions of the lung: a cohort study. BMC Cancer 2001, 1, 6.
34
(16) Yang, J.; Ramnath, N.; Moysich, K. B.; Asch, H. L.; Swede, H.; Alrawi, S. J.;
Huberman, J.; Geradts, J.; Brooks, J. S.; Tan, D., Prognostic significance of MCM2, Ki- 67 and gelsolin in non-small cell lung cancer. BMC Cancer 2006, 6, 203.
(17) Simon, N. E.; Schwacha, A., The Mcm2-7 Replicative Helicase: A Promising Chemotherapeutic Target. BioMed Res. Int. 2014, 2014, 549719.
(18) Kunnev, D.; Rusiniak, M. E.; Kudla, A.; Freeland, A.; Cady, G. K.; Pruitt, S. C., DNA damage response and tumorigenesis in Mcm2-deficient mice. Oncogene 2010, 29 (25), 3630-3638.
(19) Pruitt, S. C.; Bailey, K. J.; Freeland, A., Reduced Mcm2 expression results in severe stem/progenitor cell deficiency and cancer. Stem Cells 2007, 25 (12), 3121-3132.
(20) Liu, Y.; He, G.; Wang, Y.; Guan, X.; Pang, X.; Zhang, B., MCM-2 is a therapeutic target of Trichostatin A in colon cancer cells. Toxicol. Lett. 2013, 221 (1), 23-30.
(21) Zhang, X.; Teng, Y.; Yang, F.; Wang, M.; Hong, X.; Ye, L. G.; Gao, Y. N.; Chen, G. Y., MCM2 is a therapeutic target of lovastatin in human non-small cell lung carcinomas. Oncol. Rep. 2015, 33 (5), 2599-2605.
(22) Hubbard, M. J.; Cohen, P., On target with a new mechanism for the regulation of protein phosphorylation. Trends Biochem. Sci. 1993, 18 (5), 172-177.
(23) Sano, A.; Nakamura, H., Chemo-affinity of titania for the column-switching HPLC analysis of phosphopeptides. Anal. Sci. 2004, 20 (3), 565-566.
(24) Haydon, C. E.; Eyers, P. A.; Aveline-Wolf, L. D.; Resing, K. A.; Maller, J. L.;
Ahn, N. G., Identification of novel phosphorylation sites on Xenopus laevis Aurora A and analysis of phosphopeptide enrichment by immobilized metal-affinity chromatography. Mol. Cell Proteomics 2003, 2 (10), 1055-1067.
35
(25) Ficarro, S. B.; McCleland, M. L.; Stukenberg, P. T.; Burke, D. J.; Ross, M. M.;
Shabanowitz, J.; Hunt, D. F.; White, F. M., Phosphoproteome analysis by mass spectrometry and its application to Saccharomyces cerevisiae. Nat. Biotechnol. 2002, 20 (3), 301-305.
(26) Ndassa, Y. M.; Orsi, C.; Marto, J. A.; Chen, S.; Ross, M. M., Improved immobilized metal affinity chromatography for large-scale phosphoproteomics applications. J. Proteome Res. 2006, 5 (10), 2789-2799.
(27) Ballif, B. A.; Villen, J.; Beausoleil, S. A.; Schwartz, D.; Gygi, S. P., Phosphoproteomic analysis of the developing mouse brain. Mol. Cell. Proteomics 2004, 3 (11), 1093-1101.
(28) Beausoleil, S. A.; Jedrychowski, M.; Schwartz, D.; Elias, J. E.; Villen, J.; Li, J.;
Cohn, M. A.; Cantley, L. C.; Gygi, S. P., Large-scale characterization of HeLa cell nuclear phosphoproteins. Proc. Natl. Acad. Sci. U S A 2004, 101 (33), 12130-12135.
(29) Kokubu, M.; Ishihama, Y.; Sato, T.; Nagasu, T.; Oda, Y., Specificity of immobilized metal affinity-based IMAC/C18 tip enrichment of phosphopeptides for protein phosphorylation analysis. Anal. Chem. 2005, 77 (16), 5144-5154.
(30) Larsen, M. R.; Thingholm, T. E.; Jensen, O. N.; Roepstorff, P.; Jorgensen, T. J. D., Highly selective enrichment of phosphorylated peptides from peptide mixtures using titanium dioxide microcolumns. Mol. Cell. Proteomics 2005, 4 (7), 873-886.
(31) Kweon, H. K.; Hakansson, K., Selective zirconium dioxide-based enrichment of phosphorylated peptides for mass spectrometric analysis. Anal. Chem. 2006, 78 (6), 1743-1749.
36
(32) Wolschin, F.; Wienkoop, S.; Weckwerth, W., Enrichment of phosphorylated proteins and peptides from complex mixtures using metal oxide/hydroxide affinity chromatography (MOAC). Proteomics 2005, 5 (17), 4389-4397.
(33) Sugiyama, N.; Masuda, T.; Shinoda, K.; Nakamura, A.; Tomita, M.; Ishihama, Y., Phosphopeptide enrichment by aliphatic hydroxy acid-modified metal oxide chromatography for nano-LC-MS/MS in proteomics applications. Mol. Cell. Proteomics
2007, 6 (6), 1103-1109.
(34) Hsu, J. L.; Huang, S. Y.; Chow, N. H.; Chen, S. H., Stable-isotope dimethyl labeling for quantitative proteomics. Anal. Chem. 2003, 75 (24), 6843-6852.
(35) Ku, W.-C.; Sugiyama, N.; Ishihama, Y., Large-Scale Protein Phosphorylation Analysis by Mass Spectrometry-Based Phosphoproteomics. In T Protein Kinase
Technologies, 2012; Vol. 68, pp 35-46.
(36) Olsen, J. V.; de Godoy, L. M.; Li, G.; Macek, B.; Mortensen, P.; Pesch, R.;
Makarov, A.; Lange, O.; Horning, S.; Mann, M., Parts per million mass accuracy on an Orbitrap mass spectrometer via lock mass injection into a C-trap. Mol. Cell. Proteomics
2005, 4 (12), 2010-2021.
(37) Vogelstein, B.; Lane, D.; Levine, A. J., Surfing the p53 network. Nature 2000, 408 (6810), 307-310.
(38) Bougeard, G.; Hadj-Rabia, S.; Faivre, L.; Sarafan-Vasseur, N.; Frebourg, T., The Rapp-Hodgkin syndrome results from mutations of the TP63 gene. Eur. J. Hum. Genet.
2003, 11 (9), 700-704.
(39) Cox, J.; Mann, M., MaxQuant enables high peptide identification rates, individualized p.p.b.-range mass accuracies and proteome-wide protein quantification.