國立臺灣大學生物資源暨農學院食品科技研究所 碩士論文
Institute of Food Science and Technology College of Bio-Resources and Agriculture
National Taiwan University Master Thesis
以基因體層面探討天麻水萃物之抗憂鬱功效 Transcriptomic Profile of the Anti-Depressant Effects of
Gastrodia elata Bl.
陳德育 Eric TeYu Chen
指導教授:沈立言 博士 Advisor: Lee-Yan Sheen, Ph.D.
中華民國 101 年 1 月
January 2012
謝誌
兩年的研究生涯終於到了尾聲。曾聽人說很多老師收到學生的碩士論文都只 看「謝誌」頁,如果在謝誌頁中沒有找到自己的名字,就會直接把那本論文丟了。
然而,這本論文的產生要感謝的人實在太多了。首先要感謝指導教授沈立言老師 對於研究生的無比包容以及讓學生們放手一搏的信任,使得我學會了研究及待人 處事的精隨。特別要感謝沈老師總在百忙之中能抽空與研究生討論,給予研究上 的建議以及論文的指正,並關心學生們的進度。再來要感謝台灣大學生物科技研 究所蔡孟勳老師在微陣列分析上的分析架構與本論文的細心指導及審閱,以及生 技所的學長姐們,尤其是政瑩和逄昌學長,對於分子生物實驗技術上的耐心指導。
感謝台灣大學心理系的賴文崧老師以及中國醫藥大學精神科醫生蘇冠賓主任給予 本論文相當多的指正與建議,使得本論文更臻完善。特別感謝中央研究院的坤海 和誼寧學長在微陣列分析的操作上給予無比耐心的指導。
再來要感謝食品科技所的謝淑貞老師在研究方法上給予相當多寶貴的建議,
以及在研究路途上賦予莫大的精神支柱。感謝食品科技研究所游若萩所長對於我 在學術活動上的籌備以及主持大會能力給予肯定。再來要感謝研究室內的前輩,
同學,及學弟妹們在我研究生生涯中賦予的鼓勵,關懷,與協助,其中包括學姐 們:佩茹、曉琪、碩菲、麗雲、燕雯、廷茹,學長們:與國、正元、承偉、永麟、
俊霆、文賢、俊宏、冠宏,同學:美樺、包容、威成、奕瑄、以及學弟妹:世航、
育正、品如、靜儀、美伶、巧憶、于淨、及惠君。最後要感謝我的家人在我研究 路途上的精神鼓勵與全力支持,讓我能無後顧之憂的完成學位。
若沒有各位老師、前輩、同學、家人的協助與支持,本研究結晶並不會產生。
本人在此獻上最大的致意給所有幫助過我的人!
陳德育 謹誌於 台灣大學食品科技研究所 中華民國一百零一年 一
I
Abbreviations
ACTB: ß-actin
BDNF: Brain Derived Neurotrophic Factor bw: body weight
CNS: central nervous system Ct: : cycle threshold
ECT: electroconvulsive Treatment FST: Forced Swimming Test GABA: γ- AminoButyric Acid GEB: Gastrodia elata bl.
KEGG : Kyoto Encyclopedia of Genes and Genomes MAOI: monoamine oxidase inhibitor
MAP: microtubule associated proteins
MAPK: microtubule associated protein kinase
QRT-PCR: quantitative reverse transcriptase-polymerase chain reaction SSRI: serotonin reuptake inhibitor
TRK: tyrosine kinase
WGE: water extraction of Gastrodia elata Bl.
Abstract
Depression has been a serious issue, as the annual worldwide reported cases of depression have been constantly increasing, according to the statistics published by WHO. In fact, WHO predicts that it will be the leading psychological disease by year 2020. However, antidepressants generally demonstrate serious side-effects, such as anxiety disorders, gastrointestinal problems, and sexual dysfunction in patients;
therefore, it is important to find an effective way to prevent the occurrence of depression. In this research, Gastrodia eleta Bl., an Oriental herb that has been shown to demonstrate anti-depression effects, was investigated in the form of water extraction. In the present study, the water extract of Gastrodia eleta Bl. (WGE) was orally administered to Sprague-Dawley rats at the dose of 0.5 g/kg BW each day for 21 consecutive days. Forced swimming test (FST) was performed to induce depression in the rodent model, and results showed that the WGE group demonstrated shorter immobile time compared to the negative control group, indicating that FST has successfully induced depression-like behaviours in these rats. Total mRNA samples were then obtained from the frontal cortex, hippocampus, and striatum, after having sacrificed the rats after 21 days. In order to deduce a possible anti-depression pathway at the genomic level, cDNA microarray was performed to generate gene expression profiles of depression relevant brain regions: cortex, hippocampus, and striatum. To confirm the findings, real-time polymerase chain reaction (QRT-PCR) analysis of several neuroplasticity-related, differentially expressed genes, was performed. The microarray data showed that WGE altered axongenesis/neurogenesis, nervous system development, and dopamine secretion pathways in cortex and hippocampus, from the evidence that they yield the lowest p-values from all other pathway matches with the
III
KEGG database. However, there were no depression-related pathways shown in the results of the microarray data for the striatum. QRT-PCR results validated that genes involved in neurogenesis, such as Map1b, RhoA, profilin-1, and CRMP2 were significantly altered (p < 0.05) in the cortex and hippocampus. Therefore, neuroplasticity might be the mechanism that WGE takes. The neuroplasticity effects of WGE in the rodent model of antidepressant action strengthen the case for further testing the results in the same context using other tools, and can serve as the basis of future antidepressant drugs, especially in the area of WGE demonstrating anti-depressant effects in the aspect of genomics.
Keywords: depression; forced swimming test; Gastrodia elata Bl.; microarray analysis;
neuroplasticity
摘要
憂鬱症是精神疾病中盛行率極高的情感性疾病,並且根據 WHO 公佈的統計顯示,
全球憂鬱症患者逐年攀升,並且將會在 2020 年成為精神疾病之首。由於目前抗憂 鬱劑治療方式會帶給許多病人嚴重的副作用,例如焦慮,腸胃問題,以及性功能 衰減。因此如何預防憂鬱症是個重要的課題。本研究應用中藥食療預防醫學探討 天麻水萃物對大鼠情感相關腦組織之影響,如前額葉皮質,海馬迴,以及紋狀體。
本 研 究 以 管 餵 的 方 式 將 0.5 g/kg BW 劑 量 之 天 麻 水 萃 物 (WGE) 給 予 Sprangue-Dawley 大鼠,每日一次並為期連續 21 天,並進一步利用強迫游泳試驗 (FST) 來誘導憂鬱症。研究結果顯示,天麻水萃物試驗組 (WGE) 的大鼠在 FST 中 比控制組 (NE) 的老鼠取得有顯著性差異較低的不活動時間,顯示 FST 有成功的 誘導大鼠憂鬱症行為。在 21 天試驗期結束後,將大鼠犧牲,並取得前額葉皮質,
海馬迴,紋狀體等憂鬱症相關之大腦區域組織,接著萃取 total mRNA. 進一步利 用微陣列分析來探討可能的天麻抗憂鬱機制,並運用即時聚合酶鏈式反應來驗證 實驗結果。微陣列分析結果顯示在大鼠前額葉皮質以及海馬迴中,axongenesis, neurogenesis, nervous system development, 以 及 多 巴 胺 分 泌 (dopamine
secretion) 為最有可能的機制,根據與資料庫的資料比對後取得的p-value 值大
小排列,最有可能的機制為最小的數值。然而紋狀體的微陣列分析結果並沒有顯 式與憂鬱症有關的機制。即時聚合酶鏈式反應實驗結果驗證了 WGE 確實有顯著性 的提升與神經可塑性 (neuroplasticity) 相關的基因表現量, 如 Map1b,RhoA, profilin-1, 以及 CRMP2 (p < 0.05).因此,神經可塑性為天麻水萃物之可能的 抗憂鬱機制。本研究結果可為未來同一試驗模式但不同體系之研究做為參考,並 為未來抗憂鬱製藥的研究有所貢獻,尤其是中藥天麻在基因體學中之抗憂鬱研究 領域。
關鍵字:憂鬱症,強迫游泳試驗,天麻水萃物,微陣列分析,神經可塑性
V
Table of Contents
ABBREVIATIONS………...I ABSTRACT (CHINESE)………..…II ABSTRACT (ENGLISH)……….………IV TABLE OF CONTENTS……….….V LIST OF TABLES………... VI LIST OF FIGURES……….……….VII.
Chapter 1: INTRODUCTION………1
Chapter 2: LITERATURE REVIEW……… 3
Chapter 3: PURPOSE OF STUDY……….. 17
Chapter 4: EXPERIMENTAL FRAMEWORK………... 18
Chapter 5: MATERIALS AND METHODS……… 19
Section 1: Experimental Materials………... 19
Section 2: Experimental Methods……….20
5.2.1: Sample preparation and dosage……….20
5.2.2: Animals and treatments……….…20
5.2.3: Weight change and food intake……….21
5.2.4: Forced swimming test………...21
5.2.5: Tissue dissection………...22
5.2.6: RNA extraction, purification, and quality control………22
5.2.7: Microarray………....23
5.2.8: Microarray data analysis………..25
5.2.9: QPCR………...27
5.2.10: Statistical analysis……… .30
Chapter 6: RESULTS………..31
Chapter 7: DISCUSSION………....73
Section 1: Effect of Gastrodia elata Bl. on weight change and food intake...73
Section 2: Effect of Gastrodia elata Bl. on rodents’ performance in FST………74
Section 3: Advantages and disadvantages of microarray analysis………76
Section 4: Microarray analysis on the potential mechanism in the cortex………77
Section 5: Microarray analysis on the potential mechanism in hippocampus…...78
Section 6: Microarray analysis on the potential mechanism in the striatum…….78
Section 7: Neurogenesis, neuroplasticty, neurotransmitters, antidepressants, and depression………79
Section 8: Overall discussion………84
Chapter 8: CONCLUSION………...85
Chapter 9: REFERENCES………...86
VII
List of Tables
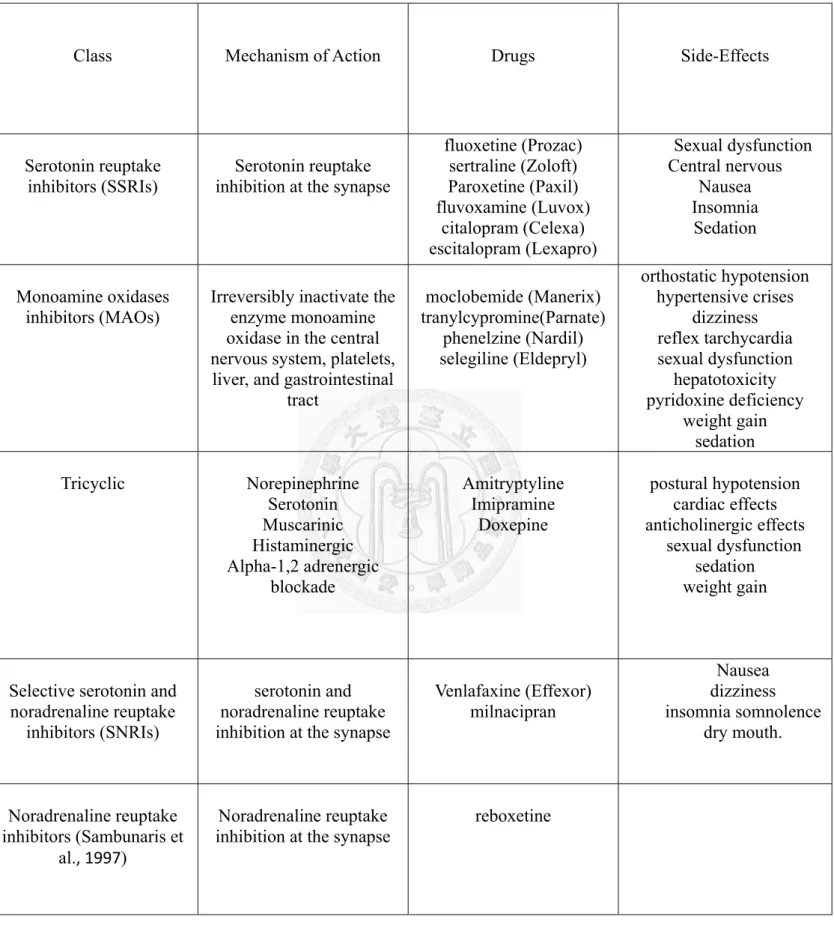
Table 1. Summary of side-effects of different classes of antidepressants…………8
Table 2. List of primers……….27
Table 3. Gene list of significant genes regulated by WGE in the frontal cortex…..40
Table 4. Table of possible KEGG pathways of genes regulated by WGE in the frontal cortex………..45
Table 5. Gene list of significant genes regulated by WGE in the hippocampus…..49
Table 6. Table of possible KEGG pathways of genes regulated by WGE in the hippocampus……….…..60
Table 7. Gene list of significant genes regulated by WGE in the striatum………...65
Table 8. Table of possible KEGG pathways of genes regulated by WGE in the striatum………...69
List of Figures
Figure 1. Image of dentritic structure under stress….….………...11
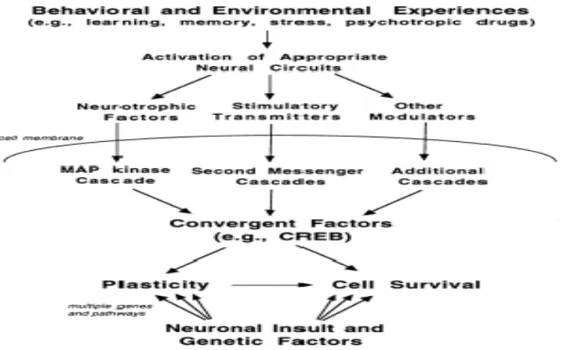
Figure2. Genomics of antidepressants and neuroplasticity………12
Figure 3. Genomics of antidepressants, neuroplasticity, and neurotransmitters…..…..13
Figure 4. Genomics of neuroplasticity and environmental stimulators…...14
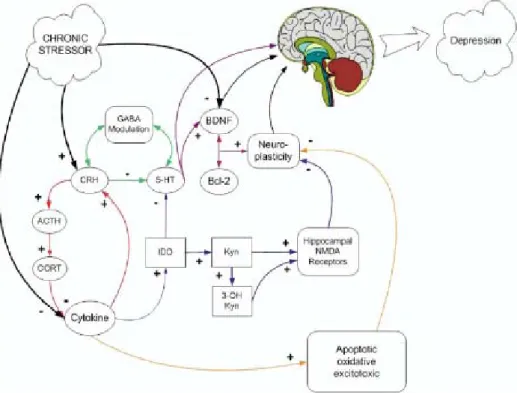
Figure 5. Overview of pathology of depression……….15
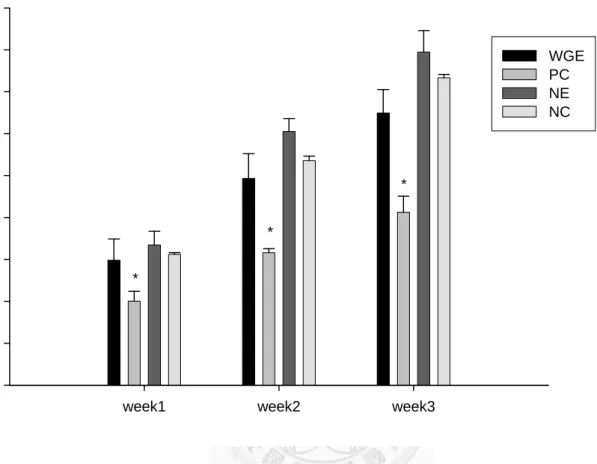
Figure 6. Effect of WGE on weight change of rats………33
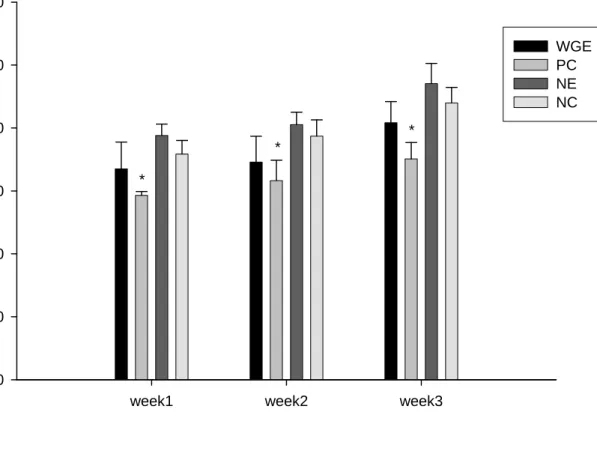
Figure 7. Effect of WGE on food intake of rats……….34
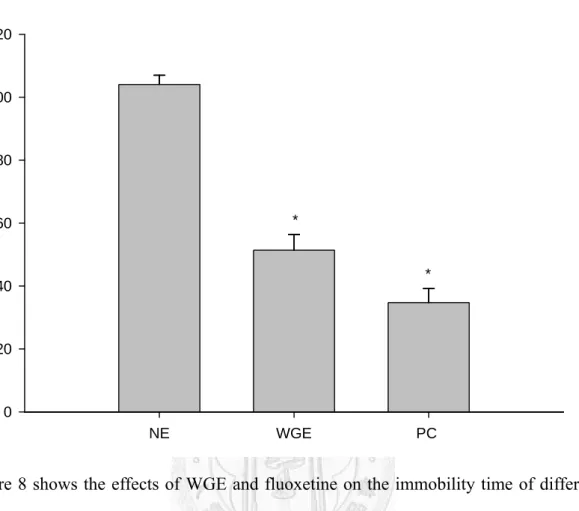
Figure 8. Effect of WGE on FST performance………..35
Figure 9. Normalized data of microarray analysis……….36
Figure 10. Principal component analysis of normalized microarray data………..37
Figure 11. Venn diagram of significant genes in cortex……….38
Figure 12. Heatmap of significant genes in cortex……….44
Figure 13 Network analysis of significant genes in cortex………47
Figure 14. Venn diagram of significant genes in hippocampus……….48
Figure 15. Heatmap of significant genes in hippocampus……….58
Figure 16. Network analysis of significant genes in hippocampus………62
Figure 17. Venn diagram of significant genes in striatum………..64
Figure 18. QPCR results of neurogenesis-related genes in cortex……….71
Figure 19. QPCR results of neurogenesis-related genes in hippocampus………..72
IX
Transcriptomic Profile of the Anti-Depressant Effects of
Gastrodia elata Bl.
1 Introduction
Depression is a prevalent psychiatric disease, and its prevalence is approximately 20% in females and 10% in males of the global population, according to the statistics of WHO using DALY (Disability-adjusted life year) as the indicator (WHO, 2008). In fact, it was estimated that depression will be the 2nd highest global burden of disease among all the illnesses in 2010, using DALY as the indicator (Thase, 2005). In addition, the suicide rate of depressed patients is 20.4 to 30 times higher than the normal people in the general world population (Terra, 2008). Also, it has been estimated that approximately 87.1% of the suicide victims in Eastern Taiwan suffered from depression (Cheng, 1995). Unfortunately, depression patients do not receive medical treatments aggressively. In Taiwan, 4 to 5% of the population has been diagnosed with depression, but many of them do not receive medical treatments and the number of patients receiving treatments is not increasing (Hwu et al., 1989).
The low rate of depression patients receiving medical treatment is because of the potential side effects of the medication, such as anorexia (Brambilla et al., 2005) or a decreased desire in sexual behavior (Clayton et al., 2006). In addition, electro- convulsive test, the most effective treatment for depression, can cause temporary anemia as its major adverse effect (Datto, 2000), although it does not lead to brain tissue damage (Agelink et al., 2001). Therefore, it is crucial to look for an alternative therapy to prevent the patient from developing depression. Gastrodia elata Bl. (GEB), also known as Tian Ma, has been discovered to have anti-depression effects. There is no evidence of GEB causing side-effects yet, neither has any previous research on GEB’s antidepressant effects on screening for a particular mechanism at the genomic level.
2
Depression can be caused by several factors, including neurotransmitters, monoamines, oxidative stress, and neuroplasticity (Hayley et al., 2005). Since there could be many mechanisms that would lead to depression, a specific, possible mechanism was to be deduced for the effects of WGE on the depressed animals. Microarray is a powerful, high throughput screening tool as it can study the whole genome in the established gene bank simultaneously (22,523 genes from the gene bank of rats in this study), as opposed to traditional molecular biology tools such as Northern blotting that could only study one gene at a time.
In this research, the anti-depression effects of GEB were investigated at the genomics level by cDNA microarray analysis and real-time PCR on forced swimming induced Sprague-Dawley rats. Results showed that WGE does not cause significant adverse-effect, specifically weight loss, on the rats. The WGE group displayed a lower immobility time, indicating that depression was successfully induced in the rodents.
Neuroplasticity, as one of the possible mechanisms by which WGE affects the depressed animals, was acquired by pathway analysis software and were validated by QRT-PCR.
Genes involved in neurogenesis and neuroplasticity, such as Map1b, RhoA, profilin-1, and CRMP2 were significantly altered (p < 0.05) in the cortex and hippocampus.
Therefore, neuroplasticity might be our interested mechanism. In this thesis, a preliminary discovery of neuroplasticity has been achieved solely based on the microarray data, with a partial validation of QPCR, only on the neuroplasticity-related genes. A closer investigation involving tissue staining of neurons will be performed to validate neurogenesis being the mechanism.
2 Literature Review
2.1 What is depression?
Depression is a psychological disorder that greatly affects social behavior of an individual, such as work performance and social relationships. There are many forms of depression, including unipolar and bipolar.
2.2 Depression symptoms
The diagnosis of depression and other mood disorders is based on symptoms shown on patients in clinical studies. The common ways of classification are International Classification of Disease (ICD) and Diagnostic and Statistical Manual of Mental Disorders, 4th edition, DSM-IV (Diagnostic and Statistical Manual of Mental Disorders, Fourth Edition (DSM-IV).
For example, symptoms of major depressive disorder (MDD), based on the DSM-IV system include the following:
depressed mood (such as feelings of sadness or emptiness)
reduced interest in activities that used to be enjoyed
loss of appetite or significant weight changes
4
sleep disturbances (either not being able to sleep well or sleeping too much)
loss of energy or a significant reduction in energy level
difficulty concentrating, holding a conversation, paying attention, or making decisions that used to be made fairly easily
loss of values in life
suicidal thoughts or intentions.
If the above symptoms appear almost everyday and almost throughout the day for at least two weeks continuously, then the person experiences MDD (NIMH, 2009;
Diagnostic and Statistical Manual of Mental Disorders, 4th edition, DSM-IV).
2.3 Chemical treatments of depression
2.3.1 Antidepressants medication
Antidepressants function by blocking the reuptake of certain neurotransmitters (norepinephrine, serotonin, dopamine, etc.) back into the nerve ending and blocking some of the other neurotransmitter receptors. The most clinically relevant receptor blockade occurs at muscarinic (acetylcholine), histaminic (H1), alpha-1 adrenergic, dopaminergic (D2), and serotonergic (5-HT2A) receptors (Stahl, 2000; Richelson, 2003; Nierenberg, 1992).
Monoamine Oxidase Inhibitors (MAOIs):
Examples include moclobemide (Manerix), tranylcypromine (Parnate), phenelzine (Nardil), selegiline (Eldepryl). MAOIs could inhibit the degradation of noradrenaline and serotonin, thereby increasing their concentration and effect.
Side-effects include orthostatic hypotension, hypertensive crises, dizziness, reflex tarchycardia, sexual dysfunction, hepatotoxicity, pyridoxine deficiency, weight gain, and sedation (Khawam et al., 2006).
Tricyclics:
Examples include Amitryptyline, Imipramine, and Doxepine. These medicines were introduced shortly after monoamine oxidase inhibitors, but are less commonly used compared to SSRIs, as tricyclics have higher toxicity. Tricyclics block reuptake of serotonin and norepinephrine. They are competitive antagonists at the muscarinic, histaminergic, and alpha 1 and 2 adrenergic receptors.
Side-effects include dry mouth and cardiac effects (Khawam et al., 2006).
Selective Serotonin Reuptake Inhibitors (SSRIs):
Examples include fluoxetine (Prozac), sertraline (Zoloft), Paroxetine (Paxil), fluvoxamine (Luvox), citalopram (Celexa), and escitalopram (Lexapro). (Khawam et al., 2006) SSRIs have replaced tricyclic antidepressants as the first line of depression treatment and have been accounted for most of the antidepressant prescriptions in the United States (Khawam et al., 2006) These medicines could
6
selectively inhibit serotonin reuptake at the presynaptic nerve terminal, thereby increasing its concentration. They are generally well-tolerated; however, it has been reported that about 15% of patients cannot tolerate the side-effects and therefore have stopped taking the medication (Khawam et al., 2006).
Side-effects include sexual dysfunction, gastrointestinal problems, central nervous
system side-effects, and motor-muscle discoordination. (Khawam et al., 2006)
2.3.2 Electroconvulsive therapy
ECT is an extremely effective and fastest acting treatment in which seizures (lasting at least 15 seconds, 30-60 seconds optimally) are electrically induced through the electrodes applied on the anesthetized patient’s temples (Potter and Rudorfer, 1993; Gomez, 2004). It is effective against both unipolar and bipolar depression, mania, and catatonia. ECT is usually recommended for severe depression after both psychotherapy and antidepressants medication have shown no effect, or for patients who cannot tolerate the side-effects of medication (Scott et al., 2005). ECT causes side-effects including anterograde and retrograde amnesia, cardiovascular problems, headache, nausea, confusion, and muscle pain (Datto, 2000; Nobler and Sackeim, 2008a; Nobler and Sackeim, 2008b). It is more recurrent than medication (Kellner and Bourgon, 1998). However, the efficacy of treatment has been shown that continuation of ECT is better than long-term medication treatment (Gomez, 2004; McClintock et al., 2011). If steps are taken to decrease potential risks, ECT is generally accepted to be relatively safe during all trimesters of pregnancy, particularly when compared to pharmacological treatments (Miller, 1994; Walker and Swartz, 1994; Ferrill et al., 1992).
2.3.3 Combined treatment
Depression is also very often treated by one or more methods at the same time.
For example, psychotherapy can be combined with medication (Duncan and Miller, 2000), and medication can be combined with ECT (Kellner and Bourgon, 1998).
8
Table 1. Summary of Side-effects of Different Classes of Antidepressants (Khawam et al., 2006).
Class Mechanism of Action Drugs Side-Effects
Serotonin reuptake
inhibitors (SSRIs) Serotonin reuptake inhibition at the synapse
fluoxetine (Prozac) sertraline (Zoloft) Paroxetine (Paxil) fluvoxamine (Luvox)
citalopram (Celexa) escitalopram (Lexapro)
Sexual dysfunction Central nervous
Nausea Insomnia
Sedation
Monoamine oxidases
inhibitors (MAOs) Irreversibly inactivate the enzyme monoamine oxidase in the central nervous system, platelets,
liver, and gastrointestinal tract
moclobemide (Manerix) tranylcypromine(Parnate)
phenelzine (Nardil) selegiline (Eldepryl)
orthostatic hypotension hypertensive crises
dizziness reflex tarchycardia sexual dysfunction
hepatotoxicity pyridoxine deficiency
weight gain sedation Tricyclic Norepinephrine
Serotonin Muscarinic Histaminergic Alpha-1,2 adrenergic
blockade
Amitryptyline Imipramine
Doxepine
postural hypotension cardiac effects anticholinergic effects
sexual dysfunction sedation weight gain
Selective serotonin and noradrenaline reuptake
inhibitors (SNRIs)
serotonin and noradrenaline reuptake inhibition at the synapse
Venlafaxine (Effexor) milnacipran
Nausea dizziness insomnia somnolence
dry mouth.
Noradrenaline reuptake inhibitors (Sambunaris et
al., 1997)
Noradrenaline reuptake
inhibition at the synapse reboxetine
2.4 Tian Ma (Gastrodia elata Bl.)
Gastrodia elata Bl. (GEB) is a Chinese herb that can be found in China, Taiwan, Japan, and Korea. GEB is one of the earliest and most important traditional herbs of the Oriental countries, used in folk medicine for treatment of various diseases for centuries. Its earliest applications were used as an anti-convulsant, analgesic, and sedative against vertigo. It has also been used for the treatment of inflammatory diseases, headache, epilepsy, paralysis, and tetanus (Kim et al., 2001).
Its beneficial effects in central nervous system such as memory consolidation, anti-anxiety, and anti-depression have also been documented (Niu et al., 2004; Liu and Mori, 1992; Hsieh et al., 1997; Kim et al., 2003; Sun et al., 2004; Jung et al., 2006; Jung et al., 2007; Huang et al., 2007). Recently, it has been further reported to possess anti-atherosclerotic properties (Hwang et al., 2009; Lee et al., 2006), and anti-tumor activity (Heo et al., 2007).
The active components of GEB are mostly phenols, including the principal ones that have been investigated the most such as HBA (4-hydroxybenzylalcohol), HB (4-hydroxybenzyl aldehyde), and vanillin (4-hydroxy-3-methoxybenzaldehyde).
The content of gastrodin in a GEB sample was determined to be 0.419%. In addition to these components, GEB is also comprised of other organic compounds including benzyl alcohol, bis-(4-hydroxyphenyl) methane, 4(4’-hydroxybenzyloxy) benzyl methylether, 4-hydroxy-3-methoxybenzyl alcohol, 4-hydroxy-3-methoybenzoic acid ( Jang et al., 2009).
10
2.5 Neurobiology and genomics of depression: Neuroplasticity
Early studies of depression focused on changes in neurotransmitter concentrations and receptor levels (D’sa and Duman, 2002; Pittenger and Duman, 2008). However, the monoamine hypothesis does not address why the inhibition of serotonin and norepinephrine reuptake requires immediately, but therapeutic action of antidepressants requires chronic administration (D’sa and Duman, 2002;
Pittenger and Duman, 2008). Therefore, the neuroplasticity hypothesis, a focus on regulation of key signaling pathways involved in cellular survival and plasticity, is most widely accepted today. Yet, it is still not fully understood as each class, or even each type but in the same class of antidepressant, yields to different results (D’sa and Duman, 2002; Pittenger and Duman, 2008).
Evidence linking stress, depression, and antidepressants suggest that depression may result from impairment of neurons to make appropriate adaptions and/or synaptic connections (D’sa and Duman, 2002; Pittenger and Duman, 2008).
Functional imaging studies of prefrontal cortical, ventral striatal, and hippocampal volume is decreased in depression patients. (Sheline et al., 1996; Bremner et al., 2000). The emerging pictures from these clinical studies is that cellular loss and volume decrease is associated with depressive disorders (D’sa and Duman, 2002;
Pittenger and Duman, 2008). Dendritic restructuring, decreased neurogenesis, decreased cell survival occurs in stress, and may provide a cellular basis for the impairments seen in the brains of patients with depression (Czech et al., 2001). The results of Czech et al. demonstrate that chronic, not acute treatment with the antidepressant tianeptine, reverses the stress- induced impairments such as changes
in metabolite concentrations, decreases in neurogenesis, and reduction in volume in the hippocampus (Czech et al., 2001). There is no evidence to date if stress reduces the total number of neurons in the hippocampus and if so, the cellular mechanisms by which this neuronal loss occurs. It appears that permanent damage may occur in the brain only after extreme conditions.
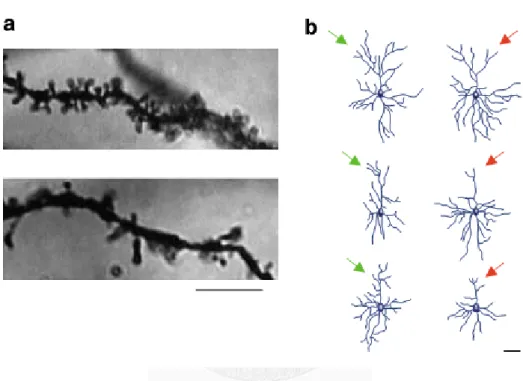
Figure 1 Image visualized by Golgi staining showing how stress alters neuroplasticity, which then affects the dendritic structure, length, and complexity. A) The number of dentritic spines is lower in the prefrontal cortex in the stressed rats (lower panel), compared to the controls (upper panel); scale bar = 5 micrometers. B) The length and complexity of the dendrites are reduced in the prefrontal cortex in the stressed rats (structures on the right and labeled by the red arrow), compared to the controls (structures on the left and labeled by the green arrow); scale bar = 50 micrometers.
(Pittenger and Duman, 2008)
12
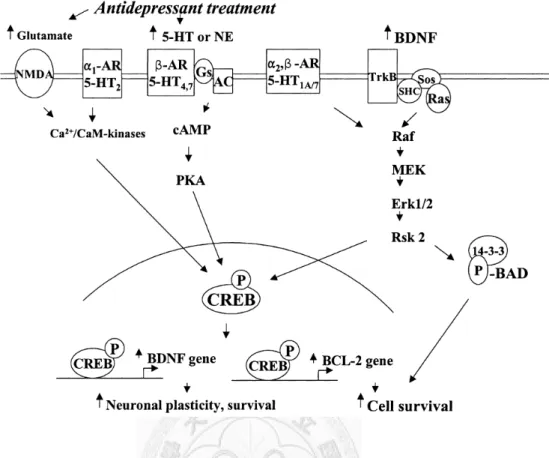
Figure 2 Schematic depicting the influence of antidepressant treatment on the cyclic adenosine monophosphate (cAMP)-cAMP response element-binding protein (CREB) and the neurotrophin-mitogen- activated protein kinase (MAPK) pathway in neuroplasticity and cell survival. Antidepressant treatment increases serotonin and norepinephrine concentrations at the synapse, and these molecules bind to the monoaminergic receptors on the cell membrane and activate the intracellular cAMP-CREB signaling cascade, increasing the mRNA expression and the secretion of BDNF and BCl-2, thereby increasing neuronal plasticity and cell survival. In addition, increased secretion of BDNF bind to the tyrosine kinase receptors (TrkB) and activate the Ras- MAPK signaling cascade, thus increasing neuronal plasticity and cell survival.
(D’Sa and Duman, 2002)
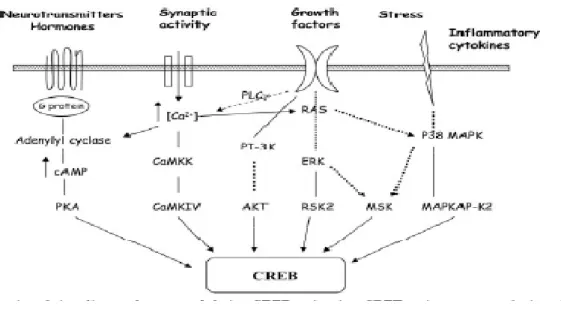
Figure 3 Schematic illustrating that not only can neurotrophic factors and neurotransmitters increase the gene expression and secretion of CREB, but also growth factors and inflammatory cytokines play an important role in the up-regulation of CREB.
(Tardito et al., 2006)
14
Figure 4 Summary of different types of stimulators that can increase the expression of CREB, thereby promoting neuroplasticity and cell survival.
(Duman et al., 2000; Hayley et al., 2005)
2.6 Neurobiology of depression: Overall
Depression can be caused by several mechanisms, including neurotransmitters regulation, HPA axis, apoptosis, inflammation, GABA, and neuroplasticity. Due to the limited scope this thesis, only the theory of the neurogenesis is discussed. Figure 5 summarizes the various mechanisms of pathology of depression.
Figure 5 Summary of different potential routes depicting how chronic stressors could lead to depression by various mechanisms. Positive signs represent increasing the activity or secretion of the target, and vice versa for the negative signs. Chronic stressors could decrease cytokine activity, increase the production of CRH, and inhibit BDNF (black lines). CRH could reciprocally modulate GABA secretion, and decrease the production of 5-HT (green lines). The inhibition of 5-HT results in depression, and the increase in 5-HT secretion excites BDNF and Bcl-2 release, thereby achieving neuroplasticity (purple and pink lines). CRH, in addition, could excite the release of
16
ACTH and CORT, which consequently inhibit cytokine activity, therefore causing apoptosis of neurons in the brain, resulting in depression (orange lines). Furthermore, the inhibition of cytokine activity leads to higher IDO and Kyn activity, resulting in more NMDA receptors and they inhibit serotonin. The promotion of IDO inhibits serotonin production, and thus inhibiting neuroplasticity (purple lines). These pathways are not considered exclusive of one another.
(Hayley el al., 2005)
3 Purpose of Study
The purpose of this study is using the microarray technology to deduce a potential antidepressant pathway, focusing on the genomics level only. The details are as followed:
1. Apply the widely-adopted animal depression induction model (forced swimming test) to investigate the antidepressant effects of WGE in animal research, based on the difference in immobility time, measured by animal behavior analysis software.
2. Perform microarray experiments and data analysis to further investigate how WGE alters the gene expression in the rodent brain - specifically the depression related areas: the frontal cortex, the hippocampus, and the striatum - and to screen for a possible mechanism. The monitored target, total mRNA from these brain tissues, would be extracted by a standard handling protocol to ensure high quality of stability.
3. Perform QRT-PCR to validate the results of microarray data analysis to support the preliminary findings.
18
4 Experimental Framework
5 Materials and Methods
5.1 Materials Animal treatment:
Gastrodia elata Bl.: Koda Pharmaceutical Co., Ltd., Taoyuan County, Taiwan Fluoxetine (Prozac®): Eli Lilly and Company, Inc., Taipei, Taiwan
FST behaviour analysis software: Sunpoint Co., Ltd., Taoyuan County, Taiwan
RNA extraction:
Centrifuge: Hermle Z 300K
Trizol: 100 ml; Invitrogen, CA, USA
Bromochloropropane (BCP): 250 ml; Invitrogen, CA, USA Isopropanol: 750 ml; Bioman Scientific Co., Ltd., Taipei, Taiwan DEPC water: 250 ml; Bioman Scientific Co., Ltd., Taipei, Taiwan
Microarray analysis software:
Gene Spring: Agilent Technologies, CA, USA Pathway Studio: Ariadne, CA, USA
QPCR:
Primers (refer to the list followed)
SYBR Green PCR Kit: Applied Biosystems, Foster City, CA, USA ViiA 7 software: Applied Biosystems, Foster City, CA, USA
20
5.2 Methods
5.2.1 Sample preparation and dosage
The GEB sample was acquired from Koda Pharmaceutical Co., Ltd. (Taoyuan County, Taiwan), in the water extraction form (WGE), and the dosage used was 0.5 g/kg body weight (Chen, 2008). The dosage was chosen as it yielded the lowest concentrations of 5-hydroxyindoleacetic acid (5-HIAA), that were most significantly different from the negative control group, compared to other dosages, in the frontal cortex, and hippocampus (Chen, 2008). 5-HIAA is the metabolic product of 5-HT, which plays an important role in mood regulation.
5.2.2 Animals and treatments
Four-week-old male SD rats (BioLASCO Taiwan Co., Ltd., Yilan County, Taiwan) were randomized into four groups with three in each: the treatment group, the positive control group, the negative control group, and the normal control group. The rats were housed at the Animal House Facility at Institute of Food Science and Technology at a temperature of 22±2℃,with 12 hours dark/light cycle, and had access to unlimited supply of commercial rodent food (BioLASCO, Yilan County, Taiwan) and water ad libitum. After acclimation for two weeks, the animals were gavaged once daily for 21 days. The treatment group was orally administered with 0.5 g/kg bw of GEB dissolved in 10 ml/kg bw of ddH2O. The positive control group was administered with 18 mg/kg bw of Fluoxetine (Prozac®) dissolved in equal volume of ddH2O. As for the negative control and the normal
control groups, the rats were orally administered with equal volume of ddH2O.
During the adaptation weeks, the rats were not orally administered with any of the sample – only with water to adapt the rodents to the injection needle.
5.2.3 Weight change and food intake
Loss of appetite followed by loss of weight change would be a common adverse-effect of antidepressants. In this research, the two observable and accessible factors weight change and food intake were used as the indicators in evaluation of antidepressant effect of WGE. The rodents’ food intake were weighed and recorded at a daily basis, and their weights were weighed once per week.
5.2.4 Forced swimming test
Forced swimming test, the widely adopted behavioural test for evaluating antidepressant effects, was performed on the 22nd and the 23rd day to induce depression (Porsolt et al., 1977a, b). All of the 9 rats (3 from the treatment group, 3 from the negative control, and 3 from the positive control) were subjected to FST individually on the 22nd day, each with 15 minute duration, in a glass cylinder 3/4 filled with room-temperature tap water (22±1℃). After 24 hours, on the 23rd day, the rats were once again subjected to FST for 5 minutes to induce depression and subsequently sacrificed. The entire FST for all the rats in both regimes were video recorded individually and analyzed by behavioural analysis software for immobility times (Sunpoint Co., Ltd., Taoyuan County, Taiwan). The definition of immobility was defined as complete immobility, with no struggling with the fore or
22
back limbs in any degree to minimize the factor of immobility due to fatigue.
5.2.5 Tissue dissection
The rats were anesthetized with CO2, and were sacrificed by decapitation.
Next, the tissues were dissected on a metal surface on ice into the frontal cortex, striatum, and hippocampus, and the brain was separated based on the dissecting method proposed by Glowinski (Glowinski and Iversen, 1966). The samples were then snap frozen with liquid nitrogen and were stored at -80℃. These tissues were selected as studies have shown that the neurotransmitters level change in these regions after depression and antidepressant treatment (Zhong et al., 2008; Chen, 2008).
5.2.6 RNA extraction, purification, and quality control
Total RNA was purified using RNeasy Mini Kit (Qiagen, Valencia, CA, USA), and was quantified using Beckman DU800 spectrophotometer (Beckman Coulter, Fullerton, CA, USA) to ensure that the A260/A280 ratio of each sample was greater than 1.8. Then, Agilent 2100 bioanalyzer (Agilent Technologies, Santa Clara, CA, USA) was used to evaluate the integrity of the RNA in each sample.
Samples with RNA integrity number (RIN) greater than 8 were used for microarray analysis.
5.2.7 M
Two c Tai (Taipei expression consisted o oligonuclei on RefSeq
Microarray
chips of Illu i, Taiwan)
profiles for of 22,503 o iodes arrang
content (Re
umina RatR were used r twelve sam oligonucleot
ged in the s elease 16).
Ref-12 Expr , which co mples in pa tide probes sense orienta
ression Bea ould efficien arallel on a s , and each ation. The c
adChip acqu ntly genera single Bead probe cons content was
uired from ate genome- dChip. Each sisted of 50 s primarily b
Gene -wide h chip 0-mer based
24
5-2-8 Microarray data analysis
Normalization: The data acquired from two rat-ref 12 chips were quantile normalized using Gene Spring. Normalization is a process that removes systematic effects and brings data from different microarray chips onto a common scale, as cDNA microarray experiments can inevitably generate systematic variations (Smyth and Speed, 2003). In microarray raw data, there is slight variation between results for two different chips, and even within the control and treatment arrays there is some variation in the average intensity. The reason is that there are slight variations during production of the arrays and that one array might have got slightly more RNA sample due to different levels of hybridization (Quackenbush, 2002). Therefore, it is important to apply normalization to reduce these systematic errors before further analysis.
Quantile normalization: It is a technique for making two distributions identical in statistical properties. The values of both a test distribution and a reference distribution are sorted so that they are composed of the same length. The highest entry in the test distribution then takes the value of the highest entry in the reference distribution, the next highest entry in the reference distribution, and so on, until the test distribution matches the reference distribution (Bolstad et al., 2003).
Fold change analysis: Fold change analysis was performed on the normalized data for all twenty-four samples was performed fold change analysis using Gene Spring (Agilent Technologies, CA, USA). The WGE group, and the normal control group, respectively, was compared to the NE group for cortex, hippocampus, and striatum
26
regions respectively. All genes that were significantly expressed in both trials (two separate biochips), determined by absolute fold change values greater than 1.5, were selected and classified in gene lists for further investigation.
Gene clustering: The genes with significant expression level were selected by the fold change analysis method and the gene list corresponding to each brain region tissue (including expression intensities of each gene) was imported into the genomics analysis software, Gene Spring. The expression intensity of each significant gene was represented by different intensities of red and green, with the highest intensity of red being most up-regulated, and the highest intensity of green being most down-regulated. The expression intensities of each gene between different experimental groups were placed side by side, as represented by heatmaps.
Pathway analysis: The genes with significant expression level were selected by the fold change analysis method and the gene list corresponding to each brain region tissue was imported into the pathway analysis software, Pathway Studio (Ariadne, CA, USA). The genes on each list were investigated to the one neighbouring level, and pathways were deduced and listed from the lowest p-values to the highest p-values, corresponding to the order of decreasing probabilities. The algorithm in the database was based on KEGG (Kyoto Encyclopedia of Genes and Genomes) analysis pathway. The concept of the algorithm can be found in the manual of Gene Set Analysis Toolkit (http://bioinfo.vanderbilt.edu/webgestalt/) (Zhang et al., 2005).
5-2-9 QPCR
The SYBR Green PCR kit was used (Applied Biosystems, Foster City, CA, USA) for labeling the probes and ViiA 7 software (Applied Biosystems, Foster City, CA, USA) was used to generate the amplified curve. 18S ribosomal RNA was used as the internal control. Delta Ct (cycle threshold) was acquired by the subtraction of average Ct of 18S from the average Ct of gene of interest. The relative gene expression level was determined by delta delta Ct method.
Table 2 lists the forward and reverse DNA sequences of the primers used in QPCR Primer Name Sequences
(5’ to 3’)
Base Pair (mer)
Primer Name Sequences (5’ to 3’)
Base pair(mer) rat GAPDH-F GGT TAC
CAG GGC TGC CTT CT
20 rat GAPDH-R TTG AAC
TTG CCG TGG GTA GAG
21
ROBO1-F CCA GCC
CCC ACC TCT GAT A
19 ROBO1-R CCC TTT
AGA GAC GAT CAG GTC TGA
24
ROBO2-F AAC ATG
GCA CAT TCA AAG CAA TAC T
25 ROBO2-R TCA TCA
GCA TCC TCA TCT GGA A
22
ROBO3-F GCA GTC
CAC AGC CAC TCT TAC C
22 ROBO3-R GAT ACG
CTG AGA GGA GAA CTT GGT
24
ROBO4-F TCC TAG
GCA TTG CTG TGT GTA TCT AC
26 ROBO4-R TCC TAG
GCA TTG CTG TGT GTA TCT AC
23
CRMP2-F CTG AAT
TCG CTC
21 CRMP2-R CTT GCT
GGG ATC 20
28
ACC CAA GTC
TGC ATG GT
Ywhaq-F GGT ATC
TTG CTG AAG TCG CTT GT
23 Ywhaq-R GGA TCG
GAT GTG TAG GTT GCA
21
Ywhaz-F CTG CTG
GTG ATG ACA AGA AAG G
22 Ywhaz-R TGA GGG
CCA GAC CCA GTC T
19
Ywhab-F GCG CCT
TTG CTC CCT ACA G
19 Ywhab-R GCT GCG
GCC ATA TCA TCA TA
20
Ywhae-F GGT TTT
GCT GTA ACG TGT GTT TG
23 Ywhae-R AGA GGG
AGG AGT CGG CAA GA
20
SLIT-ROBO-1-F CCT GTT GTC TCC GGT GAA CTG
21 SLIT-ROBO-1-R ATC TGC
ATG AAC CGC ATA ATG A
22
SLIT-ROBO-2-F GCT GGC GTC CTC AAG CTT T
19 SLIT-ROBO-2-R GAT ATG
CAC AGC TCT CTC TTG CA
23
SLIT-ROBO-3-F TCT TTG CTT TCC TCA ATC ACC TT
23 SLIT-ROBO-3-R ATA CAG
GGT CCT GCC CAT CA
20
Slit 1-F GAG CTG AAC GGT ATC AAA TCC AT
23 Slit 1-R GGC ATC
GGG TGC AAT CTC
18
Slit 2-F TCC TGC CCC ATA TCA CTG TTC
21 Slit 2-R GCT TTC
GGT TGC GTG AAA AG
20
Slit 3-F TCC GAC AGC TGA CAC TAA TTG AC
23 Slit 3-R ATG GAC
CGG GAT GCA TCT C
19
Rhoa-F TGG ACG 20 Rhoa-R TGT CGA 23
GGA AGC AGG TAG AG
TGG AAA AAC ACA Sequences (5' to 3') TCA GT
Rock1-F CTG CGG
GTA CGA AGG TAT CG
20 Rock1-R CCA ATC
CAT CCA GCA AAC AA
20
Rock2-F GCC CGA
TCA TCC CCT AGA AC
20 Rock2-R GTG GAT
GGA AGA ATA TGA TCA CCT T
15
Cdk5-F GGC CCG
AGC CTT TGG TAT
18 Cdk5-R TTG GCC
AGC TCT GCA AAG AT
20
Cdc42-F TCC GCC
CTC ACA CAG AAA G
19 Cdc42-R TGC GTT
CAT AGC AGC ACA CA
20
MAPT-F CAG GGA
AGG CAA AGA TTT GG
20 MAPT-R ACA CAC
GGA CTC CCA TCC A
19
MAP1a-F ACA GTG
ACC TTT CCA CGG AAG A
22 MAP1a-R AAT CTG
ACT GTG AGG AGC CTG AGT
24
MAP1b-F ACC CTA
CTG TGG GTG CTG GTA
21 MAP1b-R TCT GTC
GGC GGA ATC TTA TGT
21
MAP2-F AGG CTC
CCA GTG CGT TTA AA
20 MAP2-R CCT GCG
AGG AGG GAG GAT
18
Profilin1-F CCC CCA
CCT TCA ATG TCA CT
20 Profilin1-R GCA GGT
GAG AGG CCA TTT CA
20
Csk-F GCA GCT
CGA GCA CAT CAG AA
20 Csk-R CAG CAG
GGC ACC AAA TCT GT
20
Abl1-F AGG GCC
TGG GCG AAA G
16 Abl1-R GCG CTG
AAC AGG TTG GTC
20
30
TT
Rasgrp1-F CGC TGT
AAA GAC TGT GGG ATG A
22 Rasgrp1-R TTG GCA
CCA CAG AGC TGA TG
20
Rassf5-F GCA CCC
TCA CCC CAA CCT
18 Rassf5-R AGT GCT
TCT CCC GGC TGT TA
20
Rasl-11b-F TCT CCA
TCA CCG ACC ACA AG
20 Rasl-11b-R GCA AGA
GGT CGG CTT TGT TG
20
Rgs4-F TTT TCT
GCT TTG AGG TAA GAG CTT GT
26 Rgs4-R CCC GTC
CTC CTC TTT TCT CTT C
22
Gpr88-F TAG GGC
GCG AGG TGT GAA
18 Gpr88-R CCG CCC
ACG ATT CTT CTT C
19
5-2-10 Statistical analysis
Each value is presented as means ± SD. For the animal body weight change and food intake data, Student t-test was used. The data of the FST were also analyzed by Student t-test. The results of microarray analysis were normalized and analyzed by fold change analysis. The QPCR data were analyzed by Student t-test. The threshold p <
0.05 was considered statistically significant for all analyses, using the software SAS.
6 Results
Weight change and food intake
Both the amount of food intake and the weight change were significantly lower (p <
0.05) in the PC group in weeks 1, 2, and 3, as compared to the NE group (Figures 6 and 7).
Forced swimming test
The parameter “immobility time” was used as the indicator for “despair” – one of the symptoms of human depression. The treatment group (WGE group, 0.5 g/kg bw WGE) demonstrated significantly shorter (p < 0.05) immobility time than the negative control group (NE). Likewise, the positive control group (PC group, 18.0 mg/kg bw fluoxetine) displayed significantly shorter immobility time than the negative control group (NE) (Figure 8).
Microarray analysis overview, array design, principal component analysis
To investigate the pathways of WGE at the gene expression level, the overall change of gene expression was analyzed by oligonucleotide microarray, and Illumina rat ref-12 chip was chosen, and two such chips were used for data analysis. From the Principal Component Analysis graph (Figure 10), the resulting signal intensities from the two trials were very spread out, as a result of biological variances. Therefore, no statistical measures were applied onto the analysis of the results; rather, fold change analysis was applied onto each individual trial. Two biological repeats were performed (one on each
32
chip), as there was no necessity to apply statistical measures. Genes that were expressed with intensities higher than the threshold (fc ≥ 1.5) in both trials were further investigated (n=2) to minimize the possibilities of having false-positive results. The data acquired by microarray experiments was normalized using Gene Spring V.3, and the pathways were deduced by Pathway Studio. Among the 22,523 probes that we analyzed from the database, WGE altered the expression level of 200 transcripts.
Data normalization
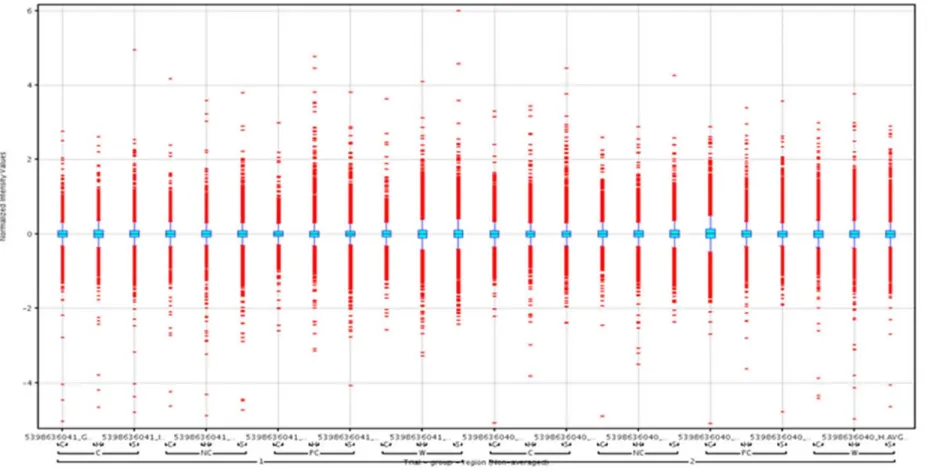
Quantile normalization was chosen because it would yield the lowest variation for animal studies (Bolstad et al., 2003). After normalization, we can see that the intensity distribution for each sample array is about the same, as the median of each intensity distribution is lined up at almost the same level (Figure 9).
Fold change analysis
Fold change analysis was applied to select the significant genes, and the threshold was set at 1.5. Genes that were significant from the results of the first chip is represented by the red circle, and results from the second chip are represented by the blue one. The overlapped circle in the centre represents genes that were significant from both biological repeats 1 and 2. Because of wide biological variances, the number of significant genes in both biological repeats may vary greatly up to ten-fold. In the frontal cortex, the numbers of genes acquired from both repeats were 31 up-regulated and 15 down-regulated (Figure 11). As for the hippocampus, the numbers of up-regulated and down-regulated genes were 68 and 36, respectively (Figure 14).
Finally, there were 42 genes up-regulated and 18 genes down-regulated in striatum
(Figure 17).
Figure 6 shows the effects of different treatments on weight gain weighed once per week. The fluoxetine group displays significantly slower weight gain compared to the saline water group, in all three weeks. Data are represented as mean +/- SD (n=3) and analyzed statistically using Student t-test. Bars with asteroids represent the week in which the PC group shows significant difference compared to the control group in weight gain (p < 0.05). WGE: Gastrodia elata Bl.; PC: fluoxetine; NE: saline water; NC:
saline water, without forced swimming test induction.
week1 week2 week3
Weight Gain (g)
0 20 40 60 80 100 120 140 160 180
WGE PC NE NC
*
*
*
34
Figure 7 shows the effects of different treatments on food intake. The fluoxetine group displays significantly lower food intake compared to the saline water group, in all three weeks. Data are represented as mean +/- SD (n=3) and analyzed statistically using ANOVA and Duncan’s test. Bars with asteroids represent the week in which different groups show significant difference compared to the control group in weight gain
(p<0.05). WGE: Gastrodia elata Bl.; PC: fluoxetine; NE: saline water ; NC: saline water, without forced swimming test induction.
Figure 7 shows the effects of different treatments on food intake. The fluoxetine group displays significantly lower food intake compared to the saline water group, in all three weeks. Data are represented as mean +/- SD (n=3) and analyzed statistically using ANOVA and Duncan’s test. Bars with asteroids represent the week in which different groups show significant difference compared to the control group in weight gain
(p<0.05). WGE: Gastrodia elata Bl.; PC: fluoxetine; NE: saline water ; NC: saline water, without forced swimming test inducti
Figure 7 shows the effects of different treatments on food intake. The fluoxetine group displays significantly lower food intake compared to the saline water group, in all three weeks. Data are represented as mean +/- SD (n=3) and analyzed statistically using Student t-test. Bars with asteroids represent the week in which the PC group shows significant difference compared to the control group in weight gain (p < 0.05). WGE:
Gastrodia elata Bl.; PC: fluoxetine; NE: saline water; NC: saline water, without forced swimming test induction.
week1 week2 week3
Amount of Food Intake (g)
0 50 100 150 200 250 300
WGE PC NE NC
*
*
*
Figure 8 shows the effects of WGE and fluoxetine on the immobility time of different groups of rats in FST. Immobility time is defined as complete immobility. Data are represented as mean +/- SD (n=3) and analyzed statistically using Student t-test. Bars with asteroids show that the WGE and PC groups demonstrate significantly lower immobility times compared to the control (p < 0.05).
NE WGE PC
Immobility Time (s)
0 20 40 60 80 100 120
*
*
36
Figure 9 shows the box plot distribution of normalized microarray results after processing the raw data of all 24 samples from both chips 1 and 2 by the quantile algorithm. The figure is created by Gene Spring™.
Figure 10 shows the principal analysis diagram created by Gene Spring™. It displays the variations between two biological repeats are significantly different based on principal component analysis scores. It is presumed that the differences are due to batch differences and biological variations. Red represents samples from trial/chip 1, and blue represents samples from trial/chip 2. Squares, triangles, circles, and diamonds represent the negative control, normal control, positive control, and treatment group, respectively.
38
(A)
(B)
Figure 11 shows the Venn diagram created by Gene Spring™ that displays the numbers of genes altered by WGE in the frontal cortex in both up and down regulations. The pink region represents the genes acquired from chip 1, and the teal region represents the genes acquired from chip 2. The overlapped region represents the genes altered in both chips (fold change > 1.5). (A) 31 genes are up-regulated. (B) 15 genes are down-regulated.
40
In the frontal cortex (fold change > 1.5, WGE vs. negative control)
Entrez gene
ID Gene name Full name Fold
change Function
24173 Adra1b adrenergic, alpha-1B-, receptor 2.49
couples with G alpha(h) (transglutaminase II) to activate phospholipase C; facilitates Ca2+ release and capacitative Ca2+
entry 24211 Atp1a1 ATPase, Na+/K+ transporting, alpha 1
polypeptide 1.79 mediates Na+ and K+ transport; may play a role in regulation of blood pressure
171051 Cabp1 calcium binding protein 1 1.93 component of calcium-mediated signal transduction; may be involved with the dendritic cytoskeleton
84347 Cacng2 calcium channel, voltage-dependent,
gamma subunit 2 1.60 subunit of voltage-dependent calcium channel; involved in influencing channel properties
25305 cort Cortistatin 1.82 inhibits growth hormone secretion; may act as a neuropeptide to mediate signaling via a somatostatin receptor subtype
24373 Fst Follistatin 1.89 binds activin and inhibits activin-mediated signaling pathways 25136 Gfra2 GDNF family receptor alpha 2 2.30 stimulates c-Ret tyrosine phosphorylation by mediating a crosslink
with GDNF of c-Ret
64317 Gpx3 glutathione peroxidase 3 1.53
belongs to the glutathione peroxidase family, which functions in the detoxification of hydrogen peroxide. This gene is highly expressed in the kidney where it may play a role in protecting the kidney from oxidative damage.
59324 Kcnk1 potassium channel, subfamily K,
member 1 1.56 a putative potassium channel with two P domains 85327 Lin7a lin-7 homolog a 1.71 may mediate the formation of cell-cell junctions 24604 Npy neuropeptide Y 1.71 peptide hormone; involved in regulating food intake
29480 Rgs4 regulator of G-protein signaling 4 2.10 inactivation of active G-proteins; may regulate dopamine D2 receptor signaling
Entrez gene
ID Gene name Full name Fold
change Function
291061 Riok1 RIO kinase 1 1.51
This gene encodes a member of the RIO family of atypical serine protein kinases. A similar protein in humans is a component of the protein arginine methyltransferase 5 complex that specifically recruits the RNA-binding protein nucleolin as a methylation substrate
362993 Rnd1 Rho family GTPase 1 1.58 Uncharacterized
64347 Sncg synuclein, gamma (breast
cancer-specific protein 1) 2.11 may play a role in the neurofilament network 116470 Stx1a syntaxin 1A (brain) 2.01 plays a role in neurotransmitter release
25567 Tnr tenascin R 1.75 an extracellular matrix protein; involved in regulating neurite outgrowth
362708 Trim54 tripartite motif-containing 54 2.81 May bind and stabilize microtubules during myotubes formation 81822 Actb actin, beta -1.88 mRNA expression increases following axon injury; may play a
role in acceleration of axonal outgrowth
25669 Cpe carboxypeptidase E -1.81 may play a role in post-translational processing of peptide hormones including preproopiomelanocortin
29707 Gabra5 gamma-aminobutyric acid (GABA) A
receptor, alpha 5 -1.71 subunit of the GABAA receptor; may be part of distinct GABAA receptors within the olfactory bulb
500040 Tes testis derived transcript -1.74
Scaffold protein that may play a role in cell adhesion, cell spreading and in the reorganization of the actin cytoskeleton. Plays a role in the regulation of cell proliferation. May act as a tumor suppressor
54320 Pdpn Podoplanin -1.52 membrane glycoprotein that may function in lung development 117017 Polr2g polymerase (RNA) II (DNA directed)
polypeptide G -1.62
human homolog is a subunit of RNA polymerase II, which catalyzes DNA dependent synthesis of mRNA in transcription;
binds the human von Hippel-Lindau (VHL) tumor suppressor
42
360480 Litfl LITAF-like protein -1.78
Entrez gene
ID Gene name Full name Fold
change Function
314313 Znf183 ring finger protein 113A2 -1.89 contains RING and CCCH-type zinc finger domains 303073 Cyfip2
(predicted) cytoplasmic FMR1 interacting protein 2 1.55 Uncharacterized 365748 Bhlhb5
(predicted)
basic helix-loop-helix family, member
e22 -2.49 Uncharacterized
314399 RGD1359144 (predicted)
chromosome 14 open reading frame 130
(similiar) -2.07 Uncharacterized
298591 Igsf21 immunoglobin superfamily, member 21 1.66 Uncharacterized
313783 Olfm2 olfactomedin 2 1.63 Uncharacterized
363869 Ubl3 ubiquitin-like 3 1.67 Uncharacterized
500304 RGD1561270
(predicted) Zinc finger protein 248 (similar) 1.50 Uncharacterized 292539 RGD1562905
(predicted)
60S ribosomal protein L17 (L23)
(similar) 14.11 Uncharacterized
290790 RGD1565014 (predicted)
Low-density lipoprotein receptor-related protein 4 precursor
(LDLR dan) (similiar)
2.24 Uncharacterized 500717 RGD1566401
(predicted)
GTL2 (similiar, imprinted maternally
expressed untranslated) 3.31 Uncharacterized 500297 RGD1560607
(predicted) env precursor (similiar) 1.68 Uncharacterized 360435 LOC360435
(predicted) neurotrimin (hypothetical gene) 1.71 Uncharacterized 367923 LOC367923
(predicted) 60S ribosomal protein L23a (similar) 1.59 Uncharacterized 362484 Plekhf2 pleckstrin homology domain containing, 2.03 Uncharacterized
Entrez gene
ID Gene name Full name Fold
change Function
288513 RGD1305593
(predicted) RIKEN cDNA 1810042K04 (similiar) 1.80 Uncharacterized 497920 LOC497920
(predicted) RGD1563967 (similiar) -2.01 Uncharacterized 501223 LOC501223
(predicted) RGD1563967 (similiar) -1.56 Uncharacterized 498405 RGD1560273
(predicted) RGD1560273 (similiar) -1.50 Uncharacterized 291580 RGD1312005
(predicted) Uncharacterized -1.70 Uncharacterized
44
clustering analysis. The genes were classified in 6 main groups based on gene ontology: neural plasticity, red; neurofilament, purple; transporters & channels, green; transcription factors & glycoproteins, orange; extra-cellular matrix & cell-cell adhesions, blue; post-translational enzyme, brown. As the legend shows, red means up-regulation, and green means down-regulation. The figure is created by Gene Spring™.
Table 4 shows the possible KEGG pathways of genes regulated by WGE in frontal cortex, arranged in the order of increasing p-value.
Data is generated by Pathway Studio™.
Rank Pathway name Overlapping entities P-value
1 Axon development Sncg
Actb 0.00143310
2 Negative regulation of microtuble depolymerization Trim54 0.00189955
46
3 Inactivation of MAPK activity Rgs4 0.00189955
4 Regulation of dopamine secretion Sncg 0.0104909
5 Positive regulation of cell motion Stmn1
Bcl6 0.0205670
Figure 13 shows the gene network created by Pathway Studio™ showing Actb and the related genes altered by WGE in the frontal cortex. After filtering out the unrelated genes, a gene network analysis was constructed, with Actb located in the centre of the network. The gene was selected because it is a regulator of actin production, an important component for axon/dendrite growth. Boxes highlight other regulators of neurogenesis that were screened out by network analysis, which were one gene neightbouring (eiher upstream or downstream) to the central gene in the network.
48
(A)
(B)
Figure 14 shows the Venn diagram created by Gene Spring™, which displays the numbers of genes altered by WGE in the hippocampus in up and down regulations. The pink region represents the genes acquired from chip 1, and the teal region represents the genes acquired from chip 2. The overlapped region represents the genes altered in both chips (fold change > 1.5). (A) 68 genes are up-regulated (B) 36 genes are down-regulated.
(fold change > 1.5, WGE vs. negative control).
Entrez gene
ID Gene name Full name Fold
change Function
286939 Clmp CXADR-like membrane protein 1.92 Human homolog plays a role in cell-cell adhesion
360970 Cabp7 Cabp7 calcium binding protein 7 8.77 Negatively regulates Golgi-to-plasma membrane trafficking by interacting with PI4KB and inhibiting its activity.
24253 Cebpb CCAAT/enhancer binding protein
(C/EBP), beta 2.18 Transcription factor that binds to CCAATT motif on DNA and may facilitate IL-6 induced transcriptional activation 114490 Cited2 Cbp/p300-interacting transactivator, with
Glu/Asp-rich carboxy-terminal domain, 2 1.59 A transcription factor 25669 Trh thyrotropin releasing hormone 3.17
Mediates processes of vasopressin (AVP) and oxytocin (OT)
biosynthesis and releases at the hypothalamo-neurohypophysial level
366196 Crls1 cardiolipin synthase 1 1.50
Catalyzes the reversible phosphatidyl group transfer from one phosphatidylglycerol molecule to another to form cardiolipin (CL) (diphosphatidylglycerol) and glycerol.
317399 Ddx21 DEAD (Asp-Glu-Ala-Asp) box
polypeptide 21 1.85
Can unwind double-stranded RNA (helicase) and can fold or introduce a secondary structure to a single-stranded RNA (foldase). Functions as cofactor for JUN-activated transcription
116663 Dusp6 dual specificity phosphatase 6 1.94 Protein tyrosine phosphatase involved in regulation of mitogen-activated protein kinase (MAPK)
25283 Gclc glutamate-cysteine ligase, catalytic
subunit 1.61 Catalyzes the first step in the synthesis of glutathione 191576 Tecr trans-2,3-enoyl-CoA reductase 1.63 Synaptic glycoprotein expressed in many types of neurons 300443 Lppr2 lipid phosphate phosphatase-related
protein type 2 1.60 Phosphatidate phosphatase activity
81682 Lum lumican 1.79 Member of leucine-rich proteoglycan family; may play a role in immature and transient fibrosis of acute pancreatitis
50
ID change
362911 Mal2 mal, T-cell differentiation protein 2 2.77
Human homolog is a member of the MAL family of proteins, involved in transcytosis and targeting membrane proteins to the apical surface of the cell
29456 Map 1b microtubule association protein 1b 1.77 Binds microtubules and may act as microtubule cross-linkers 29458 Neurod 1 neurogenic differntiation 1 3.44 A transcription factor; involved in neuronal differentiation
299757 Nts neurotensin 8.57
Gene encodes a precursor protein for both peptides;
neurotensin may be involved in smooth muscle contraction and possibly fat metabolism
24660 Pmp22 peripheral myelin protein 22 2.02
Mediates Schwann cell growth and peripheral myelin compaction; human homolog gene duplication causes Charcot-Marie-Tooth 1A (CMT1A) neuropathy
29434 Rasgrp1 RAS guanyl releasing protein 1 1.69 Putative guanine nucleotide exchange factor with Ca2+ and diacylglycerol binding domains; may activate Rap protein mediated inhibition of Ras signaling pathways
500137 Neurod 6 neurogenic differentiation 6 6.00 A transcription factor; involved in neuronal differentiation 314721 Anks1b ankyrin repeat and sterile alpha motif
domain containing 1B 1.68
Isoform 2 may participate in the regulation of nucleoplasmic coilin protein interactions in neuronal and transformed cells. Isoform 3 can regulate global protein synthesis by altering nucleolar numbers.
81763 Rpl5 ribosomal protein L5 1.72 Required for rRNA maturation and formation of the 60S ribosomal subunits
140941 Siah1a seven in absentia 1A 1.95 Synaptophysin binding protein and function as E3 ubiquitin-protein ligases to regulate the ubiquitination and degradation of synaptophysin
64201 Slc25a11 solute carrier family 25 (mitochondrial
carrier; oxoglutarate carrier), member 11 1.80 Reduced glutathione (GSH) transporter; involved in mitochondrial transport of GSH and 2-oxoglutarate
29484 Slc3a1 solute carrier family 3, member 1 2.55
Carrier protein involved with the transport of cystine and other amino acids across the membrane
64347 Sncg synuclein, gamma (breast cancer-specific
protein 1) 4.76 May play a role in the neurofilament network 113938 Snurf SNRPN upstream reading frame 1.63
Produced from a bicistronic transcript along with SNRPN;
each cistron may play a role in the imprinted Prader-Willi syndrome
171442 Svop SV2 related protein 1.66 localized to synaptic vesicles and microvesicles in brain and endocrine cells; may play a role in synaptic vesicle transport
311621 Tomm34 translocase of outer mitochondrial
membrane 34 1.75
Plays a role in the import of cytosolically synthesized preproteins into mitochondria. Binds the mature portion of precursor proteins. Interacts with cellular components, and possesses weak ATPase activity. May be a chaperone-like protein that helps to keep newly synthesized precursors in an unfolded import compatible state
64619 zfp238 zinc finger protein 238 4.69 Sequence-specific transcriptional repressor 303836 LOC303826
(predicted) ribosomal protein L27a (similar) 2.31 Belongs to the ribosomal protein L15P family
497698 Ykt6 (predicted) YKT6 v-SNARE homolog (similiar) 2.01
Vesicular soluble NSF attachment protein receptor (v-SNARE) mediating vesicle docking and fusion to a specific acceptor cellular compartment. Functions in endoplasmic reticulum to Golgi transport; as part of a SNARE complex composed of GOSR1, GOSR2 and STX5.
Functions in early/recycling endosome to TGN transport; as part of a SNARE complex composed of BET1L, GOSR1 and STX5. Has a S-palmitoyl transferase activity.
497708 Fgfr1 (predicted) Fibroblast growth factor receptor 1
(similiar) 1.58
Proportion of transmembrane and soluble extracellular isoforms may modulate fibroblast growth factor signaling;
plays a role in regulation of neuronal cell proliferation 497785 Wipf3 (predicted) WAS/WASL interacting protein family,
member 3 (hypothetical) 3.35
Binds SH3 domains; may play a role in MAP kinase mediated signal transduction