Research and Improvement of Maximum Power Point Tracking for Photovoltaic Systems
Yu-En Wu Chih-Lung Shen Chia-Yu Wu
Department of Electronic Engineering
National Kaohsiung First University of Science and Technology Nanzih, Kaohsiung, Taiwan, R.O.C.
Tel:+886-7-6011000 ext.:2511
[email protected]
Abstract -- In this paper, the advantages/disadvantages of
several commonly used maximum power point tracking algorithm (Perturb & Observe, Incremental Conductance, Three Points Weighting, and Improved Perturb & Observe) are firstly discussed. Then, a Modified Perturb & Observe (MPO) method is proposed to achieve maximum power point tracking (MPPT) for a PV (photovoltaic) system and to improve the shortcomings of prior methods. The MPO method possesses a conveniently regulated capability of the perturbation, and stopping perturb while tracking to near the maximum power point. Such features can improve the power consumption problem of traditional Perturb & observe (PO) method in the maximum power point, while also increasing the speed of maximum power tracking to increase the system dynamic response.
In order to verify the effectiveness of the proposed MPO method, a 120W PV system will be established, the MPO method and the others MPPT methods is used, respectively and compared. Finally, simulation and experimental results will be presented to verify the feasibility of the MPO algorithm.
Keywords- MPPT, PV systems
I. I
NTRODUCTIONIn general, photovoltaic system generates DC power dependent on the illumination of solar and environmental temperature. It is varied according to the amount of the loads.
In order to provide the maximum power for load, the maximum power tracking algorithm is necessary for PV system. So far, there are roughly PO method, Incremental Conductance (IC) method, Three Points Weighting (TPW) method, and Improved Perturb & Observe (IPO) method are presented [1] - [5] . Firstly, the PO method is the most common scheme to track the maximum power point, but its disadvantage is largely power consumption due to perturbation. Next, the drawback of the IC method is largely operation and the TPW method has the defect of implementation due to the assumption of constant illumination. Finally, a step by step perturbation and tracking is adopted by the IPO method, thus the tracking speed is too slow.
In this paper, a MPO method is proposed. It possesses the features of acceleration tracking speed by adjusting maneuverable perturbation amount and stopping perturb near the maximum power point. So, the problems of power consumption and slow tracking speed can be improved. For verification the effectiveness of the MPO algorithm, a
comparison with above four MPPT methods is presents in this paper.
II. S
YSTEMS
TRUCTUREA
NDM
ODIFIEDP
ERTURB&
O
BSERVE(MPO) M
ETHODA. System Flow Chart
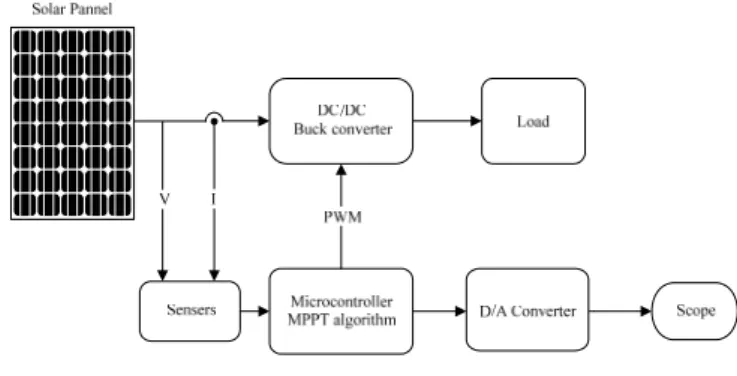
In this paper, a 120W PV system is established to achieve maximum power tracking. Fig.1 shows the system control block diagram. The PV array output supply to the buck converter and the power signal will be calculated by the microcontroller PIC18F4520 after sensing the voltage and current. In order to speed up the computation speed, assembly language is used to implement the MPO algorithm, and PWM signal, which is generated by microcontroller, is used to change the duty cycle while output power of solar panel is controlled by the MPO algorithm to track maximum power.
Fig 1. Control block diagram of photovoltaic system.
B. The MPO Algorithm
The control flowchart of the MPO algorithm is shown in Fig.2 (a)-(c), and the symbols used are listed in table 1. The algorithm operation steps as follows:
1) Sense the solar panel V
inand I
in.
2) Execute the duty cycle accelerate subroutine for increasing or decreasing duty cycle to achieve the purpose of speeding up the perturbation, as shown in Fig.2(b). If│I
in-I
o│
> I
err, increase the duty cycle when V
mpp> V
inor decrease the
duty cycle when V
mpp≤ V
in, otherwise do not change Duty
cycle.
3) Regulate the amount of duty cycle for tracking to the smallest ΔD, this subroutine, as shown in Fig.2(c), is also as operating point to close to the maximum power point.
Determine firstly the P
in, P
in_1and P
in_2, and then decrease ΔD if P
in_1is the largest for minimizing consumption. In addition, if the PV system is under the maximum power point, the algorithm will repeat to crawl two same power values, then ΔD set to zero and stop perturbation.
TABLE I. SYMBOLS OF THE MPOALGORITHM
Symbol Definition symbol Definition Symbol Definition Vin solar panel
voltage Pin_1 older power dDin duty cycle error Iin solar panel
current Pin_2 2nd older
power Din duty cycle
Io older
current Pin_3 3rd older
power Din_1 older duty cycle
Ierr current
error ΔDtemp
duty cycle temporary
value ΔD
variation amount of Duty cycle
dPin Power error ΔDmin
variation amount of minimum duty cycle
Vmpp
maximum power point of voltage
Pin power a
variation amount of ΔD
(a)
(b)
(c)
Fig.2 (a) Flow chart of MPO method, (b) flow chart of duty cycle accelerate subroutine, and (c) flow chart of duty cycle regulate subroutine
In order to accelerate the variation of duty cycle, the duty cycle regulate subroutine (DCRS) is added and shown in Fig.2 (c). Using I
nand I
ocan tell whether the difference rate has exceeded I
error not. If it is greater than I
err, one more duty cycle must be added or reduced, else one more duty cycle need not added or reduced. The first goal of the DCRS is used to tell P
in, P
in_1and
_P
in_2apart. When P
in_1is maximized, ΔD should be reduced in order to minimize the loss of tracking.
The other goal is to judge the power nearby the maximum power point. When the maximum power point is tracked, the power will get the same rate after the second times in DCRS.
Furthermore, when it reaches this condition, ΔD is set to zero
and stops the DCRS. However, power is following changed by
illumination, and then ΔD will be changed into ΔD
minand keep
tracking.
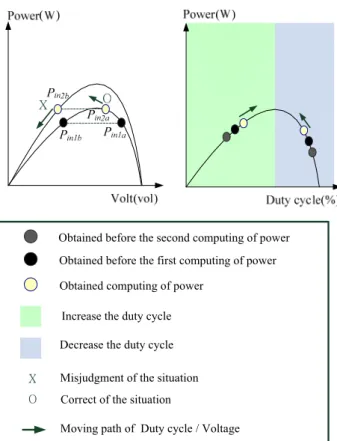
Fig.3 shows the P-V tracking curve of the PO and MPO Methods. The PO method, is shown as left side figure, cannot realize P
in2aor P
in2bwhich is current operating point while illumination vary, it will result in operation error. The duty cycle of the MPO method, is shown as right side figure, can follow with the path of the previous operation while illumination vary, duty cycle changes according to duty variation amount of duty cycle, thus the MPO method doesn’t misread another operating point.
Decrease the duty cycle Increase the duty cycle Obtained computing of power
X Misjudgment of the situation Correct of the situation O
Obtained before the first computing of power
Moving path of Duty cycle / Voltage Obtained before the second computing of power
Fig. 3 P-V tracking Curve of the PO and MPO Methods.
III. S
IMULATIONA
NDE
XPERIMENTAL RESULTSA. Entity Framework
In order to let photovoltaic system can attain five MPPT tracking conditions, some electrical specifications are shown as follow: Illumination of photovoltaic systems 0W/m
2- 242W/m
2, Halogen bulb×4:120V/300W; Solar panel: Voc (Open circuit voltage):20.41V, Short-circuit current: 1.096A, Maximize output of power: 20W: Load: 10Ω. For reducing the PV voltage, a Buck Converter with R-C-D snubber shown in Fig.4 is used in this paper. The buck converter operates in continuous conduction mode and its specifications as follows:
Vin: 10-21V, Vout: 2V-16.8V, Duty cycle 20%-80%, PWM:13.4V(the amplitude of vibration). Fig.5 shows the sensor circuit and MPPT operation circuit. The sensor circuit is used to senses the input voltage and current of the solar panel and transfer to PIC18F4520 for calculating the input power while the MPPT operation circuit is used to programming the MPPT algorithms by using assembly
Fig. 4 Buck Converter with RCD snubber
Fig. 5 Sensor circuit and MPPT operation circuit
B. Simulated Results
For verification the effectiveness of the proposed MPQ algorithm, some simulations are shown as Fig. 6(a) - (e), it can be seen that the MPQ algorithm possesses lower perturbation, lower power consumption, faster tracking and better performance than other MPPT methods.
(b) (a)
(d)
(e)
Fig. 6 Simulation of MPPT in (a) PO method, (b) IC method, (c) TPW method, (d) IPO method, and (e) MPO method.
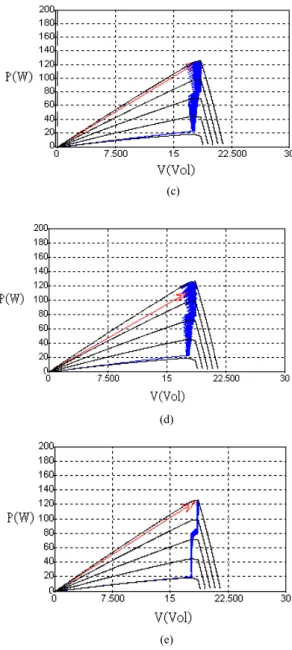
C. Experimenal Results
Fig.7 (a)-(e) shows the P-V curve tracking locus of the PO method, IC method, TPW method, IPO method, and MPO method, respectively.
Fig.7(a) is the movement tracking figure of PO method.
The track locus at first is at right side of the P-V curve, it perturbs largely when it tracking to the maximum power point.
Fig.7(b) shows the tracking effect and few perturbation of the IC method, but it couldn’t balance well and away from the maximum power point. Fig.7(c) shows the track locus of the TPW method. It can be seen that the curve become serrate slope and when it is tracking to the maximum power point, the perturbation is greater than PO method. Fig.7(d) shows the tracking locus of the IPO method which does not possesses the unsteady phenomenon compared with the aforementioned methods, its track speed is very quick and the up-down perturbation is smaller than aforementioned methods.
Fig.7(e) is similar to Fig.7(d). The only difference is the measure of area of perturbation becoming smaller. Fig.7(e) shows the variation and loss of perturbation is smallest while tracking maximum power point, and the MPO method can stop at the nearby of the maximum power point steadily in the same environment condition.
(a)
(b)
(d) (c)
(c)
(e)
Fig. 7 The P-V curve tracking locus of MPPT with (a) PO method, (b) IC method, (c) TPW method, (d) IPO method, and (e) MPO method.
Table II shows the comparison of instruction number of algorithm and the spending time of the MPPT between aforementioned five methods. It can be seen that although the TPW method has shortest spending time of MPPT, it possesses complicated instruction number. The instruction number of the MPO method is close to the PO, IC and IPO methods, but it possesses fewer spending time of tracking the maximum power point, this verify the feasibility of the MPO method.
TABLE II. COMPARISON OF INSTRUCTION NUMBER OF ALGORITHM AND THE SPENDING TIME OF THE MPPT BETWEEN FIVE MPPT METHODS MPPT Instruction No.. Spending Time(nsec ) of MPPT
PO method 10312 3.2
IC method 10322 2.98
TPW method 30933 1.9
IPO method 10337 2.17
MPO method 10396 2.05
IV. C
ONCLUSIONThis paper at first presents a buck converter to establish a photovoltaic system with the maximum power point tracking and supply loading. Furthermore, a Modified Perturb &
Observe (MPO) method is proposed to achieve maximum power point tracking (MPPT) for a PV (photovoltaic) system and to improve the shortcomings of prior methods. The MPO method possesses a conveniently regulated capability of the perturbation, and stopping perturb while tracking to near the maximum power point. Such features can improve the power consumption problem of traditional Perturb & observe (PO) method in the maximum power point, while also increasing the speed of maximum power tracking to increase the system dynamic response.
R
EFERENCES[1] E. Koutroulis, K. Kalaitzakis, and N.C. Voulgaris, “Development of a Microcontroller Based Photovoltaic Maximum Power Point Tracking Control System,” IEEE Trans. On Power Electr., Vol. 16, No. 1, pp. 46- p54, Jan 2001.
[2] Kung-Yen Lee,Jen-Han Niu,and Yu-Cin Huang, “Implementation of Photovoltaic Solar Array Maximum Power Point Tracker and Charger Integrated Circuits”, The 29th SEPE, 2008, p1302-130.
[3] Chia-Hong Chen, “Design and Implementation of a Photovoltaic System with Maximum Power Point Tracking”, Tamkang University, Taiwan,
[4] Tsung-Lieh Hsien , Chao-Hua Tseng , and Kuen-Jia Wang, “The Design of a Versatile Stand-Alone Photovoltaic Charge\Discharge Controller”, 7th Taiwan PECE, 2008, pp. 230-235.
[5] C.H and C.S , ”Control of DC/DC converters for solar energy system with maximum power tracking” , IECON 97. 23rd , 1997, pp. 827-832 vol.2.
[6] Weng W. H., “The study of concentrating Photovoltaic Modules” , NTOU, Taiwan, Republic of China, 2004.
[7] Hua C.C., Lin J.R., and Shen C.M., “Implementation of a DSP- Controlled Photovoltaic System with Peak Power Tracking” IEEE Trans.
on Industrial Electronics, Vol. 45, NO. 1, Feb. 1998.
[8] R. Leyva, C. Alonso, I. Queinnec, A. Cid-Pastor, D. Lagrange, and L.
MartÍnez-Salamero, “MPPT of Photovoltaic Systems using Extremum–
Seeking Control” , IEEE Trans. on Aerosace and Electronic Systems, Vol. 42, NO.1, Jan., 2006.
[9] E. Koutroulis, K. Kalaitzakis, and N.C. Voulgaris, “Development of a Microcontroller Based Photovoltaic Maximum Power Point Tracking Control System”, IEEE Trans. On Power Elect, Vol. 16, NO.1, pp. 46- 54, JAN 2001.
[10] Kung-Yen Lee, Jen-Han Niu, and Yu-Cin Huang, “Implementation of Photovoltaic Solar Array Maximum Power Point Tracker and Charger Integrated Circuits”, the 29th SEPE, pp. 1302-130, 2008.
[11] Pi-Kuang Ku, “Design and Implementation of a Digital High- Performance Photovoltaic Lighting System”, Douliu, Yunlin, Taiwan, Republic of China, June 2006.
[12] Chia-Hong Chen, “Design and Implementation of a Photovoltaic System with Maximum Power Point Tracking”, Tamkang University, Taiwan, Republic of China, June 2001.
[13] Tsung-Lieh Hsien, Chao-Hua Tseng,and Kuen-Jia Wang, “The Design of a Versatile Stand-Alone Photovoltaic Charge\Discharge Controller”, 7th Taiwan PECE, pp. 230-235, 2008.
[14] Szu-Hsien Lee, “DSP-Based Single Phase Small scale Photovoltaic Energy Conversion System”, Department of electrical engineering,
National Sun Yat-Sen University, Taiwan, Republic of China, June 2003.