異常偵測演算法之研究及其應用 研究成果報告(精簡版)
計 畫 類 別 : 個別型
計 畫 編 號 : NSC 98-2221-E-011-104-
執 行 期 間 : 98 年 08 月 01 日至 99 年 07 月 31 日 執 行 單 位 : 國立臺灣科技大學資訊工程系
計 畫 主 持 人 : 李育杰
計畫參與人員: 碩士班研究生-兼任助理人員:李政益 碩士班研究生-兼任助理人員:曾義澄 碩士班研究生-兼任助理人員:陳政翰 博士班研究生-兼任助理人員:葉倚任
報 告 附 件 : 出席國際會議研究心得報告及發表論文
處 理 方 式 : 本計畫涉及專利或其他智慧財產權,1 年後可公開查詢
中 華 民 國 100 年 01 月 03 日
□期中進度報告 異常偵測演算法之研究及其應用
計畫類別: ■個別型計畫 □整合型計畫 計畫編號:NSC 98-2221-E-011-104
執行期間: 98 年 8 月 1 日 至 99 年 7 月 31 日
計畫主持人:李育杰 教授 共同主持人:
計畫參與人員:葉倚任,李政益,曾義澄,陳政翰,蔡育燐
成果報告類型 (依經費核定清單規定繳交): ■精簡報告 □完整報告
本成果報告包括以下應繳交之附件:
□赴國外出差或研習心得報告一份
□赴大陸地區出差或研習心得報告一份
■出席國際學術會議心得報告及發表之論文各一份
□國際合作研究計畫國附研究報告書一份
處理方式: 除產學合作研究計畫、提升產業技術及人才培育研究計畫、列 管計畫及下列情形者外,得立即公開查詢
□涉及專利或其他智慧財產權,■一年 □二年後可公開查詢
執行單位: 台灣科技大學 資訊工程系
中 華 民 國 99 年 10 月 31 日
在資料探勘的領域上,異常偵測 (Anomaly Detection) 是個很重要的議題且被應用在各種 領域之中,如國土安全、信用卡詐欺偵測、網路入侵偵測、網路內部威脅偵測,以及醫療上惡 性腫瘤診斷等方面都有著廣泛的應用。事實上在這些應用中,大多數的可疑行為或特殊跡象都 可能會產生「異常點」,而當前對於「異常點」最為普遍的認知是:在資料集中未遵循預期的 行為或資料分佈之資料點。而在實際的應用上,由於有標記的資料點數量常是少數,且人們感 興趣的這些異常點在資料集中更是稀少,甚至沒有出現過。也因此異常偵測在近期是受到愈來 愈多人的重視。
在這個計畫中,我們研究了現今普遍的異常偵測演算法,如 Local Outlier Factor (LOF) 和 Angle Based Outlier Detection (ABOD),這兩種演算法皆為以資料點為基礎的演算法。但這類 型的演算法由於其過高的計算成本,對於大量的資料集將不敷使用。因此在本計畫中,我們提 出了執行速度更快、效能更優異的異常偵測演算法,以期能更有效地應用於偵測大量資料集。
在實際的應用上面我們提出了一個架構,此架構分為兩階段,即「Data Cleaning」階段及
「On-Line Detection」階段。「Data Cleaning」階段意即給定一個資料集,先使用 “Leave One Out”
的方式檢視個別資料點是否存在於資料集時對模型的影響,再對所有資料點依據其為異常點的 可疑性做排序,濾除掉所有的可疑點。而「On-Line Detection」階段意即利用我們在現有資料 點訓練出的模型進行線上異常點偵測。
最後,我們透過多個數值實驗來驗證我們提出的方法,並且討論該方法的實際應用,如網 路入侵偵測系統,網路應用程式入侵偵測系統及資料庫安全等等。
研究目的
在先前異常偵測的方法中,如 LOF 及 ABOD 等以資料點為基礎的演算法,雖然在異常 偵測上有不錯的效果,但這兩個方法都要維持住所有訓練集內的資料,在線上偵測時納入計 算,因此計算複雜度高,不適用於 On-Line 的應用,僅適於「Data Cleaning」或可有充足時 間之 Off-Line 處理。
因此我們提出一個新的異常偵測演算法,既能做到「Data Cleaning」,且未來在 On-Line 的 應用下,計算速度更快、效能更優異的演算法,並將之付諸於實際的應用如 IDS、 DB Security 上。
提出之技術
我們對於異常點的詮釋為:該資料點的存在於資料集與否會對資料集之模型有很大的影 響。以這種詮釋為基礎,我們提出線上異常偵測的機制,對於新的測試資料點,先計算該資料
其架構敘述如下:首先,我們由多次數值實驗結果的觀察中得知 Principal Component Analysis (PCA) 對異常點非常敏感,異常點的存在會導致資料的主要方向 (Principal Direction) 有很大的偏移。
在資料集受污染的情況下,若以所有點為基礎求 PCA,所找出資料的主要方向,便會受 異常點的影響,方向會往異常點的方向偏移,整個想法可以透過圖二來呈現。
如圖所示,正常點 (藍色點) 形成一個群聚,紅色點代表異常點。首先對所有的資料點作 PCA 時因受到異常點的影響,計算出的主要方向如右圖之綠色明指向線,如果我們移除其中 一個正常點,如右圖群聚內的藍色點,作 PCA 所找出的資料主要方向和剛剛利用所有點找到 資料主要方向兩方向的夾角幾乎為零;可是如果我們移除右圖的紅色點,所找出的主要方向會 如左圖的綠色指向線而改變,和之前利用所有資料點所得到的主要方向則會形成一個較大的夾 角。
換另一個角度來看,左圖正常點形成一個群聚,對所有藍色點找出的主要方向為左圖的綠 色明指向線,如果我們加入一個正常點,如左圖群聚內的藍色點,所找出的主要方向和剛剛利 用所有藍色點找到資料主要方向兩方向的夾角幾乎為零;可是如果我們加入左圖的紅色點,所 找出主要方向會如右圖的綠色指向線改變,和之前利用所有藍色點所得到的主要方向則會形成 一個較大的夾角。
因此,如果把異常點移除,那麼該資料的主要方向便會大大改變;相反地,如果我們把正 常點移除,該資料的主要方向幾乎不會改變。換另一個角度來看,如果加入異常點,那麼該資 料的主要方向便會大大改變;相反地,如果我們加入正常點,該資料的主要方向幾乎不會改變。
換句話說,我們將透過以測量異常點對角度變化之影響為基礎的方法來達到異常偵測的目的。
另外,PCA 為一非監督式之方法,因此在資料分析上以此為核心技術將賦予較大之彈性,並 可應用於更廣之領域與環境。
總上所述,以我們對於異常點的詮釋為基礎,我們提出了以 PCA 為核心技術的異常偵測 演算法。然而,當資料集過大時,該資料點的存在於資料集與否對資料集之模型的影響將不甚 顯著,因此我們將採用多倍取樣 (Over-sampling) 的方式,以放大異常點對主要方向的影響。
並利用線上更新的方式來計算該測試資料點的可疑程度值。此一演算法即為我們提出之 Online Over-sampling PCA。
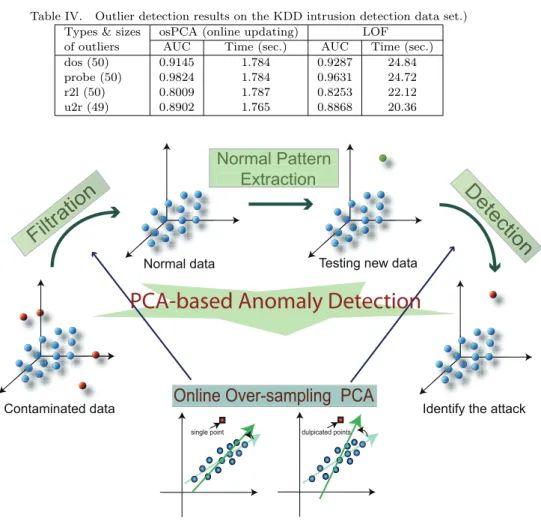
計畫成果
由於 Online Over-sampling PCA 在執行速度上有著非常明顯的改進,因此我們將此演算 法應用於網路入侵偵測之研究中,以期能降低 False Alarm Rate。在實務上,亦可加入正常點 作為 PCA 的主要方向之更新,如此便擁有調整 (Adaptive) 的能力,亦可符合 Real-Time 的需 求。透過這樣的設計,我們提出一個效能足敷需求的 Online NIDS 架構。
另外對於網路應用層 (Application Layer) 資料庫的查詢使用,我們也將針對呼叫頻率,
SQL 語法運用的異常偵測等特徵,運用機器學習及資料探勘的技術,提出一個資料庫不當查 詢的警示機制,如此可以防範內外部不同型式的入侵或不當使用行為,並可以解決資料庫使用 效能低落及嚴重的資料竊取問題。
本計畫提出之異常偵測演算法及其架構整理成學術論文 (如下頁所示),並發表至國際著 名研討會 First KES International Symposium on Intelligent Decision Technologies (IDT'09),
2009。且目前送交至國際著名期刊 ACM Transactions on Knowledge Discovery from Data 審 核。另有相關研究成果「Periodic Step-Size Adaptation for Single-Pass On-line Learning」發表於 The Neural Information Processing Systems (NIPS),2009。
Yi-Ren Yeh Academia Sinica Yuh-Jye Lee
National Taiwan University of Science and Technology and
Yu-Chiang Frank Wang Academia Sinica
Anomaly (or outlier) detection has been an important research topic in data mining and machine learning. Many real-world applications such as intrusion or credit card fraud detection require an effective and efficient framework to identify deviated instances from large amount of data. Existing anomaly detection methods are typically implemented in batch mode, and thus cannot be easily generalized to large-scale problems without sacrificing computation and memory requirements.
We propose an online over-sampling principal component analysis (osPCA) algorithm, which over- samples a target instance and extracts the principal direction of the entire data. The outlierness (anomaly) of the target instance is determined based on the variation of the calculated dominant eigenvectors. Besides providing theoretical background and insights into this PCA-based anomaly detection approach, we also present an online updating technique to approximate the solution to osPCA, and our method need not perform eigen analysis or store the entire data covariance matrix for each target instance. Therefore, our proposed method can be implemented in both batch and online modes, and thus is favored for applications which have particular computation or memory limitations. Compared with the well-known power method for PCA and other popular anomaly detection algorithms, our experimental results verify the feasibility of our proposed framework in terms of both accuracy and efficiency.
Categories and Subject Descriptors: H.2.8 [Database Applications]: Data mining
Additional Key Words and Phrases: Principal component analysis, anomaly detection, least squares, over-sampling, online updating
Author’s address: Y.-R. Yeh, Research Center for Information Technology Innovation, Academia Sinica, Taipei, Taiwan 11529; email: [email protected]; Y.-J. Lee, Department of Computer Science and Information Engineering, National Taiwan University of Science and Technology, Taipei, Taiwan 10607; email: [email protected]; Y.-C. F. Wang, Research Center for Information Technology Innovation and Institute of Information Science, Academia Sinica, Taipei, Taiwan 11529; email: [email protected].
Permission to make digital/hard copy of all or part of this material without fee for personal or classroom use provided that the copies are not made or distributed for profit or commercial advantage, the ACM copyright/server notice, the title of the publication, and its date appear, and notice is given that copying is by permission of the ACM, Inc. To copy otherwise, to republish, to post on servers, or to redistribute to lists requires prior specific permission and/or a fee.
⃝ 20YY ACM 0000-0000/20YY/0000-0001 $5.00c
ACM Journal Name, Vol. V, No. N, Month 20YY, Pages 1–0??.
1. INTRODUCTION
Anomaly (or outlier) detection aims to identify a small group of instances which deviate remarkably from the existing data. A well-known definition of “outlier” is given by Hawkins [Hawkins 1980]: “an observation which deviates so much from other observations as to arouse suspicions that it was generated by a different mech- anism,” which gives the general idea of an outlier and motivates many anomaly de- tection methods [Breunig et al. 2000; Chandola et al. 2009; Hawkins 1980; Huang et al. 2007; Kriegel et al. 2008; Lazarevic et al. 2003]. Practically, anomaly de- tection can be found in applications such as homeland security, credit card fraud detection, intrusion and insider threat detection in cyber-security, fault detection, or malignant diagnosis [Huang et al. 2007; Lazarevic et al. 2003; Rawat et al. 2006;
Wang et al. 2004; Chandola et al. 2009]. However, since only a limited amount of labeled data are available in the above real-world applications, how to deter- mine and anomaly of unseen data (or events) draws attention from the researchers in data mining and machine learning communities [Hawkins 1980; Breunig et al.
2000; Lazarevic et al. 2003; Huang et al. 2007; Kriegel et al. 2008; Chandola et al.
2009].
Despite the rareness of the deviated data, its presence might enormously affect the solution model such as the distribution or principal directions of the data. For example, the calculation of data mean or the least squares solution of the associated linear regression formulation are both sensitive to outliers. As a result, anomaly detection becomes a very challenging task, since one needs to solve an unsupervised yet unbalanced data learning problem. In this paper, we propose an online outlier detection algorithm based on principal component analysis (PCA). We observe that adding (or removing) an abnormal data instance will cause a large variation of principal directions than adding (or removing) a normal one does. Thus, by applying the “Leave One Out” (LOO) procedure on the entire data set, we are able to evaluate the outlierness of each individual data point by calculating the variation of principal directions. More precisely, our idea is to first calculate the dominant eigenvector of all data instances, then another PCA analysis is performed on the entire data set without the target data instance present. The difference between these two eigenvectors indicates the anomaly of the target instance. By ranking the difference scores of all data points, one can identify the outlier data by a pre-defined threshold or a pre-determined portion of the data.
We note that the above framework can be considered as a decremental PCA based approach for anomaly detection. While it works well for applications with moderate dataset size, the variation of principal directions might not be significant when the size of the dataset is large. In such cases (e.g. real-world anomaly detection problems dealing with large-scale data), adding or removing one target instance only produces negligible difference in eigenvectors. To address this issue, we advance the
“over-sampling” strategy to duplicate the target instance, and we perform an over- sampling PCA (osPCA) on such an over-sampled dataset. It is obvious that the effect of an outlier instance will be amplified due to its duplicates present in the PCA formulation, and this makes the detection of outlier data easier. However, this LOO anomaly detection procedure with an over-sampling strategy will markedly increase the computational load, since one needs to keep a dense covariance matrix and solves
ACM Journal Name, Vol. V, No. N, Month 20YY.
one PCA formulation for each data point of interest. This will prohibit the use of our proposed framework for real-world applications. In this paper, we provide two strategies to alleviate this practical problem. The first strategy we apply is the power method, which is known to produce approximated solutions to PCA.
However, this method requires the storage of the covariance matrix, and cannot be easily extended to applications with streaming data. Therefore, we further propose an online updating method for calculating dominant eigenvectors, while computational costs and memory requirements are significantly reduced compared to prior PCA methods. As a result, our proposed online osPCA can not only be generalized large-scale problems, it is also feasible in streaming data or problems with require to be solved in online mode. Detailed derivations and discussions of our online osPCA will be presented in Section 4.
The remaining of this paper is organized as follows. Section 2 reviews prior anomaly detection methods. Our over-sampling PCA for anomaly detection, in- cluding its theoretical background, is introduced in Section 3. Section 4 details the proposed online updating technique for osPCA, and explains why this technique is computationally preferable to prior anomaly detection methods. Section 5 presents the experimental results, including comparisons with prior approaches. Finally, Section 6 concludes this paper.
2. RELATED WORK
In the past, many outlier detection methods have been proposed [Angiulli et al.
2006; Barnett and Lewis 1994; Breunig et al. 2000; Hawkins 1980; Jin et al. 2006;
Khoa and Chawla 2010; Knox and Ng 1998; Kriegel et al. 2009; Kriegel et al. 2008].
Typically, these existing approaches can be divided into three categories: distribu- tion (statistical), distance and density based methods. Statistical approaches [Bar- nett and Lewis 1994; Hawkins 1980] assume that the data follows some standard or predetermined distributions, and this type of approach aims to find the outliers which deviate form such distributions. However, most distribution models are as- sumed univariate, and thus the lack of robustness for multidimensional data is a concern. Moreover, since these methods are typically implemented in the original data space directly, their solution models might suffer from the noise present in the data. Nevertheless, the assumption or the prior knowledge of the data distribution is not easily determined for practical problems.
For distance-based methods [Angiulli et al. 2006; Khoa and Chawla 2010; Knox and Ng 1998], the distances between each data point of interest and its neighbors are calculated. If the result is above some predetermined threshold, the target instance will be considered as an outlier. While no prior knowledge on data distribution is needed, these approaches might encounter problems when the data distribution is complex (e.g. multi-clustered structure). In such cases, this type of approach will result in determining improper neighbors, and thus outliers cannot be correctly identified.
To alleviate the aforementioned problem, density-based methods are proposed [Breunig et al. 2000; Jin et al. 2006]. One of the representatives of this type of approach is to use a density-based local outlier factor (LOF) to measure the outlierness of each data instance [Breunig et al. 2000]. Based on the local density
ACM Journal Name, Vol. V, No. N, Month 20YY.
of each data instance, the LOF determines the degree of outlierness, which provides suspicious ranking scores for all samples. The most important property of the LOF is the ability to estimate local data structure via density estimation. This allows users to identify outliers which are sheltered under a global data structure. However, it is worth noting that the estimation of local data density for each instance is very computationally expensive, especially when the size of the dataset is large.
Besides the above work, some anomaly detection approaches are recently pro- posed [Aggarwal and Yu 2001; Kriegel et al. 2008; Kriegel et al. 2009]. Among them, the angle-based outlier detection (ABOD) method [Kriegel et al. 2008] is very unique. They proposed to calculate the variation of the angles between each target instance and the remaining data points, since they observed that an outlier will produce a smaller angle variance than the normal ones do. It is not surpris- ing that the major concern of ABOD is the computation complexity due a huge amount of instance pairs to be considered. Consequently, a fast ABOD algorithm is proposed to generate an approximation of the original ABOD solution. The dif- ference between the standard and the fast ABOD approaches is that the latter only considers the variance of the angles between the target instance and its k nearest neighbors. However, the search of the nearest neighbors still prohibits its extension to large-scale problems (batch or online modes), since the user will need to keep all data instances to calculate the required angle information.
3. ANOMALY DETECTION VIA PRINCIPAL COMPONENT ANALYSIS
We first briefly review the PCA algorithm in Section 3.1. Based on the leave- one-out (LOO) strategy, Section 3.2 presents our study on the effect of outliers on the derived principal directions, followed by theoretical backgrounds provided in Section 3.3.
3.1 Principal Component Analysis
PCA is a well known unsupervised dimension reduction method, which determines the principal directions of the data distribution. To obtain these principal direc- tions, one needs to construct the data covariance matrix and calculate its dominant eigenvectors. These eigenvectors will be the most informative among the vectors in the original data space, and are thus considered as the principal directions. Let A = [x⊤1; x⊤2;· · · ; x⊤n] ∈ Rn×p, where each row xi represents a data instance in a p dimensional space, and n is the number of the instances. Typically, PCA is formulated as the following optimization problem
max
U∈Rp×k,∥U∥=I
∑n i=1
U⊤(xi− µ)(xi− µ)⊤U, (1) where U is a matrix consisting of k dominant eigenvectors. From this formulation, one can see that the standard PCA can be viewed as a task of determining a subspace where the projected data has the largest variation.
Alternatively, one can approach the PCA problem as minimizing the data recon- struction error, i.e.
min
U∈Rp×k,∥U∥=IJ (U) =
∑n i=1
∥(xi− µ) − UU⊤(xi− µ)∥2, (2)
ACM Journal Name, Vol. V, No. N, Month 20YY.
where U⊤(xi − µ) determines the optimal coefficients to weight each principal directions when reconstructing the approximated version of (xi−µ). Generally, the problem in either (1) or (2) can be solved by deriving an eigenvalue decomposition problem of the covariance data matrix, i.e.
ΣAU = UΛ, (3)
where
ΣA= 1 n
∑n i=i
(xi− µ)(xi− µ)⊤ (4)
is the covariance matrix, µ is the global mean. Each column of U represents an eigenvector of ΣA, and the corresponding diagonal entry in Λ is the associated eigenvalue. For the purpose of dimension reduction, the last few eigenvectors will be discarded due to their negligible contribution to the data distribution.
It is worth noting that, PCA requires the calculation of global mean and data covariance matrix, which are sensitive to the presence of outliers; in such cases, the variation of the principal direction will be significant. In other words, if there are outliers present in the data, the dominant eigenvectors of PCA will be remarkably affected by them. We will further discuss this issue in the following subsections, and explain how we advance this property for anomaly detection.
3.2 The Effect of An Outlier on Principal Directions
In this section, we study the variation of principal directions when we remove or add a data instance, and how we utilize this property to determine the outlierness of the target data point.
We use Figure 1 to illustrate the above observation. We note that the clustered blue circles in Figure 1 represent normal data intances, the red square denotes an outlier, and the green arrow is the dominant principal direction. From Figure 1, we see that the principal direction is deviated when an outlier instance is added.
More specifically, the presence of such an outlier instance produces a large angle between the resulting and the original principal directions. On the other hand, this angle will be small when a normal data point is added. Therefore, we will use this property to determine the outlierness of the target data point using the LOO strategy.
We now present the idea of coming PCA and the LOO strategy for anomaly detection. Given a data set A with n data instances, we first extract the dominant principal direction u from it. If the target instance is xt, we next compute the leading principal direction ˜ut without xt present (which is known as decremental PCA). Hence, we need to evaluate such a decremental PCA problem n times in the LOO procedure:
ΣA˜u˜t= λ˜ut, (5)
where ˜A = A/{xt}. We note that ˜µ is the mean of ˜A, and thus ΣA˜ = 1
n− 1
∑
xi∈A/{xt}
(xi− ˜µ)(xi− ˜µ)⊤. (6)
ACM Journal Name, Vol. V, No. N, Month 20YY.
Remove an outlier
Add an outlier
Remove a normal data point
Add a normal data point
Fig. 1. The effect of adding/removing an outlier or a normal data instance on the principal direction.
Once these eigenvectors ˜ut are obtained, we use the absolute value of cosine simi- larity to measure the variation of the principal directions, i.e.
st= 1− | ⟨˜ut, u⟩
∥˜ut∥∥u∥|. (7)
We note that, for the target instance xt, stcan be considered as a distance metric, or a “score of outlierness” to indicate the anomaly of xt. A higher stscore (closer to 1) means that the target instance is more likely to be an outlier. This process can be considered as a decremental PCA with LOO scheme for anomaly detection.
In contrast with decremental PCA, we also consider the use of incremental PCA for outlier detection. This strategy is preferable in online anomaly detection ap- plications, in which we need to determine whether a newly received data instance is an outlier. If the recently received data points are normal ones, adding such instances will not significantly affect the principal directions (and vice versa). The incremental PCA can be formulated as follows
ΣA˜u˜t= λ˜ut, (8)
where ˜A = A∪ {xt}. Again, ˜µ is the mean of ˜A, and we have ΣA˜ = 1
n + 1
∑
xi∈A
(xi− ˜µ)(xi− ˜µ)⊤+ 1
n + 1(xt− ˜µ)(xt− ˜µ)⊤. (9) Similarly, we check the score st of each newly received instance and determine its
ACM Journal Name, Vol. V, No. N, Month 20YY.
outlierness accordingly. Note that these scores can be viewed as the influence of instances in estimating PCA directions. We also discuss the theoretical background for the influence of an instance to support our proposed method in the following.
3.3 Theoretical Backgrounds of Anomaly Detection Algorithms Based on PCA In robust statistics, the study of sensitivity to small changes in an underlying dis- tribution can be made through the determination of influence function (IF) [Jolliffe 2002; Hampel et al. 1986]. The output of this function indicates the variation of data estimator (e.g. calculated dominant eigenvectors in our case) when the data distribution is changed. Let θ be an estimator of a distribution F , and T (F ) be a function of the distribution F which represents an operation for estimating the parameters θ of F . Suppose that the distribution F is perturbed as follows
F = (1˜ − ϵ)F + ϵδy,
where ϵ is a small positive value. Note that y is a random vector, and δy is the perturbing distribution which denotes the probability measure which gives mass 1 to y (i.e. the perturbation distribution only occurs at y). The introduction of the perturbation distribution δyin IF implies the use of target instances in our anomaly detection algorithm.
The influence function (IF) for θ evaluated at y by given a distribution F is defined as
IF(y; F, T ) = lim
ϵ→0
T ((1− ϵ)F + ϵδy)− T (F )
ϵ . (10)
This function provides the variation of the estimator θ to a small amount of pertur- bation δy to the data. A large inference function output implies the perturbation δyis quite different from the the original data distribution. We note that y in (10) can be considered as the target instance (in our LOO scenario), and the function T is the calculation of principal directions of the data. While the IF output indicates the deviation of δy, we compute the variation of the resulting principal direction as the score of outlierness, which is used for us to rank and to determine the outlierness of the target instance.
4. OVER-SAMPLING PCA FOR ANOMALY DETECTION
Practically, it might not be easy to observe the variation of principal directions caused by an outlier, if the data set size is large. Furthermore, in the above incre- mental PCA framework for anomaly detection, we need to perform n PCA analysis for a data set with n data instances in a p-dimensional space, which is not computa- tionally feasible for large-scale problems. This is why we propose an over-sampling PCA (osPCA), together with an online updating strategy for anomaly detection.
In Section 4.1, we introduce our osPCA, and discuss how and why we are able to detect the presence of abnormal data instances, even when the size of data is large. As noted above, together with the LOO and over-sampling schemes for the target instance, one would encounter severe computational costs and memory re- quirements, which will prevent practical large-scale problems with online settings.
In Section 4.2, the well-known power method [Golub and Golub 1983] is applied to determine the principal direction without the need to solve each eigenvalue decom- position problem. While this power method alleviates the aforementioned problems,
ACM Journal Name, Vol. V, No. N, Month 20YY.
we will discuss its limitations and why we advance a least squares approximation of osPCA. Our proposed an online updating algorithm for osPCA is detailed in Section 4.3.
4.1 Over-Sampling Principal Components Analysis (osPCA)
As mentioned earlier, when the size of the dataset is large, adding (or removing) a single outlier instance will not significantly change the principal direction of the data distribution. Furthermore, for problems where all data instances (normal and deviated ones) are present (i.e. not in a streaming setting), it is not clear how to apply an incremental PCA to address the anomaly detection problem. Furthermore, Therefore, we integrate the over-sampling and LOO strategies together with the incremental PCA, and propose an online over-sampling PCA (osPCA) algorithm for large-scale anomaly detection problems.
Our osPCA algorithm will amplify the effect of an outlier instance and thus make the detection of outlier data easier. Suppose that we over-sample the target instance ˜n times, the associated PCA can be formulated as follows
ΣA˜u˜t= λ˜ut, (11) where ˜A = A∪ {xt, . . . , xt} ∈ R(n+˜n)×p. The mean of ˜A is ˜µ, and thus
ΣA˜ = 1 n + ˜n
∑
xi∈A
(xi− ˜µ)(xi− ˜µ)⊤+ 1 n + ˜n
˜
∑n i=1
xtx⊤t − ˜µ ˜µ⊤. (12)
In this osPCA framework, we will duplicate the target instance ˜n times (e.g. 10%
of the size of the original data set), and we will compute the score of outlierness st
of that target instance, as defined in (7). If this score is above some predetermined threshold, we will consider this instance as an outlier. With this over-sampling strategy, if the target instance is a normal data (see Fig. 2a for example), we will observe negligible changes in the principal directions and the mean of the data. The case of over-sampling an abnormal instance is shown in Fig. 2b. It is clear that our approach will amplify its effect on the derived principal direction. Therefore, our method not only determines the anomaly of newly received data, it can also be applied to detect outliers from existing data.
Clearly, the major concern is the computation cost of calculating or updating the principal directions in large-scale problems. We will discuss this issue and propose our solutions in the following sections.
4.2 The Power Method for osPCA
Typically, solutions to PCA is determined by solving an eigenvalue decomposition problem. In the LOO scenario, one will need to solve the PCA and to calculate the principal directions n times for a data set with n instances. This is very computa- tionally expensive, and prohibits the practical use of such a framework for anomaly detection.
It can be observed that, in the PCA formulation with the LOO setting, it is not necessary to re-compute the covariance matrices for each PCA. This is because when we duplicate a data point of interest, the difference between the updated covariance matrix and the original one can be easily determined. Let Q = AAn⊤ be
ACM Journal Name, Vol. V, No. N, Month 20YY.
(a) Over-sampling a normal data point
single point dulpicated points
(b) Over-sampling an outlier
dulpicated points single point
Fig. 2. The effect of an over-sampled normal data or outlier instance on the principal direction.
the outer product matrix and xt be the target instance (to be over-sampled), we use the following technique to update the mean ˜µ and the covariance matrix ΣA˜:
˜
µ = µ + r· xt
1 + r (13)
and
ΣA˜ = 1
1 + rQ + r
1 + rxtx⊤t − ˜µ ˜µ⊤, (14) where r < 1 is the parameter controlling the size when over-sampling xt. From (14), we can see that one only needs to keep the matrix Q when calculating ΣA˜, and there is no need to re-compute the entire covariance matrix in this LOO framework.
Once the update covariance matrix ΣA˜ is obtained, the principal directions can be obtained by solving the eigenvalue decomposition problem of each of the ma- trices ΣA˜. In order to alleviate this computation load, we apply the well-known power method [Golub and Golub 1983], which is a simple iterative algorithm and does not compute matrix decomposition. This method starts with an initial nor- malized vector u0, which could be an approximation of the dominant eigenvector or a nonzero random vector. Next, the new uk+1 (a better approximated version
ACM Journal Name, Vol. V, No. N, Month 20YY.
of the dominant eigenvector) is updated by uk+1= ΣA˜uk
∥ΣA˜uk∥. (15)
The sequence{uk} converges under the assumption that the dominant eigenvalue of ΣA˜ is markedly larger than others. From (15), it is clear that the power method only requires matrix multiplications, not decompositions; therefore, the use of the power method can alleviate the computation cost in calculating the dominant prin- cipal direction. We note that one could use the deflation process [Golub and Golub 1983] if other principal directions besides the dominant one need to be determined.
In our anomaly detection framework, we only consider the first principal component and evaluate its variation in computing the score of outlierness of each sample.
4.3 Least Squares Approximation and Online Updating for osPCA
In the previous subsection, we apply a matrix update technique in (14) and the power method to solve our over-sampling PCA for outlier detection. However, the major concern of the power method is that it does not guarantee a fast convergence, even if we use prior principal directions as its initial solutions. Moreover, the use of power method still requires the user to keep the entire covariance matrix, which prohibits the problems with high dimensional data or with limited memory resources. Inspired by [Yang 1995; Papadimitriou et al. 2005], we propose an online updating algorithm to calculate the dominant eigenvector when over-sampling a target instance. We now discuss the details of our proposed algorithm.
Recall that, in Section 3, PCA can be considered as a problem to minimize the reconstruction error
min
U∈Rp×k,∥U∥=IJ (U) =
∑n i=1
∥¯xi− UU⊤¯xi∥2, (16)
where ¯xi is (xi− µ), U is the matrix consisting of k dominant eigenvectors, and UU⊤¯xi is the reconstructed version of ¯xi using the eigenvectors in U. The above reconstruction error function can be further approximated by a least squares form [Haykin 1991]:
min
U∈Rp×k,∥U∥=IJls(U) =
∑n i=1
∥¯xi− Uyi∥2, (17)
where U′ is the approximation of U, and thus yi = U′⊤x¯i ∈ Rk is the approx- imation of the projected data U⊤x¯i in the lower k dimensional space. Based on this formulation, the reconstruction error has a quadratic form and is a function of U, which can be computed by solving a least squares problem. The trick for this least squares problem is the approximation of U⊤x¯i by yi = U′⊤¯xi. In an online setting, we update the current U⊤tx¯iby the previous solution U⊤t−1x¯i as follows
min
Ut∈Rp×k,∥U∥=IJls(Ut) =
∑t i=1
∥¯xi− Utyi∥2, (18)
where yi = U⊤t−1x¯i. This projection approximation provides a fast calculation of principle directions in our over-sampling PCA. Linking this least squares form to
ACM Journal Name, Vol. V, No. N, Month 20YY.
our online over-sampling strategy, we have
˜ min
U∈Rp×k,∥ ˜U∥=IJls( ˜U)≈
∑n i=1
∥¯xi− ˜Uyi∥2+∥¯xt− ˜Uyt∥2. (19)
In (19), yt is approximated by U⊤x¯t, where U is the solution of the original PCA (which can be calculated in advance), and ¯xt is the target instance. When over- sampling the target instance ˜n times, we approximate the solution ˜U by solving the following optimization problem
min
U˜∈Rp×k,∥ ˜U∥=IJls( ˜U)≈
∑n i=1
∥¯xi− ˜Uyi∥2+ ˜n∥¯xt− ˜Uyt∥2. (20)
Equivalently, we convert the above problem into the following form
˜ min
U∈Rp×k,∥ ˜U∥=IJls( ˜U)≈ β(
∑n i=1
∥¯xi− ˜Uyi∥2) +∥¯xt− ˜Uyt∥2, (21)
where β can be regarded as a weighting factor to suppress the information from existing data. Note that the relation between β and the over-sampled number ˜n is β = n1˜ = nr1, where r is the ratio of the over-sampled number over the size of the original dataset. To improve the convergence rate, we use the solution of the original PCA (without over-sampling data) as the initial projection matrix in (21).
If only the dominant principal direction (i.e. k = 1) is of concern, we calculate the solution of ˜u by taking the derivative of (21) with respect to ˜u, and thus we have
u =˜ β(
∑n i=1
yix¯i) + ytx¯t
β(
∑n i=1
y2i) + yt2
. (22)
We note that (22) provides an effective and efficient updating technique for os- PCA, which allows us to determine the principal direction of the data. This updat- ing process makes anomaly detection in online or streaming data settings feasible.
More importantly, since we only need to calculate the solution of the original PCA offline, we do not need to keep the entire covariance or outer matrix in the en- tire updating process. Once the final principal direction is determined, we use the cosine similarity to determine the difference between the current solution and the original one (without over-sampling), and thus the score of outlierness for the target instance can be determined accordingly (as discussed in Section 3.2).
The pseudo code of our osPCA with the LOO strategy for outlier detection is described in Algorithm 1. It is worth noting that we only need to compute xproj
and y once in Algorithm 1, and thus we can further reduce the computation time in the determination of ˜u. Table I compares the computation complexity and mem- ory requirements of the power method and our proposed online updating algorithm for osPCA. Suppose that the power method needs to perform (15) iteratively with m times, its time complexity in the entire LOO procedure for outlier detection is O(n2p2+nmp2) (we have O(n2p2) for deriving n covariance matrices, and O(nmp2) for the implementation of the power method). Practically, we reduce the above com- plexity to O(nmp2) by applying the covariance update trick in (14). The memory
ACM Journal Name, Vol. V, No. N, Month 20YY.
Algorithm 1: Anomaly Detection via Online Over-sampling PCA Input: The data matrix A = [x⊤1; x⊤2;· · · ; x⊤n] and the weight β.
Output: Score of outlierness s = [s1s2· · · sn]. If si is higher than a threshold, xi is an outlier.
Compute first principal direction u by using (18);
Keep ¯xproj =
∑n j=1
yjx¯j and y =
∑n j=1
y2j in (22);
for i← 1 to n do u˜ ← β ¯xprojβy+y+y2i¯xi
i
by (18);
si← 1 − |∥˜u∥∥u∥⟨ ˜w,w⟩| by (7);
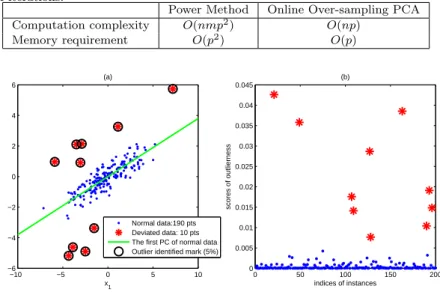
Table I. Comparisons of the power method and our proposed online osPCA for anomaly detection in terms of computational complexity and memory requirements. Note that m indicates the number of iterations.
Power Method Online Over-sampling PCA
Computation complexity O(nmp2) O(np)
Memory requirement O(p2) O(p)
−10 −5 0 5 10
−6
−4
−2 0 2 4 6
x1
2
(a)
Normal data:190 pts Deviated data: 10 pts The first PC of normal data Outlier identified mark (5%)
0 50 100 150 200
0 0.005 0.01 0.015 0.02 0.025 0.03 0.035 0.04 0.045
indices of instances
scores of outlierness
(b)
Fig. 3. The result of identifying outliers in the 2-D synthetic data.
requirement of applying power method is O(p2) because the covariance matrix is always needed. In our online updating approach, the updating of the principal direction is done point-wisely, and thus the LOO procedure only results in O(np) and O(p) for the computation complexity and memory requirement, respectively.
5. EXPERIMENTAL RESULTS
5.1 Anomaly Detection on Synthetic and Real-world Data
5.1.1 2D synthetic data set. To verify the feasibility of our proposed algorithm, we conduct experiments on both synthetic and real data sets. We first generate a 2-D synthetic data, which consists of 190 normal instances (shown in blue dots in
ACM Journal Name, Vol. V, No. N, Month 20YY.
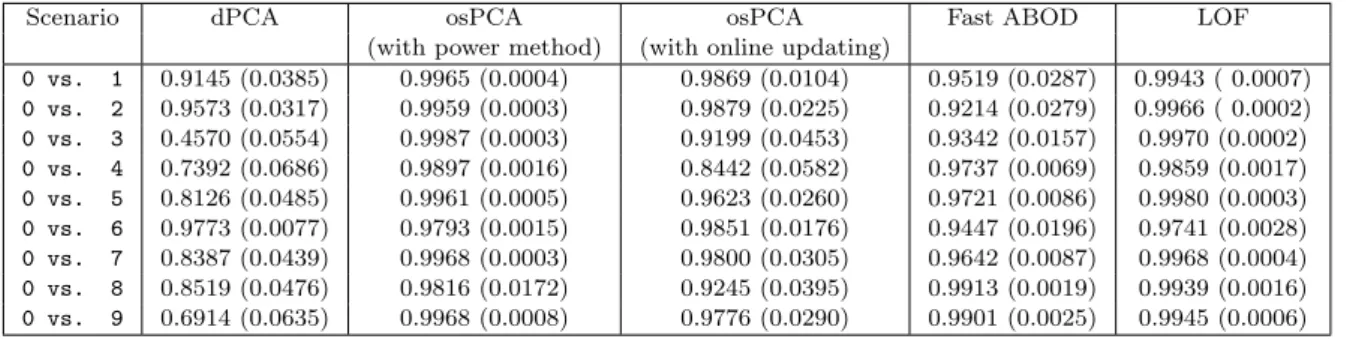
Table II.The AUC scores of decremental PCA (dPCA), over-sampling PCA (osPCA) with power method, our osPCA with online updating algorithm, fast ABOD, and LOF on the pendigits data set.
Scenario dPCA osPCA osPCA Fast ABOD LOF
(with power method) (with online updating)
0 vs. 1 0.9145 (0.0385) 0.9965 (0.0004) 0.9869 (0.0104) 0.9519 (0.0287) 0.9943 ( 0.0007) 0 vs. 2 0.9573 (0.0317) 0.9959 (0.0003) 0.9879 (0.0225) 0.9214 (0.0279) 0.9966 ( 0.0002) 0 vs. 3 0.4570 (0.0554) 0.9987 (0.0003) 0.9199 (0.0453) 0.9342 (0.0157) 0.9970 (0.0002) 0 vs. 4 0.7392 (0.0686) 0.9897 (0.0016) 0.8442 (0.0582) 0.9737 (0.0069) 0.9859 (0.0017) 0 vs. 5 0.8126 (0.0485) 0.9961 (0.0005) 0.9623 (0.0260) 0.9721 (0.0086) 0.9980 (0.0003) 0 vs. 6 0.9773 (0.0077) 0.9793 (0.0015) 0.9851 (0.0176) 0.9447 (0.0196) 0.9741 (0.0028) 0 vs. 7 0.8387 (0.0439) 0.9968 (0.0003) 0.9800 (0.0305) 0.9642 (0.0087) 0.9968 (0.0004) 0 vs. 8 0.8519 (0.0476) 0.9816 (0.0172) 0.9245 (0.0395) 0.9913 (0.0019) 0.9939 (0.0016) 0 vs. 9 0.6914 (0.0635) 0.9968 (0.0008) 0.9776 (0.0290) 0.9901 (0.0025) 0.9945 (0.0006)
Fig. 3a) and 10 deviated instances (red stars in Fig. 3a). The normal data points are sampled from the following multivariate normal distribution:
x ∼ N(µ, Σ), (23)
where
[µ]
= [µ1
µ2
]
= [0
0 ]
and Σ = [5 2
2 1 ]
.
We note that each deviated data point is sampled from a different multivariate normal distribution N (µd, Σ), where µd= [µd1, µd2]⊤, µd1 and µd2are randomly sampled from the range [−5, 5]. We apply our online osPCA algorithm on the entire data set, and rank the score of outlierness (i.e. stin Section 3.2) accordingly.
We aim to identify the top 5% of the data as deviated data, since this number is consistent with the number of outliers we generated. The scores of outlierness of all 200 data points are shown in Fig. 3b. It is clear that the scores of the deviated data (shown in red) are clearly different from those of normal data, and thus all outliers are detected by setting a proper threshold to filter the top 5% of the data.
Note that we mark the filtered data points with black circles in Fig. 3a. This initial result on a simple synthetic data set shows the effectiveness of our proposed algorithm.
5.1.2 UCI and KDD datasets. Next, we evaluate the proposed method on two real data sets: pendigits data set from the UCI Repository of machine learning data archive [Asuncion and Newman 2007], and the KDD intrusion detection data set1. For the pendigits data set, we consider the digit “0” as the normal data instances (a total of 780 instances) and use other digits “1” to “9” (20 data samples randomly chosen for each category) as the outliers to be detected. To compare the performance of our work with other methods, we implement decremental PCA (i.e. removing one target instance in LOO scenario), over-sampling PCA with power method, local outlier factor (LOF) [Breunig et al. 2000] and fast angle-based outlier detection (ABOD) [Kriegel et al. 2008]. We use the area under the ROC
1The KDD intrusion detection dataset is avaiable at http://kdd.ics.uci.edu/databases/
kddcup99/kddcup99.html
ACM Journal Name, Vol. V, No. N, Month 20YY.


![Table 4 shows the results. To obtain the empirical optimal error rate of our LeNet-S model, we ran plain SGD with sufficient passes and obtained 0.99% error rate at convergence, slightly higher than LeNet-5’s 0.95% [18]](https://thumb-ap.123doks.com/thumbv2/9libinfo/9125142.409560/32.918.210.709.649.740/table-results-empirical-optimal-sufficient-obtained-convergence-slightly.webp)
