因應氣候變遷遙連結
應用於新興治水策略之研究(1/2)
The application of telecoupling in emerging water management strategy under climate change
主辦機關:經濟部水利署 執行單位:國立臺灣大學
中華民國 108 年 12 月
MOEAWRA1080421
因應氣候變遷遙連結
應用於新興治水策略之研究(1/2)
The application of telecoupling in emerging water management strategy under climate change
主辦機關:經濟部水利署
執行單位:國立臺灣大學
計畫主持人:林裕彬
摘要
一、前言
隨著全球化的發展,社會、經濟與自然環境間具有交互影響的關係,而 全球暖化下的氣候變遷情勢,使跨域水資源管理、環境污染等議題也從而顯 現。臺灣經濟型態亦深受全球化效應影響,民眾更易聚集於經濟活動較頻繁 的區域,使得都市化的情況加劇;極端氣候條件下的降雨事件,其強度與頻 率均較以往劇烈,進而衍生更為嚴峻的區域淹水問題,107 年 0823 熱帶低 壓暴雨引致的南部地區淹水災情即是明證。此外,由於氣候變遷不確定性因 素較多,評估降低氣候變遷所造成的影響時,應以風險管控為出發點,並採 取分散式的調適策略為宜。
本計畫主要目的為結合遙連結與氣候模式及全球經濟模式,結合土地 利用變遷模式,模擬不同情境下之土地利用空間分布,再利用結合遙連結與 氣候模式探討區域遙連結對未來氣候型態及降雨強度之分析結果,藉由淹 水模式模擬可能之淹水情形,本計畫建構分散式治水雛形架構,將不同之土 地利用策略、國土規劃情境與治水策略帶入所建構之模式,以示範區域為例 測試所建立之雛型架構。此外,本計畫亦將評析目前國土規劃與依據結合遙 連結與全球經濟模式所分析之未來土地利用之差異,本計畫之概念圖及各 工作項目之關聯性如摘圖 1 及摘圖 2 所示。
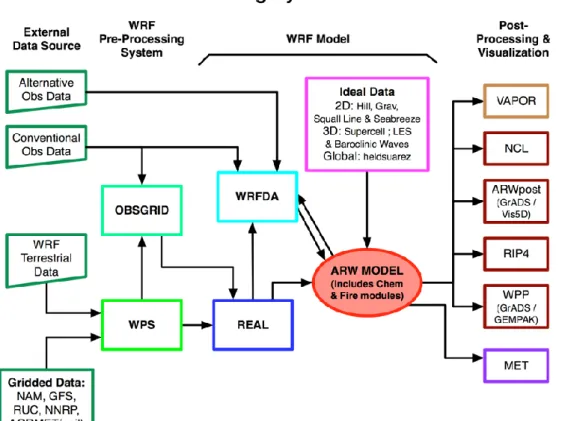
本計畫以桃園地區為主,討論區域的發展對於不同地形區之水文循環 影響程度,分析在未來氣候變遷情境與不同土地利用情境下,研究區之對流 降雨空間與時間分布的特徵以及其變化,並利用局部氣候模式(Weather Research Forecast, WRF)透過一系列的數值實驗探討地表變遷如何改變當 地的降水型態,解釋其中改變的物理機制,進而討論未來氣候改變情況下,
土地變遷如何影響降水過程。此外,亦透過全球經濟模式,推估不同社會發 展情境下土地需求改變,並結合國土模擬結果,分析未來土地利用空間配置 情形,以及當上游及下游都考量分擔部分洪水時,對都會區淹水的影響為何 (摘圖 3)。
摘圖 1 各工作項目概念圖
摘圖2 各工作項目之關聯性
WRF Model
集水區規劃 降雨型態
土地利用型態 用水需求
土地利用分析
摘圖 3 計畫流程圖
二、結合遙連結與氣候模式探討區域遙連結對未來氣候型態及降 雨強度之關係與影響
(一) 利用大氣數值模式探討土地利用變遷與對流降雨強度關係
本計畫中使用 Noah 地表模式(Noah land surface model),結合美國 國家大氣研究中心(National Center for Atmospheric Research, NCAR)所 發展的天氣研究預測模式(Weather Research Forecast, WRF)(Skamarock et al., 2008),探討土地利用的變化如何影響桃園的氣候水文狀態,挑選 1999 年至 2011 間 8 月弱綜觀條件(臺灣鄰近區域無颱風或鋒面影響)下,
18 個晴朗個案(無午後陣雨)及 10 個有雨個案(有午後陣雨),土地利用 用資料則以臺灣全區 2007 年的調查為基底,將桃園地區分別抽換成 1995 年、2007 年、2015 年之土地利用情況進行討論。計畫中首先以設 計實驗討論將水田區域轉為休耕區域後,對區域之降雨影響,結果顯示
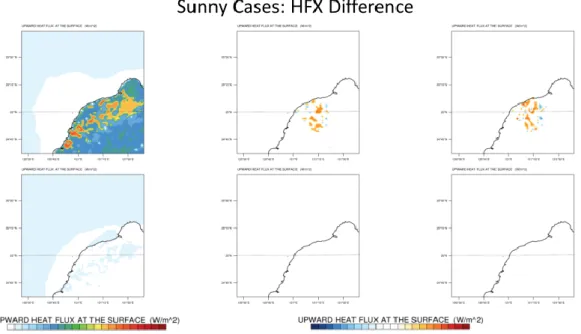
平均降雨量在桃園休耕時有增加的趨勢,且小雨到強降雨的頻率也有 增加(摘圖 4);而在考量不同土地利用下之分析結果顯示,在晴朗條件 個案下,2015 年及 2007 年相對 1995 年,桃園地區都市增加的比例較 多,水田的比例則有所減少,都市化的結果改變這些區域的能量收支比 例,白天潛熱釋放減少,夜晚增溫更為明顯(摘圖 5);有雨條件個案下,
能量收支及溫度場以及水氣場的改變與晴朗個案分布相似,惟受到平 均雲量較多之影響,變化幅度較晴朗個案來的略小一些,而從降雨強度 分布來看,午後降水在時間上似乎有更集中的變化(摘圖 6 及摘圖 7)。
成果說明地表的變遷對於大氣降水是有潛在影響的,然而由於大氣的 不確定性相當大,影響多寡是需要夠多的資料與模式結果來驗證的。
摘圖 4 降雨強度在桃園休耕時的變化
摘圖 5 晴朗個案下邊界層厚度變化:1995 年(左)、2007 年-1995 年 (中)、2015 年-1995 年(右),上排為日間,下排為夜間變化
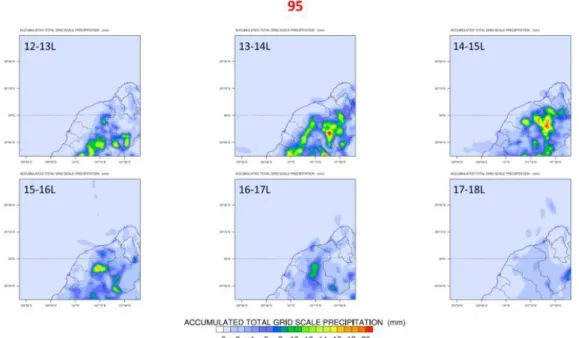
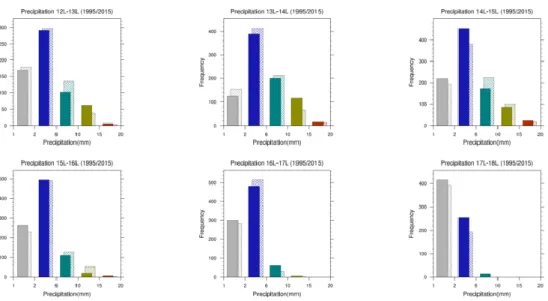
摘圖 6 有雨個案下,利用 1995 年(實心)及 2007 年(斜線)桃園區土地利用 資料模擬下午 12L-18L 逐時雨量強度分佈
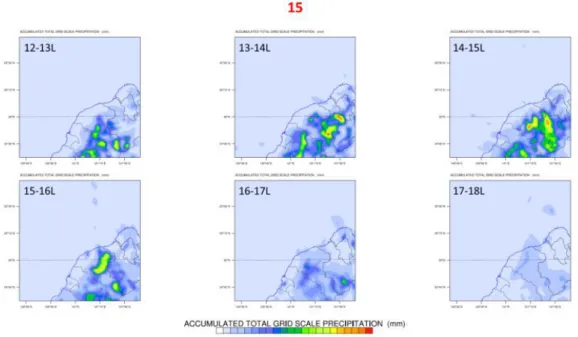
摘圖 7 有雨個案下,利用 1995 年(實心)及 2015 年(斜線)桃園區土地利用 資料模擬下午 12L-18L 逐時雨量強度分佈
(二) 區域土地利用變遷與對流降雨強度關係之時間空間分析
本計畫主要針對桃園都會區進行長時間的空間統計分析,以夏季 月份弱綜觀事件的案例作為探討。針對桃園地區土地利用改變情形分 析結果顯示,桃園地區的都市建成環境在1991 年主要集中在沿海桃園 機場附近相關區域以及靠內陸區域的中壢及桃園,2006 年時八德和蘆 竹區域呈現高度發展的趨勢,而 2006 到 2016 之間,三種土地利用的 變化幅度相對而言趨於穩定。桃園地區年雨量變化及夏季雨量變化分 析顯示,在過去平地較靠內陸的測站雨量較於其他測站較高,然而近年 來這部分空間差異的特徵則較不明顯,其顯示出桃園地區平地測站降 雨的熱點有隨著時間演變呈現重心轉移的現象。
為了瞭解桃園地區在長期趨勢下,夏季對流強降雨雨量變化特徵,
選則八德測站、大園測站、以及楊梅測站進行長期趨勢分析。結果顯示,
由於長時間土地利用地改變,會使夏季弱綜觀強降雨事件的熱點由內 陸東側地區往沿海西側地區移動的趨勢,且夏季對流強降雨在年雨量 的貢獻量熱區也逐年由內陸東側區域往西側或沿海地區移動(摘圖 8)。
顯示桃園地區長期土地利用的變化,使得整體地區的強降雨事件無論 是在單次降雨強度或是總降雨量的貢獻上,都呈現重心移轉的特徵。
摘圖8 氣象局八德,大園,楊梅測站 1998 至 2017 年夏季月份弱綜觀條 件下對流降雨事件總雨量與年雨量比例長期變化趨勢圖。其中藍色圓圈符
號為該年分對流降雨事件總雨量與年雨量比例,紅色直線為趨勢線
三、結合遙連結與全球經濟模式探討區域遙連結對未來都會區土 地利用之影響
(一) 全球經濟模式
本計畫根據政府間氣候變遷專門委員會(Intergovernmental Panel on Climate Change, IPCC) 氣 候 變 遷 第 五 次 評 估 報 告 (Fifth Assessment Report, AR5) 所 描 繪 的 未 來 全 球 社 會 經 濟 發 展 路 徑 (Shared Socio- economic Pathway, SSP) 作為全球氣候變遷整合評估模型中之全球經濟 模式的基準情境。此外,亦納入氣候變遷衝擊,以模擬 2030 年時全球 與台灣經濟體各生產與消費部門在 IPCC AR5 所選薦之全球各國社會 經濟發展路徑情境下的經濟成長展望以及國際貿易型態,作為經驗式 土地利用變遷模式(Conversion of Land Use and its Effect at Small regional extent,CLUE-s)在經濟外生環境的設定參數。
依社會經濟發展所可能導致全球溫室氣體減量排放和氣候變遷調 適之難易程度劃分為五類 SSPs(摘圖 9):(1) SSP1:強調永續發展的社 會經濟發展路徑(sustainability),其減量排放及調適的難度均相對其他 四種發展路徑為低;(2) SSP2:延續現況的社會經濟發展路徑(middle of the road),其減量排放及調適的難度介於其他四種發展路徑之間;
(3)SSP3:區域競爭對立(regional rivalry),其減量排放及調適的難度均 相對其他四種發展路徑為高;(4) SSP4:所得分配不均的社會經濟發展 路徑(inequality),調適難度相對較 SSP1、SSP2 及 SSP5 發展路徑為高,
但減量排放的難度相對較 SSP2、SSP3 及 SSP5 發展路徑為低;以及(5) SSP5 : 大 量 使 用 化 石 燃 料 的 社 會 經 濟 發 展 路 徑 (fossil-fueled development),其減量排放的難度相對較 SSP1、SSP2 及 SSP4 發展路 徑為高,但調適的難度相對較 SSP2、SSP3 及 SSP4 發展路徑為低。各 個社會經濟發展路徑情境的主要假設詳摘圖 10。
摘圖9 全球社會經濟發展路徑下的碳排放量及世紀末暖化程度 (彙整自 Le Quéré et al. (2018), Riahi et al. (2017)及 Rogelj et al.
(2017))
摘圖 10 全球社會經濟發展路徑之主要模型情境假設(編譯自 Bauer et al., 2017)
SSP5 SSP3
►高度全球化,各國間的連結程度加深。
►崇尚物質主義、講求地位象徵性的消費、旅遊、移動便利、肉類占比高的飲食型態。
►著重區域內之環境對居民福祉的助益,但較少關注全球尺度的問題。
►強調經濟發展、自由市場及人力資本。
►塑造競爭環境以提升市場效率。
►大量採用化石燃料,而未積極尋求替代能源。
►單位產出之碳排放密集度高。
►未針對化石燃料的使用設限。
►當地問題的管理講求策畫與設計。
大量使用化石燃料的社會經濟發展模式 區域競爭對立
►去全球化(De-globalizing), 強調區域安全。
►物質占比高的消費型態。
►環境議題未獲重視。
►政策首重安全考量。
►全球共通體制尚顯薄弱;政策決策由單國政府主導。
►技術進步緩慢,且能源多由本國供應。
►化石燃料資源豐富國家的能源與碳排放密集度高。
►以非常規能源供應國內需求。
►環境嚴重惡化。
REMIND-MAgPIE模型 AIM/CGE模型
調適的難度 高
低
低高碳排放減量的難度
SSP1 SSP4
強調永續發展的社會經濟發展模式 所得分配不均的社會經濟發展模式
►區域各自生產,但全球市場相互連結
►物質比重成長趨緩的消費型態
►對於區域及全球尺度之環境問題的管理成效提高;更加嚴格監管規範污染。
►透過政策設計引導永續發展。
►單國及國際層級的體制均能奏效。
►再生能源使用技術及能源效率提升促使化石燃料需求縮減。
►單位產出之碳排放密集度與能源密集度較低。
►化石燃料的使用偏好下降。
►環境品質逐步提升。
►菁英階層的跨國連結度高
►菁英階層: 高度消費的生活型態; 其他階層: 低度消費, 移動性低。
►中高所得國家關注其區域內環境問題; 但很少關注脆弱區域及全球尺度的議題。
►政治與商業菁英階層的利益較受關照。
►體制設計獨厚政治與商業菁英階層, 但不利於其他社會階層。
►多元化投資於能源效率的提升及低碳能源。
►低度/中度碳排放及能源密集度。
►化石燃料限制使用的預期將使能源價格上漲且價格波動大。
►中高所得國家注重環境管理。
IMAGE模型 GCAM4模型
延續現況的社會經濟發展模式(Middle of the Road)
SSP2
►半開放的經濟全球化。
►物質占比高的消費型態,肉類占比中度的飲食型態消費。
►關注區域內污染問題,但減污執行成效有限。
►對於永續發展的認知薄弱。
►各國之政策成效有限且不一。
►再生能源之投資仍屬有限,化石能源仍是主力。
►單位產出之碳排放密集度屬中度;各國之能源密集度不一,低所得國家的能源密集度相對較高。
►非常規化石能源的採用。
►環境持續惡化。
MESSAGE-GLOBIOM模型
經濟體及生活型態 政策及體制 技術進展 環境及自然資源
圖例:
摘圖11 與摘圖 12 分別為 OECD Env-Growth 模式與 IIASA 模式所 預測2030 年 10 國/區域經濟體在 5 個 SSP 情境下的 GDP 前景 (以 2005 年購買力平價(PPP)係數計價)。OECD Env-Growth 模式與 IIASA 模式 對於全球經濟體整體成長預測一致,但其對個別國家/區域成長預測,
則因其所假設各國未來發展前景不同而有所差異。在 OECD Env- Growth 模式與 IIASA 模式之 SSP 預測情境下,於開發中國家的人口 (與勞動力)大幅成長,對比台灣的人口(及勞動力)僅小幅成長,勞動密 集型產業難與勞動力廉價的開發中國家競爭,因而減產,其他產業之產 出則多有成長。
另後續桃園市之產業成長與用地需求推估中,選擇以較為保守的 IIASA 模式預測值來進行區域降解(downscaling)。在 SSP3 情境下,桃 園市 2030 年農業利用(包括農、漁、畜牧業)土地面積需求將較 2011 年 減少 714.47 公頃,森林利用土地面積需求減少 224.86 公頃,建築利用 土地面積需求增加 399.88 公頃;在 SSP5 情境下,桃園市 2030 年農業 利用(包括農、漁、畜牧業)土地面積需求將較 2011 年增加 739.25 公頃,
森林利用土地面積需求增加 167.62 公頃,建築利用土地面積需求增加 1663.80 公頃,如摘表 1 所示。
摘表 1 IIASA 全球 SSP3 及 SSP5 情境桃園市 2030 年各類土地利用需求 量預測
桃園市面積需求變動量(公頃) SSP3 情境 SSP5 情境 農業利用土地 -714.47 739.25 森林利用土地 -224.86 167.62 建築利用土地 399.88 1663.80
荒地利用土地 2.14 2.19
摘圖 11 OECD Env-Growth 模式所預測 2030 年各國/區域經濟體在 5 個 SSP 情境下的 GDP 前景 (單位:十億美元,以 2005 年購買力平價(PPP)
係數計價)
摘圖 12 IIASA 模式所預測 2030 年各國/區域經濟體在 5 個 SSP 情境下的 GDP 前景 (單位:十億美元,以 2005 年購買力平價(PPP)係數計價)
0 20000 40000 60000 80000 100000 120000 140000 160000 180000
Y2010 Y2030_SSP1 Y2030_SSP2 Y2030_SSP3 Y2030_SSP4 Y2030_SSP5
IIASA GDP SSPs 2030
1 Oceania 2 CHNRING 3 JPN_KOR 4 SEAsia 5 SAsia 6 NAmerica 7 CSAmerica 8 Europe 9 MidEast 10 Africa
(二) 土地利用變遷模式
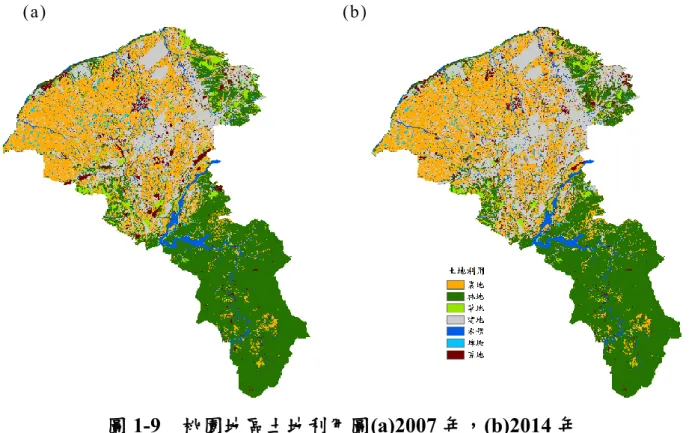
本計畫利用經驗式土地利用變遷模式(Conversion of Land Use and its Effect at Small regional extent,CLUE-s)納入利用全球經濟模式所分 析之未來各類型土地利用需求改變情形,以及各項可能限制土地利用 開發政策,模擬未來土地利用空間分布情形。將桃園地區2007 年及 2014 年之土地利用分布輸入 CLUE-s 模式,選用驅動土地利用改變的環境變 數,並將目前桃園機場範圍設定為限制土地利用改變區域,分析在SSP3 及 SSP5 兩種情境下之桃園地區土地利用改變情境。
結果顯示,SSP3 情境中農業、森林及草地面積減少,而建地及荒 地面積增加,但在SSP5 情境中,農業、森林、荒地及建地是增加的,
尤其是建地的面積大幅增加,而據此各類型土地利用面積及土地利用 適宜性推估結果,所模擬之 2030 年各類型土地利用空間配置結果如摘 圖 13 所示。此外,利用 5 種適宜性分布模式模擬土地利用適宜性後,
再結合 CLUE-s 模式進行土地利用空間分布推估結果顯示(摘圖 13),
Random Forest (RF) 模式所模擬之各類型土地利用之 AUC 值均大於 0.8,
且 RF 模式搭配 CLUE-s 所模擬土地利用空間分布結果之 kappa 值為 0.86,顯示 RF-CLUE-s 模式所推估之模擬結果具有可信度,因此,在 後續工作中,以 RF-CLUE-s 模式所推估之結果與國土功能分區進行套 疊,討論模擬之結果各類土地利用是否符合預定或是已設定之功能,以 適切評估未來可能的土地利用空間配置情形。
SSP3 SSP5
LR -CL U E -s A N N -CL U E -s G A M -CL U E -s SV M -CL U E -s RF -CL U E -s
摘圖 13 SSP3 及 SSP5 情境下推估之未來土地利用空間分布
四、評析目前國土規劃與依據結合遙連結與全球經濟模式所分析 之未來土地利用之差異
(一) 目前國土規劃之發展
根據公告施行之國土計畫法及全國國土計畫之土地使用指導原則,
為達資源保育、環境保護以及不破壞原生態環境及景觀資源,以及為確 保農業土地長期為面積完整且生產條件優良的農地資源,因此國土保 育地區第一類及農業發展地區地第一類之土地利用應盡量閉眼有開發 利用或建築之行為產生,或是得調降其使用強度及減少容許使用項目。。
因此,在進行未來土地利用空間配置模擬時,可將國土功能分區之國土 保育地區第一類及農業發展地區第一類設定為限制開發區域,限制該 區域之土地利用轉換之可能性,進而討論不同限制區域畫設對於未來 土地利用空間配置之差別。
(二) 國土規劃與未來土地利用模擬比較分析之操作步驟
本計畫使用桃園市陸地區域之國土功能分區圖,並依據全球經濟 模式所推估之未來各類型土地利用之需求改變情形,以土地利用變遷 模式所推估之各類型土地利用空間配置,詳細流程如摘圖14 所示。本 計畫設定三種限制發展情境進行討論:(1).限制情境一:僅將桃園機場 範圍劃定為限制開發地區;(2).限制情境二:將桃園機場範圍及國土保 育地區第一類及農業發展地區第一類劃定為限制開發地區;(3).限制情 境三:將桃園機場範圍及所有的國土保育地區與農業發展地區第一類 劃設為限制開發地區。若限制情境一之各類型土地利用空間配置結果 不符合國土功能分區規劃,則將進一步分析評估可能的限制發展區域 (限制情境二與三),再重新進行土地利用空間配置模擬。
摘圖14 結合國土規劃與全球經濟模式分析未來土地利用空間分布流程圖
(三) 國土規劃與未來土地利用模擬之差異分析結果與評析
限制情境一下,自 2007 年至 2030 年 SSP3 情境之模擬結果,建地 不論是那個國土功能分區,都有明顯增加之情形;就 SSP5 情境模擬結 果而言,各功能分區之草地與埤塘變化則有明顯減少現象,而建地則有 明顯增加。
限制情境二下,SSP3 情境之模擬結果,城鄉發展地區之建地增加 量大於限制情境一,國土保育地區及農業發展地區的農地與林地減少 量小於限制情境一,而城鄉發展地區的農地與林地面積減少量也明顯 大於限制情境一;SSP5 國土功能分區各土地利用面積變化差異與 SSP3 情境結果相似,城鄉發展地區的土地變遷變化情形明顯增加。
限制情境三下,SSP3 情境之模擬結果,位於農業發展地區的林地 減少量大於其他兩個情境,而位於城鄉發展地區的農地減少量亦明顯 大於其他兩個情境,且建地增增加量都明顯大於另外兩個情境;SSP5
則因為國保地區及農發一的各種土地使用類型無法變動,所以導致城 鄉發展地區的土地變遷變化情形明顯增加。
三種情境之結果如摘表 2 所示。整體來說,比較三種限制情境造 成的土地變化差異後,發現限制情境一因未加以限制,使得位於國土保 育地區及重要農業發展地區之土地使用仍有變遷之可能。但限制情境 三的全部國土保育地區及農業發展地區第一類劃設為限制發展地區時,
使得其他土地變遷壓力都轉移到其餘的農業發展地區及城鄉發展地區。
相較之下,限制情境二僅國保一及農發一劃設限制發展區,使得國土保 育地區及農業發展地區之建地不至於增加太多,且讓農業發展地區農 地變化幅度減少,亦能讓國土保育地區之林地有面積增加的空間。
此外,結果顯示限制情境一過於寬鬆,使得土地使用變遷情形會分 布於國土保育地區及重要農業發展地區。而過於嚴格管制之限制情境 三亦使得所有土地變遷壓力都轉移到農業發展地區及城鄉發展地區。
因此,僅將國保一及農發一劃設限制發展區之限制情境二,能讓國土保 育地區的林地面積增加,亦使農業發展地區農地減少幅度降低,同時也 讓位於國土保育地區及農業發展地區之建地增加幅度降低。
摘表2 不同限制情境之各類土地利用面積差異(單位:公頃) 土地利
用類別 2007 年
SSP3 SSP5
限制情 境一
限制情 境二
限制情 境三
限制情 境一
限制情 境二
限制情 境三 國
土 保 育 地 區
農地 4,657 4,327 (-330)
4,378 (-279)
4,657 (0)
4,593 (-64)
4,597 (-60)
4,657 (0)
林地 32,619 32,473 (-146)
32,522 (-97)
32,619 (0)
32,783 (164)
32,708 (89)
32,619 (0)
草地 732 630 (-102)
648 (-84)
732 (0)
145 (-587)
273 (-459)
732 (0)
建地 5,359 5,957 (598)
5,849 (490)
5,359 (0)
6,008 (649)
5,896 (537)
5,359 (0)
水利 2,828 2,828 (0)
2,828 (0)
2,828 (0)
2,828 (0)
2,828 (0)
2,828 (0)
埤塘 455 361 (-94)
421 (-34)
455 (0)
205 (-250)
343 (-112)
455 (0)
荒地 1,238 1,312 (74)
1,242 (4)
1,238 (0)
1,326 (88)
1,243 (5)
1,238 (0)
農 業 發 展 地 區
農地 23,424 22,527 (-897)
22,655 (-769)
22,600 (-824)
23,378 (-46)
23,374 (-50)
23,321 (-103)
林地 4,517 4,178 (-339)
4,242 (-275)
4,167 (-350)
4,463 (-54)
4,505 (-12)
4,505 (-12)
草地 1,326 1,310 (-16)
1,354 (28)
1,344 (18)
325 (-1,001)
439 (-887)
309 (-1,017)
建地 7,737 8,907 (1,170)
8,756 (1,019)
8,943 (1,206)
9,064 (1,327)
8,956 (1,219)
9,153 (1,416)
水利 1,264 1,264 (0)
1,264 (0)
1,264 (0)
1,264 (0)
1,264 (0)
1,264 (0)
埤塘 617 488 (-129)
485 (-132)
456 (-161)
230 (-387)
229 (-388)
228 (-389)
荒地 1,031 1,242 (211)
1,160 (129)
1,142 (111)
1,192 (161)
1,149 (118)
1,136 (105)
城 鄉 發 展 地 區
農地 5,228 4,729 (-499)
4,587 (-641)
4,553 (-675)
5,133 (-95)
5,179 (-49)
5,170 (-58)
林地 5,593 5,336 (-257)
5,303 (-290)
5,245 (-348)
5,628 (35)
5,668 (75)
5,685 (92)
草地 2,131 1,680 (-451)
1,705 (-426)
1,641 (-490)
900 (-1,231)
699 (-1,432)
415 (-1,716)
建地 12,165 14,087 (1,922)
14,156 (1,991)
14,397 (2,232)
14,157 (1,992)
14,292 (2,127)
14,583 (2,418)
水利 1,409 1,409 (0)
1,409 (0)
1,409 (0)
1,409 (0)
1,409 (0)
1,409 (0)
埤塘 321 248 (-73)
200 (-121)
188 (-133)
122 (-199)
4 (-317)
0 (-321)
荒地 2,218 1,576 (-642)
1,705 (-513)
1,632 (-586)
1,716 (-502)
1,814 (-404)
1,803 (-415)
備註:括號內數字為與 2007 年相減的面積變化量
五、分散式治水雛形架構方法建立及測試 (一) 山區逕流模式
本計畫針對桃園淹水模擬所設定之山區進行模擬,模擬事件選定 近年對桃園市造成重大淹水之豪雨及颱風事件(包含 2012 年 0611 豪雨 及蘇拉颱風(摘圖 15)、2016 年 0516 豪雨及 0602 豪雨),並同時以 50 年 重現期雨量之三種土地利用限制情境進行模擬(摘圖 16 顯示限制情境 一之結果)。以 DHSVM 模式模擬出各事件山區集水區出流量歷線做為 淹水模式模擬時之上游山區流邊界條件。
(a) (b)
摘圖 15 20120611 豪雨事件山區各網格地表最大水深(a)第一區(b)第二區
(a) (b)
摘圖16 限制情境一於 50 年重現期降雨事件之山區各網格地表最大水深 (a)第一區(b)第二區
(二) 淹水模式
摘圖 17 及摘圖 18 為 20120611 豪雨事件及 50 年重現期降雨條件 限制情境一模擬最大淹水深度圖,由於桃園市多為丘陵台地,因此主要 的淹水集中區域有四:(1)大園區、蘆竹區及桃園區之南崁溪沿岸;(2) 大園區及中壢區之埔心溪、新街溪及老街溪沿岸;(3)新屋區之社子溪 沿岸及(4)大園區、觀音區與新屋區之沿海低窪地區。
摘圖 17 桃園市 2012 蘇拉颱風模擬最大淹水深圖
摘圖18 桃園市 50 年重現期模擬最大淹水深圖(限制情境一)
(三) 熱點分析
計算熱點時需考慮鄰近區域之淹水情形,當鄰近區域為 200 公尺 時,所得到之熱點分析結果較能反應局部區域的淹水情形,後續將以此 進行分析。此外,各時間點之淹水熱點也有所區別,在降雨前期以及降 雨後期之淹水熱點則較以最大淹水深所選取之熱點為少,故將以不同 降雨事件所導致淹水之最大淹水深進行分析。
(四) 管制區域劃定
管制區劃設上,以上游山區地表水深及下游水最大深水所求得之 熱點,進行管制區劃設,並分別以7 場降雨事件之熱點進行分析。由於 不同降雨情境所畫設之熱點範圍接近,因此上游山區及下游地區所畫 設之管制區域大致上與熱點區域相同(摘圖 19、摘圖 20 及摘圖 21)。
摘圖 19 上游山區第一區之管制區劃設結果
摘圖 20 上游山區第一區之管制區劃設結果
摘圖 21 下游地區管制區劃設結果
(五)小結
考慮4 場歷史降雨事件及三種土地利用限制情境搭配 50 年重現期 降雨之管制區分析結果顯示,在上游山區第一區管制區主要集中在中 間三個小集水區,而在第二區在上游山區第二區的部分與第一區有相 似的情形,降雨導致的地表水深所計算出的熱點集中在其中三個小集 水區,在下游地區淹水熱點分析結果主要集中於蘆竹區及大園區的南 崁溪沿岸及沿海低窪地區。
六、結論與建議 (一) 結論
1.、本計畫利用大氣數值模式(WRF)模式的結果得知,休耕所造 成的效應要比單純只有土地使用的改變對於降水以及當地水 文氣候所造成的影響要大。
2、結果顯示桃園地區都市建成環境面積在 1991 年至 2006 年成長 30%,因而使得植被及水體面積減少,而在 2006 年至 2016 年之 間,三種土地利用的變化幅度相對而言以趨於穩定。而在弱綜觀 事件的情況下,桃園地區長期土地利用的變化,使得整體地區的 強降雨事件無論是在單次降雨強度或是總降雨量的貢獻上,都 呈現重心移轉的特徵。
3、計畫中以較為保守的 IIASA 模式 SSP 情境下的全國產值預測 值來進行區域降解,進行桃園市之產業成長與用地需求推估。
4、在所有情境中 RF 模式搭配 CLUE-s 所模擬土地利用空間分布 結果之 kappa 值最佳,因此分析時採用此模式所推估之結果與 國土功能分區進行評估。
5、相較之下,限制情境二使得國土保育地區及農業發展地區之建 地不至於增加太多,且讓農業發展地區農地變化幅度減少,亦能 讓國土保育地區之林地有面積增加的空間。
6、先分析淹水熱點而劃設之管制區較為集中,而直接以逐時淹水 劃設管制區不但範圍較大也較零散,顯示劃設管制區之先進行 熱點分析的重要性。
(二) 建議
本計畫討論土地利用改變對於降雨特性間之關係,分析結果亦顯 示土地利用改變的確會對於降雨特性產生影響,後續須蒐集桃園地區
過去土地每年之土地利用資料,結合降雨觀測資料與大氣模式,分析歷 史土地利用改變對於降雨特性所造成之影響及改變。
Abstract
1.Preface
Due to the globalization, the relationship between society, economy and natural environment has an interactive influence, and with global warming, it is obvious that some issues such as cross-discipline water resources management or environmental pollution combat climate change. In Taiwan, economic pattern is deeply affected by the globalization and citizens are more likely to gather in the busy zone, which increases dramatically urbanization. Under the extreme climatic conditions, the rainfall has become more frequent and intense, which lead to severe flood problem. For example, in 2018, 0823 tropical low-pressure rainstorm caused the damage in the southern region. In addition, due to the uncertainties of climate change, when assessing the reduction of the impact, it should consider both risk management and decentralized adjustment strategy.
The project aims to combine teleconnection with climate model, global economic model and land-use change model. After simulating different scenarios of spatial distribution, using teleconnection and climate model analyze future climate type and rainfall intensity, or the possibilities of flood. The project builds the structure of decentralized water regulation, including land use strategies, land planning scenarios and water management strategies and establishes a demonstration area to validate. Besides that, the project also analyzes the difference between present and future land use by teleconnection and global economic model.
The research area is Taoyuan City, and its development is studied the impact of hydrological cycles by different kinds of terrains, analyzing the characteristics of convective rainfall spatial and temporal distribution in future climate change and different land use scenarios. While using Weather Research Forecast (WRF) to explore how to change local precipitation patterns and explain the physical
mechanisms, it can be known how land-use change affect the process in the future.
In addition, through the global economic model, it is estimated that the land-use change in different situations and combine with national spatial planning to analyze future land use, and what the impact is when both upstream and downstream sharing part of the run-off.
2.Combine teleconnection with climate model to explore future climate patterns and rainfall intensity
2.1 The relationship between land-use change and convectional rain intensity by atmosphere numerical model
The project applies Noah land-surface model and WRF for study cases, which were selected weak synoptic-scale during August from 1999-2011, including 18 sunny cases and 10 rainy cases. The design experiment was conducted to discuss the impact on rainfall pattern after the paddy area was converted to fallow area. The results showed that the average rainfall and the rainfall intensity were incteased during the fallow period. In sunny condition and different land use secnarios, compared with 1995, the proportion of cities in Taoyuan increased both in 2015 and 2007, while the proportion of paddy fields decreased. The increased urbanization lead to the reducing latent heat release at daytime and increasing temperature at night. In rainy condition, it is quite similar with sunny condition in the energy budget and the change of temperature. However, the temporal distribution of rainfall intensity was more concenterated over time. The results show that the change of surface has a potential impact on atmospheric precipitation, but due to the uncertainty of the atmosphere, it still needs to verify by sufficient data and model results.
2.2 Spatial and temporal analysis of the relationship between land-use change and convectional rain intensity
The project focuses on the long-term spatial statistical analysis specifically for the Taoyuan metropolitan area. In addition, summer convective rainfall events will be the object of analysis and mainly selected of cases of weak synoptic-scale. The built-up area in 1995 was concentrated on the located on the nearing area of Taoyuan Airport, Chungli and Taoyuan and chnaged to Bade and Luzhu in 2006. From 2006 to 2016, the land use change in the study area was relatively stabilized. The change of annual rainfall and summer rainfall showed that the higher rainfall was observed in those stations which were located on the flat and more inland area in the past.
In recent years, the characteristics of these spatial differences are less obvious. These results indicated that the the rainfall center was shifted in the study area.
To understand the change of characteristics in heavy convective rainfall in summer, the rainfall data in Bade Station, Dayuan Station, and Yangmei Station were selected for long-term trend analysis. Due to the long-term land use change, the hotspot of weak summer comprehensive rainfall event move from the eastern part of the inland to the western part of the coastal area. The contribution of heavy summer convective rainfall to annual rainfall hotspot area also moved from the east inland area to the west or coastal area . The results show that the long-term land-use change in Taoyuan area makes the heavy rainfall events shift the characteristics of gravity no matter in the single rainfall intensity or the total rainfall.
2.3 Brief summary
The results show that the effects of land retirement have a greater impact on precipitation and local hydrological climate than land-use changes (from 1995 to 2015). It is expected that the relationship between actual land use change and convective rain intensity in the next stage will also be included in the boundary conditions of the WRF model by the present outcome. In terms of land-use identification of satellite data in Taoyuan area, the results show that the urban built environment area grew by 30% from 1991 to 2006, thus the reduction of the vegetation and water area, and between 2006 and 2016, three types of land use changed stably, which indicated that land use change before 2006 will affect the thermal nature.
3. Combine teleconnection with global economics model to explore future urban land use
3.1 global economics model
The project is based on Shared Socio-economic Pathway (SSP) described in the Fifth Assessment Report (AR5) by Intergovernmental Panel on Climate Change (IPCC), as an integrated assessment model for the baseline of global climate change. In addition, it is considered the impact of climate change to simulate the economic growth prospects and international trade patterns of production and consumption sectors in the global and Taiwan in 2030, as the parameters of Conversion of Land Use and its Effect at Small regional extent (CLUE-s) land use model.
Under the five SSP scenarios of GDP in 2030, there is the same prediction trend for both OECD Env-Growth model and IIASA model on global economy, but different on individual country/region. In both models, the population and labor force in developing countries rise dramatically,
while there has only a slight increase in Taiwan and labor-intensive industries are hard to compete with those in developing countries, while other industries have grown.
The project uses IIASA model, which is more conservative, to downscale in the prediction of industrial growth and land demand in Taoyuan City. In the SSP3 scenario, the demand of land use for agriculture will be reduced by 714.47 hectares from 2011 to 2030, and those for forest will be reduced by 224.86 hectares and those for construction will increase by 399.88 hectares. In the SSP5 scenario, the demand of land use for agriculture will increase by 739.25 hectares from 2011 to 2030, and those for forest will be reduced by 167.62 hectares and those for construction will increase by 1663.80 hectares.
3.2 Land-use change model
The project intends to use CLUE-s to incorporate changes of the demand of land use by the global economic model and the policies, which may control land-use development, to simulate the spatial distribution of land use in the future. The land use distribution of the Taoyuan area in 2007 and 2014 will be input into the CLUEs model, and five environmental variables that drive land use change will be selected.
The results also showed that the AUC values of all types of land use are greater than 0.6. The kappa value of CLUE-s modle are greater than 0.8, meaning the simulated land use allocation are credibility. The future land allocated results show that the area of agriculture, forests and grassland decreased, while the area of land construction and wasteland increased in the SSP3 scenario. However, in the SSP5 scenario, agriculture, forests, wasteland and land construction increased, especially the last one increased
greatly. Moreover, because the AUC values of land use simulated by Random Forest (RF) model are greater than 0.8, and the kappa value of the RF model combined with CLUE-s is 0.86, which indicates that the results have credibility. Therefore, the spatial distribution of land use simulated by the RF-CLUE-s model is nested with the national functional partitions, to establish functions to properly assess the land use space plan in the future.
4. The difference of land use between present national spatial planning and the result by teleconnection and global economics model
4.1 The development of present national spatial planning
According to the National Spatial Planning Law and the Land Use Guidelines Principle, while allocating land use space in the future, the first category of land conservation areas and agricultural development areas should be the same as the previous period. Therefore, the process of future land use space allocation simulation, those areas can be set as the restricted development area, limiting the possibility of land use conversion.
4.2 Operational steps for comparative analysis of national spatial planning and future land use simulation
The project uses national spatial function map of the land area in Taoyuan City, and according to the changes in the demand for various types of land use estimated by the global economic model, the spatial allocation of the types of land use estimated by the land use change model. (A) Restricted Scenario 1: Only Taoyuan Airport is designated as a restricted area; (B) Restricted Scenario 2: Taoyuan Airport, the first category of land
conservation areas and the first category of agricultural development areas are designated as restricted areas; (C) Restricted Scenario 3: Taoyuan Airport, all categories of land conservation areas and the first category of agricultural development areas are designated as restricted areas.
4.3 The anaylsis and discussion of the difference between national spatial planning and future land use simulation
Under Restricted Scenario 1, as the results of the SSP3 situation from 2007 to 2030, the construction of the land is obviously increased regardless of the functional division of area. In terms of the SSP5 situation, the changes in the grassland and the pond in each functional area are significantly reduced, and the construction area has increased significantly.
Under Restricted Scenario 2, as the results of SSP3 situation, the increase of construction land in urban and rural development areas is greater than Scenario 1. While the reduction of agricultural land and forest land in land conservation areas and agricultural development areas is less than Scenario 1, the reduction of agricultural land and forest area in urban and rural development areas is greater than Scenario 1. In terms of the SSP5 situation, it is similar to that of SSP3, and the change of land change in urban and rural areas is obviously increased.
Under Restricted Scenario 3, the results of SSP3 situation show that the reduction of forest land in the agricultural development area is greater than other scenarios, while the reduction of agricultural land in the urban and rural development area and the increase of construction land are also significantly greater than others. In terms of the SSP5 situation, due to the unchangeable of land conservation areas and agricultural development areas, the land-use change in urban and rural development areas has increased significantly.
Due to the illimitation of Restricted Scenario 1, there still has the possibilities to change in the land use of land conservation areas and critical agricultural development areas. However, in Restricted Scenario 3, other land-use changes are transferred to the remaining agricultural development areas and urban and rural development areas. By contrast, Restricted Scenario 2 has made the construction of the land conservation areas and agricultural development areas not increase too much, and also allow for an increase in the area of forest land in the land conservation area.
5. Establishment and test of the decentralized water control prototype
5.1 Mountain run-off model
The project simulates flood in the mountainous area in Taoyuan and selects the rainfall and typhoon events that caused heavy flooding (including 0611 rainfall in 2012, Sura typhoon, 0516 and 0602 rainfall in 2016), and simulate three Restricted Scenario of 50-year return period. By the DHSVM mode, the hydrograph of the mountain catchment area in each event is regarded as the boundary condition of the upstream inflow.
5.2 Inundation model
The main flooding areas: A. Dayuan District, Luzhu District, Nankan River of Taoyuan District; B. Pushin Creek, Xinjie River, and Laojie River of Dayuan District and Zhongli District; C. Shezi Stream of Xinwu District;
D. coastal low-lying areas of Dayuan District, Guanyin District and Xinwu District.
5.3 Hot spot analysis
When calculating the hot spot, it is necessary to consider the flooding situation of the adjacent area. When the adjacent area is 200 meters, the analysis result can reflect well of the local flooding area. In addition, the flooding hotspots at different time are also different. The flooding hotspots in the early and the late period are less than the hotspots selected in the maximum flooding depth, so the maximum flooding depth will be selected to use.
5.4 Control area design
While designating the control area, the hot spots are obtained from the surface water depth in the upper mountainous area and the maximum flooding depth in the downstream water, and then the hot spots of the seven rainfall events were analyzed. Because the hotspots of different rainfall situations are close to each other, the control areas designated in the upper mountainous areas and downstream areas are roughly the same as the hotspots area.
5.5 Brief summary
The results show that the first zone control zone is mainly concentrated in the middle of three small catchments in the upper mountainous area, while in the second zone, the second zone in the upper mountainous zone has a similar situation with the first zone, and the hot spots are concentrated in three small catchment areas, and the results of flooding hotspots in the downstream areas are mainly concentrated in the Nankan River and coastal low-lying areas of Dayuan District and Luzhu District.
6. Conclusion and suggestion
6.1 Conclusion
(1)The project applies for WRF and the results show that the effects of land retirement have a greater impact on precipitation and local hydrological climate than land-use changes
(2)The results show that the urban built environment area grew by 30%
from 1991 to 2006, thus the reduction of the vegetation and water area, and between 2006 and 2016, three types of land use changed stably. Under the weak synoptic-scale situation, the long-term land- use change makes the heavy rainfall events shift the characteristics of gravity no matter in the single rainfall or the total.
(3)The project uses IIASA model, which is more conservative, to downscale in the prediction of industrial growth and land demand in Taoyuan City.
(4)The kappa value of the RF model combined with CLUE-s is the best, so it is used to establish functions to properly assess the land use space plan in the future.
(5)Restricted Scenario 2 has made the construction of the land conservation areas and agricultural development areas not increase too much, and also allow for an increase in the area of forest land in the land conservation area.
(6)The control areas designated for flooding hotspots are relatively concentrated, and those that are directly flooded with time-by-time flooding are not only wide but also scattered, indicating the importance of conducting hotspot analysis.
6.2 Suggestion
The results show that land-use change effect rainfall characteristics, and it is necessary to collect historical annual land use data in Taoyuan area during the future work, combining with rainfall observation data and atmospheric patterns and analyzing the impact and changes of land-use change on rainfall characteristics.
因應氣候變遷遙連結應用於新興治水策略之研究(1/2) 目錄
摘要 ... 摘-1 Abstract ... A-1 目錄 ... 目-1 表目錄 ... 表-1 圖目錄 ... 圖-1 第一章 前言 ... 1-1 計畫緣起 ... 1-1 工作項目及內容 ... 1-4 預期成果 ... 1-6 計畫工作內容及流程 ... 1-7 示範區域挑選 ... 1-9 工作進度 ... 1-16 第二章 結合遙連結與氣候模式探討區域遙連結對未來氣候型態及降雨強 度之關係與影響 ... 2-1 利用大氣數值模式探討土地利用變遷與對流降雨強度關係 ... 2-1 區域土地利用變遷與對流降雨強度關係之時間空間分析... 2-18 小結 ... 2-47 第三章 結合遙連結與全球經濟模式探討區域遙連結對未來都會區土地利 用之影響 ... 3-1 全球經濟模式 ... 3-1 土地利用變遷模式 ... 3-37 小結 ... 3-52 第四章 評析目前國土規劃與依據結合遙連結與全球經濟模式所分析之未 來土地利用之差異 ... 4-1 目前國土規劃之發展 ... 4-1 國土規劃與未來土地利用模擬比較分析之操作步驟 ... 4-13
國土規劃與未來土地利用模擬之差異分析結果 ... 4-16 綜合評析:限制發展區設定之比較分析 ... 4-29 小結 ... 4-31 第五章 分散式治水雛形架構方法建立及測試 ... 5-1 山區逕流模式 ... 5-2 淹水模式 ... 5-17 熱點分析 ... 5-26 管制區域劃定 ... 5-34 小結 ... 5-40 第六章 結論與建議 ... 6-1 結論 ... 6-1 建議 ... 6-3 參考文獻 ... 參-1 附錄一 期中簡報暨期中報告書審查意見及處理情形 ... 附 1-1 附錄二 期末簡報暨期末報告書審查意見及處理情形 ... 附 2-1
表目錄
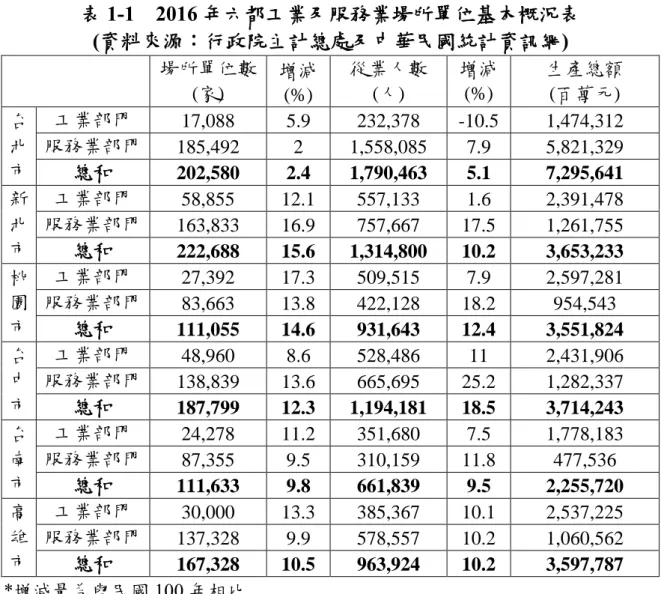
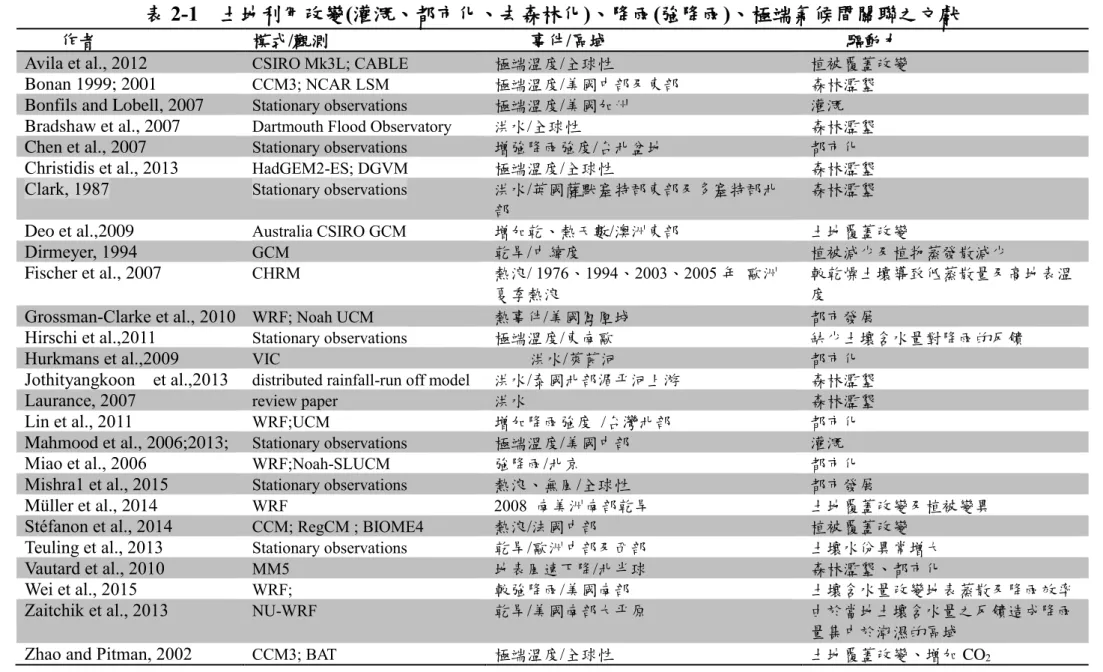
表 1-1 2016 年六都工業及服務業場所單位基本概況表 ... 1-12 表 1-2 桃園市 2006 年及 2015 年土地利用分類面積 ... 1-14 表 1-3 工作進度表 ... 1-16 表 2-1 土地利用改變(灌溉、都市化、去森林化)、降雨(強降雨)、極端氣候 間關聯之文獻 ... 2-2 表 2-2 晴朗條件個案列表 ... 2-6 表 2-3 有雨條件個案列表 ... 2-6 表 2-4 1991 年、2006 年及 2016 年,桃園地區建成環境(built-up),植被 (vegetation)以及水體(water body)三種土地利用面積及面積百分比 ... 2-27 表 2-5 桃園市氣象測站基本資料測站位置 ... 2-30 表 2-6 桃園市氣象測站之土地利用分類 ... 2-31 表 2-7 桃園市氣象測站雨量資料概況 ... 2-33 表 3-1 全台農地資源盤查 ... 3-2 表 3-2 全球經濟模式校準資料庫:11 個加總區域經濟體組成國家 ... 3-16 表 3-3 全球經濟模式之校準資料庫:26 個加總生產部門之組成產業 .. 3-16 表 3-4 台灣 2030 年的農業部門用地需求(單位:公頃) ... 3-28 表 3-5 IIASA 全球 SSP3 及 SSP5 情境桃園市 2030 年各類土地利用需求量 預測 ... 3-36 表 3-6 土地利用轉移矩陣 ... 3-42 表 4-1 全國國土計畫各國土功能分區劃設條件 ... 4-2 表 4-2 全國國土計畫各國土功能分區土地使用指導原則 ... 4-6 表 4-3 全國國土功能分區模擬面積統計 ... 4-14 表 4-4 桃園市 2007 年與模擬限制情境一之 2030 年土地利用面積比較 ...
... 4-16 表 4-5 2007 年與限制情境一之 2030 年土地利用面積差異 ... 4-17 表 4-6 2007 年與限制情境一之 2030 年 SSP3 情境土地利用轉移矩陣 . 4-18
表 4-7 2007 年與限制情境一之 2030 年 SSP5 情境土地利用轉移矩陣 . 4-18 表 4-8 2007 年與限制情境一各類土地利用落於國土功能分區面積統計 ...
... 4-22 表 4-9 各類土地利用自 2007 年轉變至限制情境一 2030 年 SSP3 情境於國 土功能分各區面積變化 ... 4-23 表 4-10 各類土地利用自 2007 年轉變至限制情境一 2030 年 SSP5 情境於 國土功能分各區面積變化 ... 4-24 表 4-11 各類土地利用自 2007 年轉變至限制情境二 2030 年 SSP3 情境於 國土功能分各區面積變化 ... 4-25 表 4-12 各類土地利用自 2007 年轉變至限制情境二 2030 年 SSP5 情境於 國土功能分各區面積變化 ... 4-26 表 4-13 各類土地利用自 2007 年轉變至限制情境三 2030 年 SSP3 情境於 國土功能分各區面積變化 ... 4-27 表 4-14 各類土地利用自 2007 年轉變至限制情境三 2030 年 SSP5 情境於 國土功能分各區面積變化 ... 4-28 表 4-15 不同限制情境之各類土地利用面積差異 ... 4-30 表 5-1 桃園市土地利用及曼寧糙度值 ... 5-21
圖目錄
圖 1-1 大氣-土地利用遙耦合概念圖 ... 1-2 圖 1-2 經濟-土地利用遙耦合概念圖 ... 1-3 圖 1-3 各工作項目概念圖 ... 1-7 圖 1-4 各工作項目之關聯性... 1-8 圖 1-6 桃園市 24 小時累積雨量 350mm(上)及 650mm(下)天然災害潛勢地 圖 ... 1-10 圖 1-7 北台都會區交通與產業分布 ... 1-12 圖 1-8 桃園市區域發展架構... 1-13 圖 1-9 2008 年起全台及六都每年人口增加百分比 ... 1-13 圖 1-10 桃園地區土地利用圖(a)2007 年,(b)2014 年 ... 1-15 圖 1-11 計畫流程圖 ... 1-15 圖 2-1 WRF 模式模擬的空間範圍與巢狀網格設計 ... 2-3 圖 2-2 天氣研究與預報模式 (Weather Research and Forecasting Model,
WRF) 作業流程圖 ... 2-4 圖 2-3 1995 年(左上)、2007 年(右上)、2015 年(左下)桃園地區土地利用狀 況、2015 年與 1995 年土地利用差別(右下) ... 2-7 圖 2-4 累積(12:00-18:00)降水的差異性(休耕組減去水田組) ... 2-9 圖 2-5 降雨強度在桃園休耕時的變化 ... 2-10 圖 2-6 晴朗個案下潛熱通量變化:1995 年(左)、2007 年-1995 年(中)、2015 年-1995 年(右),上排為日間變化,下排為夜間變化. ... 2-11 圖 2-7 晴朗個案下可感熱通量變化:1995 年(左)、2007 年-1995 年(中)、
2015 年-1995 年(右),上排為日間變化,下排為夜間變化 ... 2-11 圖 2-8 晴朗個案下兩米高溫度場變化:1995 年(左)、2007 年-1995 年(中)、
2015 年-1995 年(右),上排為日間變化,下排為夜間變化 ... 2-12 圖 2-9 晴朗個案下邊界層厚度變化:1995 年(左)、2007 年-1995 年(中)、
2015 年-1995 年(右),上排為日間,下排為夜間變化... 2-12 圖 2-10 晴朗個案下近地表混合比變化:1995 年(左)、2007 年-1995 年(中)、
2015 年-1995 年(右),上排為日間,下排為夜間變化... 2-13 圖 2-11 晴朗個案下白天 10 米高風場及氣壓場變化:1995 年(左)、2007 年 -1995 年(中)、2015 年-1995 年(右) ... 2-13 圖 2-12 有雨個案下,使用 1995 年桃園區土地利用資料進行模擬,下午 12L-18L 的逐時雨量空間分佈... 2-15 圖 2-13 有雨個案下,使用 2007 年桃園區土地利用資料進行模擬,下午 12L-18L 的逐時雨量空間分佈... 2-15 圖 2-14 有雨個案下,使用 2015 年桃園區土地利用資料進行模擬,下午 12L-18L 的逐時雨量空間分佈... 2-16 圖 2-15 有雨個案下,分別利用 1995 年(實心)及 2007 年(斜線)桃園區土地 利用資料進行模擬,下午 12L-18L 的逐時雨量強度分佈 ... 2-16 圖 2-16 有雨個案下,分別利用 1995 年(實心)及 2015 年(斜線)桃園區土地 利用資料進行模擬,下午 12L-18L 的逐時雨量強度分佈 ... 2-17 圖 2-17 2003 年的休耕情形(摘自農委會年報) ... 2-18 圖 2-18 針對氣象測站量測資料估算混合層高度以及舉升凝結高度,並做 為篩選強降雨事件的條件。 ... 2-22 圖 2-19 桃園地區研究樣區範圍,包括蘆竹,桃園,八德,大園,中壢,平 鎮,觀音,新屋以及楊梅區域 ... 2-26 圖 2-20 研究區範圍內,1991 年(上)、2006 年(中)及 2016 年(下)桃園地區 建成環境(built-up)、植被(vegetation)及水體(water body)三種土地利 用空間分布 ... 2-28 圖 2-21 桃園行政區氣象局局屬測站與自動測站空間分布圖 ... 2-29 圖 2-22 桃園行政區土地利用分布圖 ... 2-32 圖 2-23 桃園市氣象測站年雨量變化圖 ... 2-34 圖 2-24 桃園市各氣象測站年雨量變化圖 ... 2-35 圖 2-25 桃園市氣象測站夏季月份雨量變化圖 ... 2-36 圖 2-26 桃園市各氣象測站夏季月份雨量變化圖 ... 2-37 圖 2-27 2007 至 2012 桃園年雨量內插分析圖 ... 2-39 圖 2-28 2013 至 2018 桃園年雨量內插分析圖 ... 2-40
圖 2-29 2007 至 2012 桃園夏季月份雨量內插分析圖 ... 2-41 圖 2-30 2013 至 2018 桃園夏季月份雨量內插分析圖 ... 2-42 圖 2-31 氣象局八德,大園,楊梅測站 1998 至 2017 年夏季月份弱綜觀條 件下對流降雨事件單次降雨強度長期變化趨勢圖 ... 2-45 圖 2-32 氣象局八德,大園,楊梅測站 1998 至 2017 年夏季月份弱綜觀條 件下對流降雨事件總雨量與年雨量比例長期變化趨勢圖... 2-46 圖 3-1 全球經濟模式與 CLUE-s 模型的連結 ... 3-5 圖 3-2 全球經濟模式中個別國家產業部門之生產函數結構 ... 3-7 圖 3-3 全球經濟模式中個別國家之最終需求函數結構 ... 3-8 圖 3-4 全球經濟模式中各國生產與消費部門間及國家間的相互連結 ... 3-10 圖 3-5 GTAP 全球貿易可計算一般均衡模型中商品/服務的跨國貿易連結 ... 3-11 圖 3-6 全球經濟模式之校準資料庫:以開發中國家之產業關聯帳表為例 ... 3-12 圖 3-7 全球經濟模式之校準資料庫:以 2011 年雙邊貿易(產品別)為例 ...
... 3-12 圖 3-8 全球經濟模式之校準資料庫:以 2011 年雙邊貿易(產品別)為例 ...
... 3-13 圖 3-9 全球社會經濟發展路徑下的碳排放量及世紀末暖化程度 ... 3-14 圖 3-10 全球社會經濟發展路徑之主要模型情境假設 ... 3-15 圖3-11 OECD Env-Growth 模式所預測 2030 年各國/區域經濟體在 5 個 SSP 情境下的 GDP 前景 ... 3-17 圖 3-12 IIASA 模式所預測 2030 年各國/區域經濟體在 5 個 SSP 情境下的 GDP 前景 ... 3-18 圖 3-13 台灣 2030 年各 SSP 情境之人口成長預測與經濟成長前景 ... 3-19 圖 3-14 OECD Env-Growth 模式之 SSP 預測情境下台灣 2030 年的各產業 部門實質產出水準 ... 3-21 圖3-15 IIASA 模式之 SSP 預測情境下台灣 2030 年的各產業部門實質產出 水準 ... 3-22
圖 3-16 IIASA 模式之 SSP 預測情境下台灣 2030 年的各產業部門產值結 構:相較於 2011 年 ... 3-23 圖 3-17 2030 年各國/區域經濟體在 5 個 SSP 情境下的出口前景:根據 IIASA 模式之成長預測情境 ... 3-24 圖 3-18 2030 年各國/區域經濟體在 5 個 SSP 情境下的進口前景:根據 IIASA 模式之成長預測情境 ... 3-25 圖 3-19 2030 年各國/區域經濟體在 5 個 SSP 情境下的出口值變動:根據 IIASA 模式之成長預測情境 ... 3-26 圖 3-20 2030 年各國/區域經濟體在 5 個 SSP 情境下的出口值變動:根據 IIASA 模式之成長預測情境 ... 3-27 圖 3-21 OECD-EnvGrowth 模式之 SSP 預測情境下台灣 2030 年的農業部 門用地需求 ... 3-29 圖 3-22 IIASA 模式之 SSP 預測情境下台灣 2030 年的農業部門用地需求 ... 3-29 圖 3-23 OECD-EnvGrowth 模式之 SSP 預測情境下台灣 2030 年的製造業 部門用地需求 ... 3-31 圖 3-24 IIASA 模式之 SSP 預測情境下台灣 2030 年的製造業部門用地需 求 ... 3-32 圖 3-25 全國產業產出之區域配置: 不完全替代 ... 3-34 圖 3-26 民國 95 年及 100 年全國各縣市工商服務業產業產出之成長情形
(資料來源:繪自全國工商普查統計 ... 3-34 圖 3-27 桃園市耕地面積變遷趨勢 ... 3-35 圖 3-28 桃園市工業用地面積變遷趨勢:105 年與 100 年 ... 3-36 圖 3-29 CLUE-s 模式架構圖 ... 3-40 圖 3-30 CLUE-s 模式結構組成 ... 3-42 圖 3-31 土地利用轉移順序... 3-43 圖 3-32 選用之環境變數(a)高程;(b)坡度(c)與國道之距離 (d)與省道之距 離 (e)與河流距離 ... 3-44 圖 3-33 不同模式所模擬之各類別土地利用 AUC 值 ... 3-47
圖 3-34 以 CLUE-s 模式模擬之桃園市 2014 年土地利用 ... 3-49 圖 3-35 土地利用模擬驗證結果 ... 3-50 圖 3-36 SSP3 及 SSP5 情境下推估之未來土地利用空間分布 ... 3-52 圖 4-1 國土功能分區示意圖... 4-1 圖 4-2 結合國土規劃與全球經濟模式分析未來土地利用空間分布流程圖 ... 4-15 圖 4-3 桃園市國土功能分析模擬結果 ... 4-15 圖 4-4 限制情境一下桃園市之林地變遷分布圖 ... 4-20 圖 4-5 限制情境一下桃園市之農地變遷分布圖 ... 4-20 圖 4-6 限制情境一下桃園市之建地變遷分布圖 ... 4-21 圖 5-1 分散式治水評估方式雛形架構初步規劃 ... 5-2 圖 5-2 DHSVM 模式架構流程圖 ... 5-4 圖 5-3 模擬植生與根層之水平衡關係 ... 5-5 圖 5-4 飽和的次表面流格網運算示意圖 ... 5-9 圖 5-5 桃園淹水模擬山區邊界... 5-10 圖 5-6 第一區(山區編號 1-5)各網格地表最大水深(20120611 豪雨) ... 5-10 圖 5-7 第一區(山區編號 1-5)各網格地表最大水深(2012 蘇拉颱風) ... 5-11 圖 5-8 第一區(山區編號 1-5)各網格地表最大水深(20160516 豪雨) ... 5-11 圖 5-9 第一區(山區編號 1-5)各網格地表最大水深(20160602 豪雨) ... 5-12 圖 5-10 第一區(山區編號 1-5)各網格地表最大水深(50 年重現期限制情境 一) ... 5-12 圖 5-11 第一區(山區編號 1-5)各網格地表最大水深(50 年重現期限制情境 二) ... 5-13 圖 5-12 第一區(山區編號 1-5)各網格地表最大水深(50 年重現期限制情境 三) ... 5-13 圖 5-13 第二區(山區編號 6-11)各網格地表最大水深(20120611 豪雨) ... 5-14 圖 5-14 第二區(山區編號 6-11)各網格地表最大水深(2012 蘇拉颱風) ... 5-14 圖 5-15 第二區(山區編號 6-11)各網格地表最大水深(20160516 豪雨) ... 5-15 圖 5-16 第二區(山區編號 6-11)各網格地表最大水深(20160602 豪雨) ... 5-15
圖 5-17 第二區(山區編號 6-11)各網格地表最大水深(50 年重現期限制情境 一) ... 5-16 圖 5-18 第二區(山區編號 6-11)各網格地表最大水深(50 年重現期限制情境 二) ... 5-16 圖 5-19 第二區(山區編號 6-11)各網格地表最大水深(50 年重現期限制情境 三) ... 5-17 圖 5-20 建物網格示意圖 ... 5-19 圖 5-21 建物進水體積之相對面積比 示意圖 ... 5-20 圖 5-22 桃園市 20120611 豪雨模擬最大淹水深圖 ... 5-22 圖 5-23 桃園市 2012 蘇拉颱風模擬最大淹水深圖 ... 5-23 圖 5-24 桃園市 20160516 豪雨模擬最大淹水深圖 ... 5-24 圖 5-25 桃園市 20160602 豪雨模擬最大淹水深圖 ... 5-24 圖 5-26 桃園市 50 年重現期模擬最大淹水深圖(限制情境一) ... 5-25 圖 5-27 桃園市 50 年重現期模擬最大淹水深圖(限制情境二) ... 5-25 圖 5-28 桃園市 50 年重現期模擬最大淹水深圖(限制情境三) ... 5-26 圖5-29 下游地區淹水熱點分析結果(a)原淹水模擬結果;(b)鄰近範圍為 200 公尺所畫定之熱點;(c)鄰近範圍為 400 公尺所畫定之熱點;(d)鄰 近範圍為 1000 公尺所畫定之熱點 ... 5-29 圖 5-30 淹水逐時熱點分析結果(a)第 4 小時;(b) 第 8 小時;(c) 第 12 小 時;(d) 第 16 小時;(e) 第 20 小時;(f) 第 24 小時 ... 5-30 圖 5-31 上游山區第一區熱點分析結果(a) 2012 年蘇拉颱風;(b) 20160602 豪雨;(c) 20160516 豪雨;(d) 20160602 豪雨;(e) 50 年重現期(限 制情境一);(f) 50 年重現期(限制情境二);(g) 50 年重現期(限制情 境三) ... 5-31 圖 5-32 上游山區第二區熱點分析結果(a) 2012 年蘇拉颱風;(b) 20160602 豪雨;(c) 20160516 豪雨;(d) 20160602 豪雨;(e) 50 年重現期(限 制情境一);(f) 50 年重現期(限制情境二);(g) 50 年重現期(限制情 境三) ... 5-32 圖 5-33 下游地區淹水熱點分析結果(a) 2012 年蘇拉颱風;(b) 20160602 豪
雨;(c) 20160516 豪雨;(d) 20160602 豪雨;(e) 50 年重現期(限制 情境一);(f) 50 年重現期(限制情境二);(g) 50 年重現期(限制情境 三) ... 5-33 圖 5-34 Zonation 模式演算流程圖 ... 5-36 圖 5-35 以最大淹水深之熱點進行管制區範圍劃設 ... 5-38 圖 5-36 以逐時淹水深熱點進行管制區範圍劃設 ... 5-38 圖 5-37 以逐時淹水深直接進行管制區範圍劃設 ... 5-39 圖 5-38 上游山區第一區之管制區劃設結果 ... 5-39 圖 5-39 上游山區第一區之管制區劃設結果 ... 5-40 圖 5-40 下游地區管制區劃設結果 ... 5-40
第一章 前言
計畫緣起
隨著全球化的發展,社會、經濟與自然環境間具有交互影響的關係,
而全球暖化下的氣候變遷情勢,使跨域水資源管理、環境污染等議題也 從而顯現。臺灣經濟型態亦深受全球化效應影響,民眾更易聚集於經濟 活動較頻繁的區域,使得都市化的情況加劇;極端氣候條件下的降雨事 件,其強度與頻率均較以往劇烈,進而衍生更為嚴峻的區域淹水問題,
107 年 0823 熱帶低壓暴雨引致的南部地區淹水災情即是明證。此外,
由於氣候變遷不確定性因素較多,評估降低氣候變遷所造成的影響時,
應以風險管控為出發點,並採取分散式的調適策略為宜。
遙耦合(Telecoupling)為一瞭解全球超聯結之物理與社會現象,以及 實 現 其 永 續 發 展 的 研 究 方 法 , 遙 耦 合 之 概 念 緣 起 於 遙 連 結 (Teleconnection),遙連結起源於氣候科學研究,探討某地區氣候受其他 遙遠地區自然作用影響;而後社會科學將其延伸應用於人與環境間的 遠距複合關係,如結合遙連結於自然科學與社會科學,以研究人類與自 然環境間的互動與整合關係,這些探討跨領域學科間交互影響關係之,
如社會-生態系統、社會-環境系統、社經-生態系統、人口-環境系統等,
則稱之為遙耦合。因此,透過遙耦合框架可深入分析、釐清與區別距離 甚遠的多個不同系統間的複雜關係。而為瞭解影響區域尺度到全球尺 度永續性的各類因子,則需建立一套全面性的空間分析工具,以描述並 量化遠距的多種社會經濟與環境的相互作用,進而探討系統交流與跨 距整合等課題。
遙連結最早是 Bjerknes (1969)研究結果發現赤道東風表面風應力 造成太平洋赤道中部與東部海洋表面溫度異常的原因,這種跨空間、跨 時間尺度對於各項自然反應影響之行為稱為遙連結,而經由地氣交換 行為導致異地水文系統變化(Wang-Erlandsson et al., 2018),或是地表變 遷改變土地與大氣間的交互作用,使得土壤水分可透過蒸發散量及地
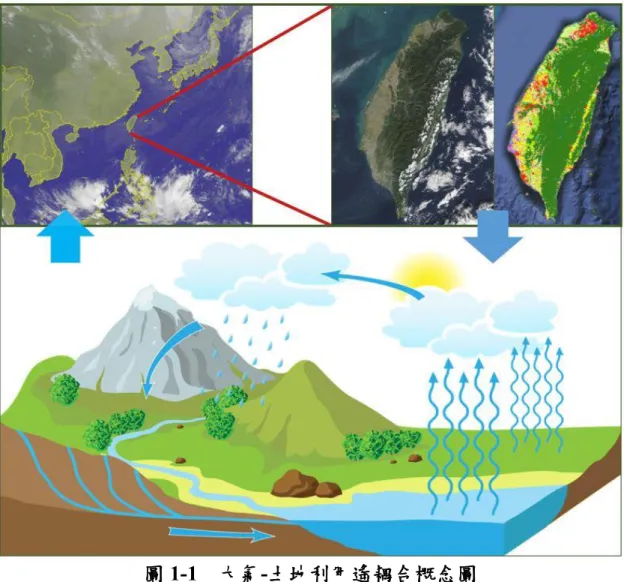
表能量平衡變化,直接影響局部降水(Hsu et al., 2017; Kanamitsu & Mo, 2003; Wey et al., 2015),或是透過大氣環流的變化間接地影響到降水型 態與強度(Chen et al., 2018; Hsu et al., 2017)(詳圖 1-1)則屬於討論大氣、
水文與土地利用間之遙耦合關係。
圖 1-1 大氣-土地利用遙耦合概念圖
為距離過長而不容易被發現,因此需要透過土地利用溢出機制,討 論土地、市場、科技、資訊與經濟之連結(Faust et al., 2000),透過社會 地理學、社會經濟學、人類學等社會學理論討論全球生產與全球價值鏈 (Isakson, 2014; Munroe, Croissant, & York, 2005)(詳圖 1-2)。在全球化的 影響下,土地利用改變受到全球經濟的影響,以中國與巴西間的大豆貿 易為例,由於中國向巴西進口大量大豆,促使巴西開墾大量農地種植大
豆,造成巴西雨林系統地損失,而中國則因此得以復甦其自然生態系統 (da Silva et al., 2017; Torres et al., 2017),全球對橡膠原料的需求也促使 寮國與越南大量種植橡膠樹,導致農地面積改變與移動(Baird & Fox, 2015)。據此,土地利用變遷已經不僅只是區域性人類行為與自然環境 之間的交互作用,各項跨國交流、各國政策及國際公約等可能導致土地 利用改變,台灣地區經濟成長深受國際經濟景氣影響,土地利用需求也 將因為經濟行為及各項政策影響而改變,因此,透過全球經濟模式推估 未來可能之經濟發展情境,進而瞭解未來土地利用需求改變是有其必 要性。
圖 1-2 經濟-土地利用遙耦合概念圖
因此以全球化導致整體環境的改變為例,藉由結合遙連與全球經 濟模式,可分析不同經濟活動對氣候及土地利用改變之影響,有助瞭解 未來氣候在區域及全球尺度的變異;而結合遙連結與氣候模式,則可探 討氣候及經濟活動對未來區域降雨型態與淹水特性的影響,進而規劃 氣候變遷下之新興治水策略。
縱觀當前氣候變遷衝擊下之全球環境,浮現於各領域表象間之關 鍵課題,其內涵實存在繁複之連動關係,非單一面向之應對措施所能含