國立臺灣大學生物資源暨農學院農業化學系 碩士論文
Department of Agricultural Chemistry College of Bioresources and Agriculture
National Taiwan University Master Thesis
銅鐵雙金屬奈米顆粒結合 Fenton 反應接續礦化移除 四溴雙酚 A
Removal of tetrabromobisphenol A by Cu/Fe bimetallic nanoparticles and sequential mineralization with a
Fenton reaction
郭進順 Chin-shun Kuo
指導教授:施養信 博士 Advisor: Yang-hsin Shih, Ph.D.
中華民國 106 年 2 月
February 2017
摘要
四溴雙酚 A (Tetrabromobisphenol, TBBPA)是最被廣泛使用的溴化阻燃劑,由 於不當的貯存和處置,導致 TBBPA 已經在多種環境基質,甚至是人體中被偵測 到。此外,許多前人研究顯示,TBBPA 可能會對人體造成負面的影響,因此,
開發出一個有效的 TBBPA 整治方法是非常重要的。奈米零價鐵已經成功地被應 用於處理含鹵有機汙染物,而藉著第二種金屬當催化劑,形成的雙金屬顆粒能更 有效地處理含鹵有機汙染物。然而 TBBPA 降解的副產物具有類似內分泌干擾素 的能力,在此研究中,也將進一步探討 Fenton 反應對於 TBBPA 脫溴副產物移 除之效率。銅鐵雙金屬奈米顆粒能快速及有效地使 TBBPA 脫溴。在銅添加量上,
4.0 % 的銅在銅鐵奈米顆粒上,具有最高的移除效率 99.8 %,其擬一階速率常數
為 0.229 min-1。此外,當銅鐵雙金屬奈米顆粒劑量增加及 TBBPA 初始濃度下降
時,TBBPA 反應動力隨之上升。在 TBBPA 初始濃度為 5.0 mg/L,銅鐵雙金屬奈 米顆粒劑量為 2.0 g/L 時,TBBPA 在 30 分鐘內會被完全移除,在反應期間,較 低溴數的副產物和溴離子會被偵測到。銅鐵雙金屬奈米顆粒移除 TBBPA 之反應 速率隨溫度增加而增加,並計算出活化能為 35.64 kJ/mole,顯示此反應為表面控 制之作用。在水溶液 pH 值的影響上,銅鐵雙金屬奈米顆粒較偏好在酸性環境下
移除 TBBPA。當 pH 值從 9.0 降低到 5.0 時,反應速率常數從 0.191 min-1增加到
0.228 min-1,pH 值持續地下降到 3.0 時,反應速率常數則會下降至 0.162 min-1。
另外,在 pH 3.0 到 pH 9.0 間,其 TBBPA 的移除效率無顯著差異,皆高於 98.5 %。
然而,在 pH 11.0 時,其移除效率及反應速率常數則分別只有 77.0 % 和 0.063
min-1。Cu/Fe 雙金屬奈米顆粒可將 TBBPA 完全脫溴,藉由其脫溴副產物:三溴
雙酚 A、二溴雙酚 A、一溴雙酚 A 及雙酚 A (BisphenolA, BPA) 推測出其降解途 徑。原則上,藉由銅鐵雙金屬奈米顆粒反應後鐵氧化生成的鐵離子及額外添加的
H2O2,使 TBBPA 脫溴最終副產物 BPA 可利用 Fenton 反應移除。在 BPA 溶液中,
增加 H2O2或 Fe2+濃度,會增加 BPA 的移除速率;然而,過高的 H2O2或 Fe2+濃 度,會降低 BPA 的移除速率,分別為從 0.015 min-1降到 0.0107 min-1及 0.015 min-1
降到 0.0004 min-1。合成的銅鐵雙金屬奈米顆粒對於處理 TBBPA 有相當高的潛
力,且結合 H2O2能有效地礦化大部分的 TBBPA 與其脫溴副產物。
關鍵字:四溴雙酚 A、雙酚 A、銅鐵雙金屬奈米顆粒、脫溴
Abstract
Tetrabromobisphenol A (TBBPA) is one of the most widely used brominated flame retardant. Due to its extensive usage and then improper storage and disposal, it has been detected in various environmental matrices and even human bodies.
Moreover, many previous studies showed the results that TBBPA could cause many negative effects on human bodies. Thus, exploiting an effective method for TBBPA treatment is important. Nanoscale zero-valent iron has been successfully applied for treating halogenated organic pollutants. With a secondary metal as the catalyst, bimetallic nanoparticles (BNPs) become more efficient. However, the byproducts of TBBPA degradation have the ability like endocrine disruptor. In this study, we further investigated Fenton reaction for final TBBPA debrominated byproducts.
The results showed that Cu/Fe BNP aggregates demonstrated a fast and effective debromination of TBBPA. For copper doping, Cu/Fe NPs in 4.0 % copper ratio had the highest removal efficiency with a pseudo-first order rate constant of 0.229 min-1. Furthermore, reaction kinetics increased as the decreased initial TBBPA concentrations and the increased dosages of Cu/Fe BNPs. At the initial TBBPA concentration of 5.0 mg L-1, TBBPA could be completely removed within 30 min by a Cu/Fe NPs dosage of 2.0 g L-1, and less brominated byproducts and bromide ions were detected during the reactions. The activation energy of the TBBPA removal with Cu/Fe BNPs was 35.64 kJ/mole, indicating that the removal of TBBPA by Cu/Fe BNPs is surface-control mechanism. For the effect of aqueous pH, TBBPA removal by Cu/Fe NPs favored acid and neutral conditions. The removal rate constant increased from 0.191 to 0.228 min-1 with the decrease of pH from 9.0 to 5.0. The removal rate constant decreased to 0.162 min-1 with continuously dropped the pH to
3.0. Besides, the removal efficiencies were over 98.5 % and have no obvious difference at pH 3.0 to 9.0. However, at pH 11.0, the removal efficiency only 77.0 % with removal rate constant of 0.063 min-1. The complete debromination pathways of TBBPA with Cu/Fe were also presented by the identified byproducts:
tribromobisphenol A, dibromobisphenol A, bromobisphenol A, and bisphenol A (BPA). In principle, the removal of the final debrominated byproduct, BPA, can be degraded by Fenton reaction through residual iron ions and additional H2O2. In BPA solutions, the increase of either H2O2 or Fe2+ concentration increased the BPA removal rate. However, a higher concentration of H2O2 or Fe2+ (both are 2.5mM) cause the BPA removal rate constant drop from 0.015 min-1 to 0.0107 min-1 and from 0.015 min-1 to 0.0014 min-1, respectively. The results demonstrated that our synthesized Cu/Fe bimetallic nanoparticles have a high potential for TBBPA treatment and combine with H2O2 to degrade most TBBPA debrominated byproducts effectively.
Keyword: tetrabromobisphenol A (TBBPA), bisphenol A (BPA), Cu/Fe bimetallic nanoparticles (Cu/Fe BNPs), debromination
Tables of contents
摘要... I Abstract………. II List of Tables ... VII List of Figures ... VIII
Chapter 1 Introduction ... 1
Chapter 2 Literature Review ... 3
2-1 Introduction of tetrabromobisphenol A ... 3
2.2 The fate of TBBPA in the environment ... 6
2.3 Effects of TBBPA in biota ... 7
2.3.1 Effect in aquatic organisms ... 7
2.3.2 Effect in terrestrial organisms ... 9
2.3.3 Bioaccumulation of TBBPA ... 10
2.3.4 Human hazard potential ... 10
2.4 Introduction of zero valent iron and bimetallic particles ... 11
2.4.1 Microscale zero valent iron ... 11
2.4.2 Nanoscale zero valent iron ... 15
2.4.3 Ion-based bimetallic nanoparticles ... 15
2.5 The approaches of TBBPA removal ... 17
2.5.1 Photodegradation ... 18
2.5.2 Biodegradation ... 18
2.5.3 NZVI and iron-based bimetallic nanoparticles ... 19
2.5.4 Fenton reaction... 20
Chapter 3 Material and methods ... 21
3.1 Chemicals ... 21
3.2 Synthesis of NZVI, Ni/Fe, and Cu/Fe nanoparticles ... 21
3.3 Characterization of the synthesized Cu/Fe nanoparticles ... 22
3.3.1 Field-emission scanning electron microscope, FE-SEM ... 23
3.3.2 Transmission electron microscope, TEM ... 23
3.3.3 Dynamic light scattering, DLS ... 24
3.3.4 Brunauer-Emmett-Teuller surface area ... 24
3.3.5 X-ray diffraction, XRD ... 25
3.3.6 X-ray absorption near edge structure, XANES ... 25
3.3.7 Raman Spectroscopy ... 26
3.4 Batch experiments ... 26
3.4.1 The effects of Cu content and Cu/Fe dosage on the removal of TBBPA with Cu/Fe nanoparticles ... 26
3.4.2 The effect of TBBPA concentration on the removal of TBBPA with Cu/Fe nanoparticles ... 27
3.4.3 The effect of initial pH on the removal of TBBPA with Cu/Fe nanoparticles ... 28
3.4.4 The effect of initial temperature on the removal of TBBPA with Cu/Fe nanoparticles ... 28
3.4.5 Further H2O2 treatment ... 29
3.5 Analysis methods of TBBPA and its byproducts ... 29
3.5.1 TBBPA and BPA stock solutions ... 29
3.5.2 Extraction method of TBBPA in solid and aqueous phase ... 29
3.5.3 Analytical methods of TBBPA ... 30
3.5.4 Analysis of byproducts ... 30
3.5.5 Anion analysis ... 31
3.5.6 Cation analysis ... 32
3.5.7 TOC analysis ... 32
3.6 TBBPA removal modeling ... 33
3.6.1 TBBPA removal rate constants ... 33
3.6.2 Removal efficiency ... 33
3.6.3 Debromination efficiency ... 34
3.6.4 Adsorption ratio and degradation ratio ... 34
Chapter 4 Results and Discussion ... 36
4.1 Characterization of Cu/Fe nanoparticles ... 36
4.2 Effect of copper percentage on the removal of TBBPA by Cu/Fe nanoparticles ... 42
4.3 Effect of dosage of Cu/Fe on the removal of TBBPA by Cu/Fe nanoparticles ... 47
4.4 Effect of initial TBBPA concentration on its removal by Cu/Fe nanoparticles ... 50
4.5 Effect of temperature on the removal of TBBPA by Cu/Fe nanoparticles ... 54
4.6 Effect of initial pH on the removal of TBBPA by Cu/Fe nanoparticles…...56
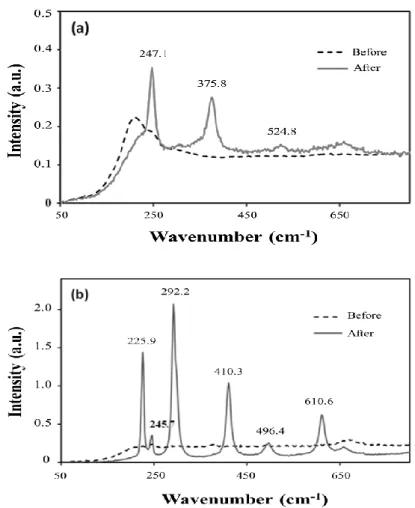
4.7 The surface property change of Cu/Fe nanoparticles after reaction ... 62
4.8 The proposed debromination pathways of TBBPA by Cu/Fe nanoparticles .. 63
4.9 Effect of H2O2 concentration on the removal of BPA by Fenton reaction ... 64
4.10 Effect of Fe2+ concentration on the removal of BPA by Fenton reaction .... 66 Chapter 5 Conclusions ... 69 Reference. ... 71 Appendix. ... 82
List of Tables
Table 2-1 Estimated annual worldwide market demand of BFRs in 2001 by region, and total estimated demand in 2002 and 2003. ... 4 Table 2-2 Physical-chemical properties of TBBPA. ... 5 Table 2-3 Toxicity of TBBPA to fish. ... 9 Table 2-4 The standard reduction potentials of various elements for aqueous solutions at 25 °C. ... 12 Table 2-5 Standard redox potentials (E0) in aqueous solution at 25 °C. ... 17 Table 4-1 The linear combination fitting of Fe K-edge XANES spectra of Cu/Fe nanoparticles before and after reaction ... 40 Table 4-2 The linear combination fitting of Cu K-edge XANES spectra of Cu/Fe nanoparticles before and after reaction. ... 41 Table 4-3 The removal rate constants and removal efficiencies of TBBPA by Cu/Fe nanoparticles at various percentages of copper ... 44 Table 4-4 The removal rate constants and removal efficiencies of TBBPA by Cu/Fe nanoparticles at various Cu/Fe dosages ... 49 Table 4-5 The removal rate constants, removal efficiencies and debromination efficiencies of TBBPA by Cu/Fe nanoparticles at various initial TBBPA concentration. ... 52 Table 4-6 The removal rate constants, removal efficiencies and debromination efficiencies of TBBPA by Cu/Fe nanoparticles at various temperature ... 55 Table 4-7 The removal rate constants, removal efficiencies and debromination efficiencies of TBBPA by Cu/Fe nanoparticles at various solution pH... 59
List of Figures
Figure 2-1 The structure of TBBPA ... 5 Figure 2-2 Proposed pathways for reductive dehalogenation in anoxic Fe-H2O system
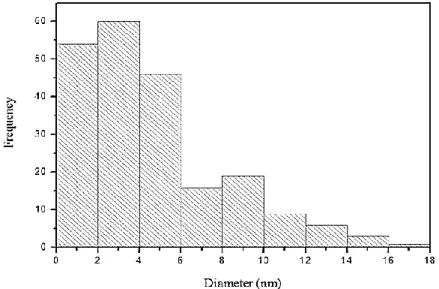
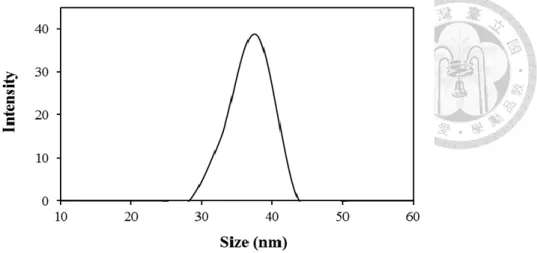
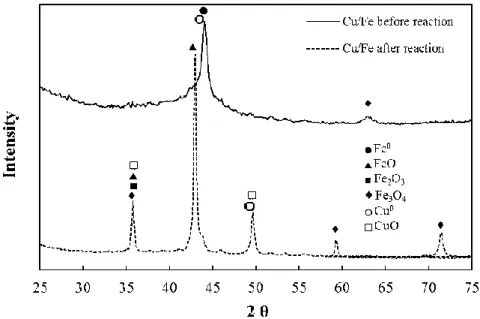
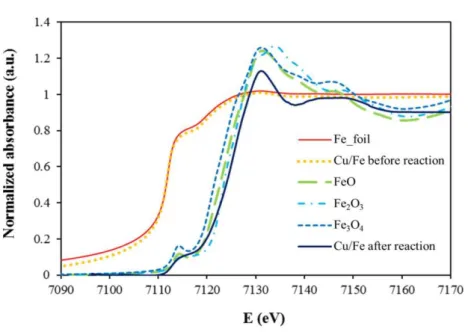
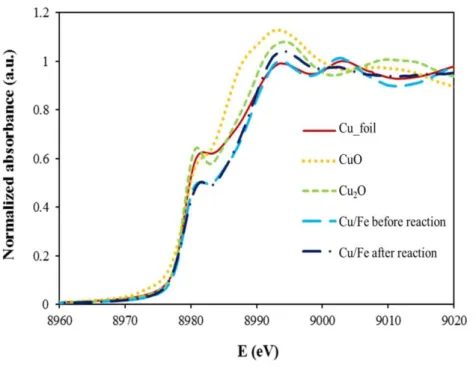
... 14 Figure 2-3 The pH-Eh diagram for iron oxides and hydroxides at 25 oC ... 14 Figure 2-4 Mechanisms of reductive dechlorination by monometallic nZVI and palladium-doped nZVI ... 17 Figure 4-1 The electron microscopy images of Cu/Fe nanoparticles: (a) and (b) TEM, (c) and (d) SEM. (a) dispersion, (b) chain-liked aggregates, (c) and (d) aged nanoparticles. . ... 37 Figure 4-2 The particle size distributions for Cu/Fe nanoparticles calculated from Figure 4-1a. ... 37 Figure 4-3 The particle size distributions for Cu/Fe nanoparticles by DLS. ... 38 Figure 4-4 SEM energy-dispersive spectroscopy of Cu/Fe nanoparticles ... 38 Figure 4-5 The XRD pattern of Cu/Fe bimetallic nanoparticles before and after reactions ... 39 Figure 4-6 Fe K-edge XANES spectra of Cu/Fe nanoparticles before and after reaction. ... 40 Figure 4-7 Cu K-edge XANES spectra of Cu/Fe nanoparticles before and after reaction.. ... 41 Figure 4-8 Raman spectra of Cu/Fe nanoparticles (a) pH 7.0 (b) pH 11.0. ... 42 Figure 4-9 Effect of Cu content on the removal of TBBPA by Cu/Fe nanoparticles ... 44 Figure 4-10 The concentration of (a) Br- and (b) BPA with TBBPA removed by Cu/Fe nanoparticles with different Cu content ... 46 Figure 4-11 Effect of Cu/Fe nanoparticle dosages on the removal of TBBPA by Cu/Fe nanoparticles ... 48 Figure 4-12 The concentration of (a) Br- and (b) BPA generated from TBBPA by Cu/Fe nanoparticles as a function of the Cu/Fe dosage. ... 50 Figure 4-13 Effect of initial concentration of TBBPA on the removal of TBBPA by Cu/Fe nanoparticles ... 51 Figure 4-14 Effect of initial concentration of TBBPA on the removal amount in mg (TBBPA)/ g (Cu/Fe nanoparticles) ... 53 Figure 4-15 Effect of temperature on the removal of TBBPA by Cu/Fe nanoparticles
... 54 Figure 4-16 The plot of ln (k) versus 1/T: for TBBPA removal by Cu/Fe nanoparticles..
... 55
Figure 4-17 The concentration of Br- generated from TBBPA by Cu/Fe nanoparticles with various temperature ([TBBPA] = 5 mg/L and Cu content is 4 %). ... 56 Figure 4-18 Effect of initial pH on the removal of TBBPA by Cu/Fe particles. The reaction solutions initially contained 2.0g/L of Cu/Fe particles and 5.0 mg/L of TBBPA... ... 57 Figure 4-19 The pH change with time during the reactions at different initial pHs.. .. 58 Figure 4-20 Effect of pH on the degradation and adsorption of TBBPA reacted with Cu/Fe nanoparticles after 20 min reaction. ... 60 Figure 4-21 Time dependent concentration profiles for the intermediates and final product at initial solution pH: (a) 3.0, (b) 5.0, (c) 7.0, (d) 9.0, and (e) 11.0..
... 61 Figure 4-22 The debromination pathway of TBBPA by Cu/Fe nanoparticles. ... 63 Figure 4-23 HRESI/MS chromatogram of TBBPA degradation intermediates ... 64 Figure 4-24 Effect of H2O2 concentration on the removal of BPA by Fenton reaction.
... 64 Figure 4-25 The rate constants and removal efficiency for the removal of BPA by Fenton reaction with various concentration of H2O2. ... 65 Figure 4-26 The mineralization of BPA by Fenton reaction with various concentration of H2O2 ... 66 Figure 4-27 Effect of Fe2+ concentration on the removal of BPA by Fenton reaction . 67 Figure 4-28 The rate constant and removal efficiency for the removal of BPA by Fenton reaction with various concentration of Fe2+ ... 68 Figure 4-29 The mineralization of BPA by Fenton reaction with various concentration of Fe2+ ... 68
Chapter 1 Introduction
For fire safety of products, brominated flame retardant (BFR) has been widely used in the world and is ubiquitous in many environmental media.
Tetrabromobisphenol A (TBBPA) is a most-produced BFR. In order to meet safety standards, TBBPA is introduced into a variety of manufacturing polymer products with two kinds of forms: reactive (~90%) and additive form (Nakajima et al., 2009).
Due to its volume of usage increasing as a replacement for banned BFRs and non-chemically bound, the additive form was suspected to release into environmental media (ECB, 2006; de Wit et al., 2010). A growing body of studies has confirmed that TBBPA has thyroid hormonal activity (Li et al., 2015; Covaci et al., 2009; Chan and Chan, 2012), neurotoxicity (Hendriks et al., 2012; Wojtowicz et al., 2014), cytotoxicity (Reistad et al., 2007; Ogunbayo and Michelangeli, 2007), hepatotoxicity (Szymanska et al., 2000; Ronisz et al.,2004), and it could cause immunological effects (Darnerud, 2003; Watanabe et al., 2010; Koike et al., 2013).
Many technologies have been used to remove TBBPA from the environment, such as chemical oxidation (Han et al., 2008; Lin et al., 2009; Qu et al., 2015), direct photolysis (Wang et al., 2015c), photocatalytic degradation (Xu et al., 2011), biodegradation (Ronen and Abeliovich, 2000; Chang et al., 2012), and chemical reduction (Liu et al.,2009; Lin et al., 2012). Particularly, for chemical reduction, zero valent iron (ZVI) has been widely used for treating many organic contaminants in contaminant sites (Song and Carraway, 2005; Puls et al., 1999). Furthermore, iron-based bimetallic nanoparticles were also capable of removing halogenated organic compounds with high efficiencies (Smuleac et al., 2011; Parshetti and Doong, 2012). When TBBPA was degraded via debromination (Luo et al., 2010; Huang et al.,
2013; Li et al., 2016), the TBBPA debrominated byproducts especially bisphenol A (BPA), which is an endocrine disruptor may cause negative effect in human bodies (Vom Saal et al., 2012). Fenton reaction could be a good method to degrade the TBBPA debrominated byproducts by only adding H2O2 with Fe2+ from iron oxidization (Moon et al., 2011; Li et al., 2013).
The aims of the research were to investigate following objectives:
1. To study the degradation of TBBPA by Cu/Fe bimetallic nanoparticles with various parameters (The effects of Cu loading, Cu/Fe dosage, TBBPA initial concentration, temperature and pH were carried out).
2. To study the mechanisms of the removal of TBBPA from water by Cu/Fe nanoparticles.
3. To study the removal of TBBPA debrominated byproducts by Fenton reaction.
Chapter 2 Literature Review
2.1 Introduction of tetrabromobisphenol A
Tetrabromobisphenol A (TBBPA) and its derivatives were a group of brominated organic compounds. Especially, TBBPA was the most-produced compound used as brominated flame retardant (BFR) with 58.8% bromine (de Wit et al., 2010), which was produced from bromination of bisphenol A (BPA). The size of the global TBBPA market was 170,000 tons in 2004 (George and Häggblom, 2008). TBBPA was accounted for 58.7 % of total world market demand of BFRs (BSEF, 2001). Table 2-1 gives the estimated annual market demand for the major BFRs for the years 2001–
2003 (BSEF, 2006). TBBPA is introduced into manufacturing polymer applications in either a chemical bound reactive flame retardant (~90%) or an additive flame retardant (Nakajima, 2009). Reactive form was chemically bound to the material and thus do not migrate out of the material. TBBPA is also increasingly being used as an additive flame retardant in ABS plastics, as a replacement for banned BFRs (de Wit et al., 2010). A risk assessment has been performed within the European Union (EU), it concluded that, no health or environmental risks were identified when TBBPA is used in reactive form (EC, 2008). However, the risk of TBBPA degradation byproduct, bisphenol A and TBBPA derivative, dimethylated TBBPA had to further be certified.
In addition, the risk assessment also concluded that there is a need for specific measures to limit risks when TBBPA is used as an additive flame retardant (EC, 2008).TBBPA had been found in various environments. Moreover, many studies have confirmed that TBBPA can cause many diseases, including immunotoxicity (Pullen et al., 2003), neurotoxicity (Viberg and Eriksson, 2011), disruption of thyroid homeostasis (Meerts et al., 2000; Kitamura et al., 2002), cytotoxicity
(Decherf et al., 2010) and hepatotoxicity (Szymanska et al., 2000). Therefore, developing an effective method to remove TBBPA from environments is essential.
Figure 2-1 shows the structure of TBBPA.
Table 2-2 shows the chemical and physical properties of TBBPA. TBBPA (CAS No. 79-94-7) is a crystalline solid. The chemical formula is C15H12Br4O2. The melting point and the boiling point of TBBPA are 178 oC and over 200 oC, respectively. It is limited solubility in water, and previous reports determined the water solubility of TBBPA at neutral condition is between 0.24-4.16 mg/L (GC, 2013; U.S. EPA, 2015) and it depends on pH (Han, 2008). The pKa values for TBBPA are 7.5 and 8.5 (EFSA, 2011), indicating that it is a neutral compound in a neutral condition and the water solubility increases as pH increases (Nollet, 2011).
Table 2-1 Estimated annual worldwide market demand of BFRs in 2001 by region, and total estimated demand in 2002 and 2003 (metric tons) (BSEFa, 2006).
PentaBDE OctaBDE DecaBDE TBBPA HBCD
Americasb 7,100 1,500 24,500 18,000 2,800
Europe 150 610 7,600 11,600 9,500
Asia 150 1,500 2,300 89,400 3,900
Total (2001) 7,500 3,790 56,100 119,700 16,700
Total (2002) - - 65,700 150,600 21,400
Total (2003) - - 56,400 145,100 22,000
a BSEF was an abbreviation of Bromine Science and Environmental Forum.
bAmericas includes North and South America, but North America, particularly the USA, is the major user.
Figure 2-1 The structure of TBBPA.
Table 2-2 Physical-chemical properties of TBBPA (Adapted from USEPA, 2015)
a European Union (EU) (2012)
b Li et al. (2015) and Kuramochi et al.(2008)
c WHO (1995) and Kuramochi et al.(2008)
d Zhang et al. (2015)
e USEPA (2015)
Property Statement and value
CAS No. 79-94-7
Color Powder white or colorless
Chemical formula C15H12Br4O2
Molecular mass (g/mol) 543.88
Melting point (°C) 178
Boiling point (°C) >200
Density (g/cm3) 2.12
Water solubility (mg/L) 0.24a-4.16b Vapor pressure (mm Hg) <1x10⁻⁶
pKa 7.5/8.5
Log Kow 4.5c-9.7d
Log Koce
5.4
Henry’s law constanta <1.0 × 10⁻¹⁰ atm.m3/mole
2.2 The fate of TBBPA in the environment
TBBPA has been detected in various environmental media (Sun et al., 2014) since it would possible release into the environment from source during manufacture, utilization, and disposal (such as recycling, incineration and deposit at landfill) of TBBPA-containing products. Because TBBPA is manufactured in bulk mass production and used widely for many artificial products, TBBPA is widespread in the world. For example, there are many disposals of electronic wastes (e-wastes), in which a large number of TBBPA were addicted and peripheral equipment during the manufacturing process. U.S. EPA released toxics release inventory (TRI) report to indicate that 52 manufacturing and processing facilities released or disposed approximately 127,845 pounds of TBBPA (U.S. EPA, 2015). TBBPA would be persistent in a variety of environmental media. In fact, TBBPA has been detected in various environmental media including soil (Huang et al., 2014; Matsukami et al., 2015), sediment (Wang et al., 2015a; He et al., 2013), sewage sludge (Gorga et al., 2013; Morris et al., 2004), water (Harrad et al., 2009; Osako et al., 2004), dust (Zhou et al., 2014; Wang et al., 2015b), air (Ni and Zeng, 2013; Liu et al., 2016), and even biota samples (Cariou et al., 2008; Johnson-Restrepo, 2008).
TBBPA could transport from environment via various sources and exposure pathways. The important sources of TBBPA are its chemical manufacturing, processing and consumer product use. In chemical manufacturing and processing, dust (unintended exposure from incidental ingestion of inhaled particles/dust), diet (Soil/plants/livestock), and fish ingestion (surface water and sediment) were main exposure pathways. For consumer product use, products and indoor dust were major pathways. Especially, young children are likely to exhibit higher exposure than older children and adults due to their more prevalent object-to-mouth behavior (USEPA,
2015). Huang et al. (2014) also reported that the areas far from the point pollution sources were contaminated by fly ash deposition. Soil is one of the major sinks of TBBPA in the environment (Li et al., 2015). The concentration of TBBPA in soil was detected with 220 ng/g (Huang et al., 2014). However, a high concentration of TBBPA has been reported as 450 mg/kg in contaminated soil (Ronen and Abeliovich, 2000).
In soil, under anoxic conditions, TBBPA is mainly finally reduced to bisphenol A (BPA) (Liu et al., 2013); Under oxic condition, TBBPA can be O-methylated to form its mono- and dimethyl ethers (MeO-TBBPA and diMeO-TBBPA, respectively) (George et al., 2008). BPA, MeO-TBBPA and diMeO-TBBPA have negative effect for some organisms (McCormick et al., 2010; USEPA, 2015). These O-methylated derivatives are more lipophilic and more persistent in the environment than the parent compound (Sun et al., 2014), which could cause more problems with more difficult to treat these compounds. TBBPA has been found in human bodies (blood, breast milk and adipose tissue) (Cariou et al., 2008; Shi et al., 2013; Johnson-Restrepo et al., 2008) and in biota (aquatic and terrestrial organisms) (Johnson-Restrepo et al., 2008;
Yang et al., 2012). Additionally, it could cause many diseases in human bodies (Kitamura et al., 2002; Viberg and Eriksson, 2011).
In Taiwan, TBBPA is not a major chemical for environmental monitoring and few reports available (Ren, 2010). Most TBBPA pollution sources are chemical manufactory, but there is no TBBPA manufactory in Taiwan. All TBBPA chemicals in Taiwan are imported.
2.3 Effects of TBBPA in biota 2.3.1 Effect in aquatic organisms
TBBPA from manufacturing facilities could be disposed into the water;
furthermore, TBBPA in soil and sediment could leach and release into water. These pathways made the concentration of TBBPA in water increasing and could increase its exposure concentration and the opportunity to poison and even disease aquatic organisms. Plants have a high potential to accumulate TBBPA and its derivative from the soil (Sun et al., 2014). Sun et al. (2008) studied the uptake of TBBPA in coontail Ceratophyllum demersum L., and the result showed that TBBPA can be accumulated in plant in a large amount of 1.213 mg/g dry weight with exposure to 1.0 mg/L in 14 days. With exposure concentration and exposure time increasing, the production of reactive oxygen species (ROS) could be induced. It indicated that a significant damage which may occur in plants for TBBPA exposure. Moreover, several reports said that TBBPA was toxic to several aquatic invertebrates at low concentrations (USEPA, 2015). The EC50 value of 0.96 mg/L was determined by the experiment of acute exposure to TBBPA for freshwater aquatic invertebrates (Daphnia magna) (Waaijers et al., 2013). TBBPA caused lethality in the marine invertebrate species Acartia tonsa at a concentration of 0.40 mg/L (Wollenberger et al., 2002). Mussel (Mytilus edulis) reduced the shell length with a maximum acceptable toxicant concentration (MATC) of 0.023 mg/L was observed in a 70-day study (ACC, 2005).
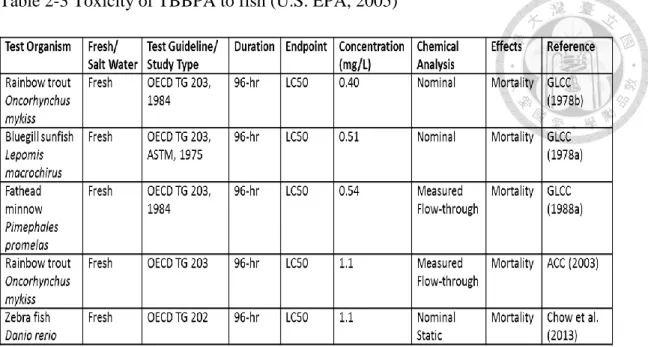
For sediment-dwelling worms, emergent insects and amphipods, the available sediment toxicity studies exhibited in the range of 117 - 500 mg/kg for the species tested. (USEPA, 2015; Krueger, 2002a, 2002b; ACC-BFRIP, 2006). Amphipods (Hyalella azteca) were exposed to TBBPA, resulting in the MATC of 354 mg/kg dry weight (ACC-BFRIP, 2006). Furthermore, acute toxicity studies were tested for a variety of fish species resulted in 96-hour LC50 values ranging from 0.40 to 1.1 mg/L (Table 2-3, GLCC,1978b,1988a).
Table 2-3 Toxicity of TBBPA to fish (U.S. EPA, 2005)
2.3.2 Effect in terrestrial organisms
TBBPA reached to the terrestrial environment because of human activities, e.g.
sewage sludge amendment, and natural dispersion. Wang et al. (2016) first demonstrated that rice cell suspension culture could accumulate and metabolize TBBPA. Moreover, the MATC of five plant species have been determined as 518, 32, 518, 127 and 518 mg/kg dry soil for corn, cucumber, onion, ryegrass and tomato, respectively (ACC-BFRIP, 2002). For soil invertebrate toxicity, an earthworm study was carried out and using reproduction as the endpoint (Sverdrup et al., 2006).
Exposing the earthworm (Enchytraeus crypticus) to TBBPA for 21 days, the lowest observed effect concentration and MATC were 10 and 5.5 mg/kg soil (dry weight), respectively (Sverdrup et al., 2006). Halldin et al. (2001) concluded that TBBPA’s transfer to the embryo from the yolk was low with rapid metabolism and excretion by the experiment that TBBPA was injected to quail yolk to evaluate its distribution and the potential for certain reproductive and endocrine effects in adult birds. TBBPA exposure in amphibians might cause adverse effects on the endocrine system (Brown
et al., 1996; Hanada et al., 2003; Kashiwagi et al., 1999), in other words, TBBPA changed the normal thyroid hormone-mediated gene expression (Veldhoen et al., 2006).
2.3.3 Bioaccumulation of TBBPA
The logKow of TBBPA is 4.5-9.7. Based on its the high logKow, TBBPA was expected to have a great potential for accumulating in biota. Nevertheless, there are two different results have been reported. One result reported that TBBPA has low bioaccumulation potential (Colnot et al., 2014; USEPA, 2015), and the other result showed the high potential bioaccumulation for TBBPA. Tao et al. (2016) measured the bioaccumulation factor (BAF) of TBBPA in mud carp and Chinese mystery snail in electronic waste site, about 2500 and 5190, which were very high. Szymanska et al.
(2001) also observed high concentrations of TBBPA in many tissue of Rat. The bioaccumulation of TBBPA is tissue-specific and species-specific (Tang, 2015).
2.3.4 Human hazard potential
There are two different results for TBBPA’s human hazardous potentials reported. Some reports from U.S. EPA and European Union concluded that no health hazards of potential concern to adults (U.S. EPA; EC, 2006). However, the data were not very clear and many available reports data were collected from adult animal experiment. On the contrary, the toxicity of TBBPA for newborns and adolescents has been paying attention in recent years. Fukuda et al. (2004) said that exposing to TBBPA caused slight kidney lesions at 200 mg/kg-bw/day in newborn rats and it was possibly due to immature metabolic capability. Tada et al. (2006) found very slight hepatocyte necrosis in offspring of female mice exposed to TBBPA at 140.5
mg/kg-bw/day during gestation through weaning of the offspring.
2.4 Introduction of zero valent iron and bimetallic particles 2.4.1 Microscale zero valent iron
For treatment of organic compounds and heavy metal contaminants, the utilization of zero valent metals including iron (Fe0), zinc (Zn0) (Wang et al., 2008;
Choi and Kim, 2009), aluminum (Al0) (Bokare and Choi, 2009; Lien et al., 2010; Liu et al., 2011), and copper (Cu0) (Huang et al., 2012; Raut et al., 2016) has received significant attention because of suitable redox potential, high reactivity, and effective cost. Zero valent iron (ZVI, Fe0) is one kind of metals that has been extensively studied and widely applied for treatment of environmental contaminants. It was well known for its high potential application in decomposition of halogenated organic compounds (Lowry and Johnson, 2004; Eggen and Majcherczyk, 2006)
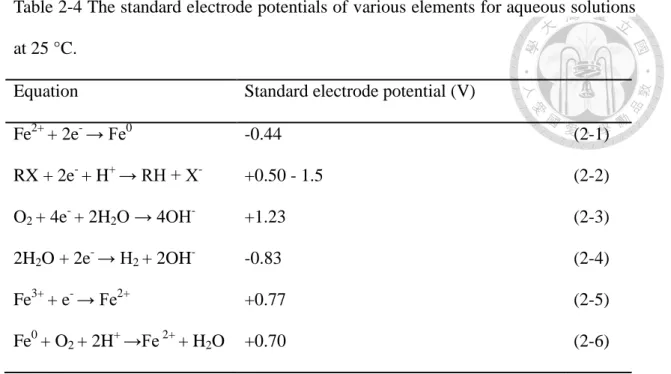
According to Table 2-4, the standard electrode potential of Fe2+/Fe0, -0.44 V (Eq.
2-1) (Bratsch, 1989), indicated Fe0 is a strong reductant. Alky halides (RX) were electronegative and their standard electrode potentials generally in the range from +0.5 to +1.5 V at pH 7 (Eq. 2-2) (Vogel et al., 1987). O2 is a strong oxidant and its standard electrode potential is +1.23 V (Eq. 2-3). The Fe2+ and H2 could be produced and play a role of reducing agent during the ZVI reduction reaction in aqueous solutions. The standard electrode potential of H2O in Eq. 2-4 was -0.83 V. Fe2+ has the standard electrode potential of +0.77 V (Eq. 2-5).
Table 2-4 The standard electrode potentials of various elements for aqueous solutions at 25 °C.
Equation Standard electrode potential (V)
Fe2+ + 2e- → Fe0 -0.44 (2-1)
RX + 2e- + H+ → RH + X- +0.50 - 1.5 (2-2)
O2 + 4e- + 2H2O → 4OH- +1.23 (2-3)
2H2O + 2e- → H2 + 2OH- -0.83 (2-4)
Fe3+ + e- → Fe2+ +0.77 (2-5)
Fe0 + O2 + 2H+ →Fe 2+ + H2O +0.70 (2-6)
In the reaction, three reductants (iron metal, ferrous ion and hydrogen) in the solution according to the theory of electrochemistry suggested three pathways in the system (Matheson and Tratnyek, 1994; Scott Orth and Gillham, 1996) (Figure 2-2).
First, Fe0 transfers electrons from its surface to the alkyl halide that is adsorbed on the Fe0 surface and served as the oxidizing agent by reductive dehalogenation (Eq. 2-7) (Matheson and Tratnyek, 1994). Peng et al. (2013) also reported that polybrominated diphenyl ethers were removed by MZVI through adsorption and debromination in a sequential step.
Fe0 + RX + H+→ Fe2+ + RH + X−
(2-7)
Second, the ferrous iron (Fe2+) was a reductant with the ability to reductively dehalogenate alkyl halides (Eq. 2-8). Under an anaerobic condition, Fe0 reacted with water to produce Fe2+ (Eq. 2-9), moreover, when dissolved O2 present, Fe2+ could be also produced (Eq. 2-10). Both reactions caused that the pH increased and the iron
hydroxide (Fe(OH)2) precipitated (Eq. 2-11) (Figure 2-3). Fe(OH)2 was rapidly oxidized to Fe(OH)3, which might form a surface layer on the iron and result in passivation, for this reason, the Eq. 2-8 would be limited.
2Fe2+ + RX + H+→ 2Fe3+ + RH + X− (2-8) Fe0 + 2H2O → Fe2+ + H2 + 2OH− (2-9) Fe0 + O2 + H2O→ 2Fe2+ + 4OH− (2-10) Fe2++ 2OH-→Fe(OH)2 (2-11)
Third, hydrogen involved in the reductive halongenation of alkyl halides which was produced as a product of corrosion with H2O (Eq. 2-12).
H2 + RX→ RH + H+ + X-
(2-12)
In addition to reductive reaction, Fe0 could also drive oxidative reactions in the presence of hydroxyl radicals (HO.) that produced by Fe2+ collide with hydrogen peroxide (H2O2) (Eq. 2-13). Eq. 2-13 has been called as Fenton reaction. (Bremner et al., 2006; Hseh et al., 2005). H2O2 could be generated according to the reduction of O2 occurring on Fe0 surface (Eq. 2-14) (Lv et al., 2016). Hydroxyl radicals were induced by Eq. 2-13. The Fenton reaction was also carried out in Fe0-H2O system.
Fe2+ + H2O2 → Fe3+ + HO.+ HO-
(2-13) Fe0 + O2 + 2H+→ Fe2+ + H2O2 (2-14)
For Fe0-H2O system, the electron transfer on Fe0 surface could precede both reductive
and oxidative reactions.
Figure 2-2 Proposed pathways for reductive dehalogenation in anoxic Fe-H2O system (Matheson and Tratnyek, 1994).
Figure 2-3 The pH-Eh diagram for iron oxides and hydroxides at 25 oC (Stumm and Morgan, 1981).
RCl + H+
RH + Cl- Fe2+
Fe0 e-
Fe2+
Fe3+ RCl + H+
RH+ Cl-
H2O
RH+ Cl-+H+ RCl
Cl-+ H2 e-
e-
Ⅰ
Ⅱ
Ⅲ
catalyst
2.4.2 Nanoscale zero valent iron
In recent years, nano zero-valent iron (NZVI) technology has received lots of attentions and increasingly employed for removing contaminants such as reductive dehalogenation of halogenated organic contaminants (Lv et al., 2016; Fu et al., 2014;
Yan et al., 2013). More and more studies with NZVI have focused on halogenated aliphatic compounds and even persistent halogenated aromatic contaminants. It has been suggested to increase removal efficiency due to its good adsorptive and reactive characteristics with huge specific surface area and high volume ratio (Yan et al., 2010;
Xiu et al., 2010).
2.4.3 Iron-based bimetallic nanoparticles
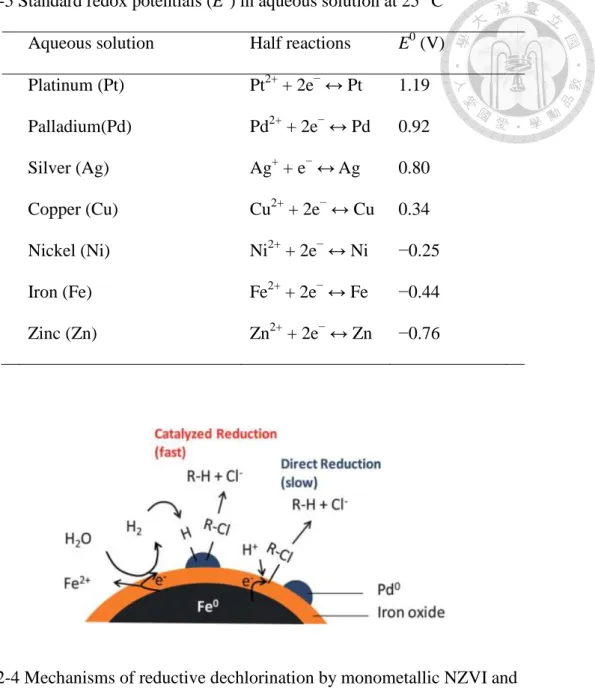
In recent years, many iron-based bimetallic particles have been synthesized and investigated to eliminate environmental contaminants because of the shortcomings of NZVI that decreased reactivity during reaction. For previous studies, NZVI has very slow reaction rates for catalyzing dehalogenation of halogenated compounds (Wang and Zhang, 1997; Zhuang, 2011). In order to improve the dehalogenation efficiency, secondary metal as a catalyst has been incorporated with NZVI to form bimetallic particles (Kim and Carraway, 2000; Zhuang, 2011; Luo, 2011). Secondary metals such as Pt, Pd, Ni, Cu, and Ag have standard electrode potential (E0) more positive than Fe0, which may be reduced by NZVI to form bimetallic nanoparticles (Pt0/Fe0, Pd0/Fe0, Ni0/Fe0, Cu0/Fe0 and Ag0/Fe0) (Table 2-5) (O’Carroll et al., 2013).
The activation energy of the reaction could be lowered when the addition of a second metal, allowing more interactions between the compounds to result in reactions, thus increasing the reaction rate (O’Carroll et al., 2013). Li et al. (2006) reported that second metal can prevent oxidation when the particles are exposed to
air; moreover, it can inhibit the formation of an oxide layer that passivated the reactive sites of NZVI (Lien and Zhang, 2001). The incorporation of the catalytic metal made it have a higher surface area and increase the number of reactive sites on the iron surface (Bokare et al., 2007; Shao-ping et al., 2005). Several reports reported that proton and water could be reduced to atomic and molecular hydrogen at the surface of second metal, and make further hydrogenation of halogenated organic compounds (Bokare et al., 2007; Gui et al. 2000). The introduction of second metal also enhanced the formation of hydride on the surface and acted as the reducing agent for halogenated compounds; thus facilitating the transfer of electrons and atomic hydrogen to the contaminants (Bokare et al., 2007; Lien and Zhang, 2007; Lin, 2012).
The bimetallic nanoparticles could serve as strong electron donors and involve the transfer electrons to the organic contaminants, and then reduce them with a trace amount of second metal as catalyst under anaerobic condition (Joo and Zhao, 2008).
For treatment of halogenated organic contaminants, the dehalogenation has been viewed as rate-determining step. For dehalogenation, the C-H bond formation after the carbon-halogen bond (C-X) was broken, thus, halogen was replaced with hydrogen by the electron transfer from NZVI to secondary metal (Schrick et al., 2002).
Yan et al. (2013) illustrated reaction mechanisms for TCE reduction by nZVI and Pd-nZVI with a prposed model (Figure 2-4). It showed that a synergistic effect between the second metal (e.g. Pd) and Fe, whereby Pd serves as the hydrodehalogenation and hydrogenation catalyst and Fe provides the hydrogen source through water reduction.
Table 2-5 Standard redox potentials (E0) in aqueous solution at 25 °C Aqueous solution Half reactions E0 (V) Platinum (Pt) Pt2+ + 2e− ↔ Pt 1.19 Palladium(Pd) Pd2+ + 2e− ↔ Pd 0.92 Silver (Ag) Ag+ + e− ↔ Ag 0.80 Copper (Cu) Cu2+ + 2e− ↔ Cu 0.34 Nickel (Ni) Ni2+ + 2e− ↔ Ni −0.25 Iron (Fe) Fe2+ + 2e− ↔ Fe −0.44 Zinc (Zn) Zn2+ + 2e− ↔ Zn −0.76
Figure 2-4 Mechanisms of reductive dechlorination by monometallic NZVI and palladium-doped nZVI (Yan et al., 2013).
2.5 The approaches of TBBPA removal
Due to extensive use and potential hazard for human of TBBPA, the development of effective methods to eliminate TBBPA is important. There are many techniques for TBBPA removal, such as photodegradation, biodegradation, and iron-based composite.
2.5.1 Biodegradation
Biodegradation is a well-known method that used to treat halogen organic compounds. Many environmental media contain microorganisms that are capable of dehalogenating compounds like polychlorinated biphenyls, polychlorinated phenols, and benzene, as well as many chlorinated solvents and brominated compounds (Ronen and Abeliovich, 2000; Shih et al., 2012). An et al. (2011) isolated a novel bacterium, Ochrobactrum sp. T, from an e-waste recycling site that was capable of simultaneous debromination and aerobic mineralization of TBBPA. Moreover, the level of oxygen influences the pathway and microorganism species of TBBPA biodegradation (Nyholm et al., 2010). Chang et al. (2012a, 2012b) isolated two kinds of bacteria from Erren river, which can perform aerobic or anaerobic degradation of TBBPA. However, biodegradation spend more time for contaminant removal than chemical degradation though it was eco-friendly and cost-effective.
2.5.2 Photodegradation
Wang et al. (2015) and Zhong et al. (2012) have studied the photolytic degradation of TBBPA degradation and indicated that it can be considered as a promising technique. In the photochemical reaction, reactive oxygen species (ROS) such as singlet oxygen (1O2) or the superoxide anion radical (O2.-
) were responsible for its degradation (Han et al., 2008). Besides, debromination is also a pathway of TBBPA photodegradation (Bao and Niu, 2015). Many composite materials also are used for photocatalytic oxidation of TBBPA, such as Ag/Bi5Nb3O15 (Guo et al., 2011), BiOBr (Xu et al., 2011), and titanomagnetite (Zhong et al., 2012).
Furthermore, Zhong et al. (2012) combined Fenton reaction and photodegradation to
obviously increase the TBBPA degradation.
2.5.3 NZVI and iron-based bimetallic nanoparticles
NZVI and iron-based bimetallic nanoparticles have the powerful ability to remove the halogen organic compounds that mentioned above. And many iron-based nanomaterial composite and modified BNP are studied for increasing the stability and reactivity of nanoparticles with a better efficiency to contaminant remediation (Doong et al., 2015; Lin et al., 2015). For TBBPA, Lin et al. (2012) investigated the debromination of TBBPA by NZVI in methanol/water (50/50) solutions with rate constant of 0.512 ± 0.057 h-1 at pH 7.5 and it shows that methanol/water ratio could influence the debromination of TBBPA. In short, in order to rapid decomposition of TBBPA, Fe-Ag and Fe-Ni bimetallic nanoparticles coupled with microwave energy were carried out (Luo et al., 2012). Luo et al. (2010) demonstrated that the TBBPA removal rate is 0.22 ± 0.02 min-1 with 0.4 g/L Fe–Ag bimetallic particles, Ag content = 1 wt.%, at an initial pH value of 6.0 ± 0.5 and initial temperature of 30 °C and the bottles were placed in ultrasonic wave shaker (40 kHz and 100 W) during the entire reaction period. Both Ag in catalyst and ultrasonication (US) play important roles in the activity of US/Fe–Ag system for TBBPA degradation. Huang et al.
(2013) showed the kinetics of TBBPA and degradation byproduct removal with various pH (pH 4.2-7.2). The best fit kobs values for the disappearance of TBBPA increased from 0.077 ± 0.005 to 2.60 ± 0.03 min-1 for the solution pH from 7.2 decreased to 4.2. Li et al. (2016) also indicated that the reaction of Ni/NZVI with TBBPA was a surface mediated reaction for the different results of EDS and XPS with Fe contents before and after the reaction. Though there are many studies use bimetallic nanoparticle such as Ni/Fe, Pd/Fe and Ag/Fe to treat halogenated organic
contaminants even TBBPA, few reports use Cu as a second metal. Most bimetallic particles with Cu as second metal were not used iron as a based metal, and alumium and zinc are common metals (Huang et al., 2015). Researcher used Cu/Fe bimetallic to treat halogenated organic contaminants such as HCB (Zheng et al., 2009; Zhu et al., 2010) but TBBPA was not a target compound.
2.5.4 Fenton reaction
Fenton reaction is an advanced oxidation process and well studied for treating organic compounds, such as dyes (Moon et al., 2011; Lucas et al., 2006), phenol (Yalfani et al., 2009; Jiang et al., 2010), and halogenated compounds (Chamarro et al., 2001; Xu and Wang, 2011). Fenton’s reagent is a mixture of H2O2 and ferrous iron. Under acidic conditions, it generated hydroxyl radical in the reaction (Neyens and Baeyens., 2003). The overall reaction is:
H2O2 + Fe2+ → Fe3+ + HO− + HO‧
The hydroxyl radical is a strong oxidant that can oxidize many recalcitrant organic compounds rapidly (Zhou et al., 2008). In order to enhance the removal efficiencies of recalcitrant organic compounds, many modified Fenton reactions have been suggested by researchers, such as sono-Fenton (Wang and Shih, 2015), electron- Fenton (Pimental et al., 2008), and photo-Fenton (Lucas and Peres, 2006). Besides, a sequential process with pretreatment by ZVI and then Fenton reaction for dye (Shih and Tso, 2012) was proposed to be an effective method for contaminant removal by using ferrous/ferric ions from the oxidation of ZVI.
Chapter 3 Material and methods
3.1 Chemicals
Ferrous sulfate heptahydrate (FeSO4.7H2O, 99.5-102 %) was purchased from Merck. Sodium borohydride (NaBH4, 95 %) and sodium bicarbonate (NaHCO3, 99.7
%) were obtained from Riedel-deHaen. Copper sulfate pentahydrate (CuSO4.5H2O, 99-102 %), nickel sulfate hexahydrate (NiSO4.6H2O, 99 %), ammonium acetate (CH₃COONH₄, 98%) and 1,10-phenanthroline hydrochloride (C12H8N2.HCl, 98%) were purchased from Sigma-Aldrich. Acetic acid (CH3COOH, 100 %), hydrogen chloride (HCl, 36.5-38.0 %), sodium hydroxide (NaOH, 98.7 %), sodium carbonate (Na2CO3, 98 %), and sodium phosphate (Na2HPO4, 99.1 %) were obtained from J. T.
Baker. All solvents (hexane and methanol) were ultra resi-analyzed grade and purchased from Burdick and Jackson. All aqueous solutions were prepared by using pure water, deionized with Milli-Q water purification system (18.2 MΩ/cm, Mill pore, Bedford, MA, USA).
Tetrabromobisphenol A (TBBPA, 98%) was obtained from Aldrich. Bisphenol A (BPA, 97%) and hydrogen peroxide (H2O2, 35wt. %) were purchased from Acros.
Stoke solutions of TBBPA and BPA were stored at 4°C in the dark, and let them reach to room temperature before use.
3.2 Synthesis of NZVI, Ni/Fe, and Cu/Fe nanoparticles
Nanoscale zero valent iron particles were produced by the modified procedure from Wang and Zhang (1997) with adding 1.6 M NaBH4 aqueous solution dropwise to a flask containing 1.0 M FeSO4‧7H2O aqueous solution at ambient temperature.
Ferrous ion was reduced by borohydrate and zero valent iron particles precipitated instantly according to the following reaction:
Fe(H2O)62+ + 2BH4− → Fe0↓ + 2B(OH)3 + 7H2↑ (3-1)
Nanoscale Bimetallic Cu/Fe particles were prepared by the deposition of desired amount of Cu2+ on NZVI with adding the copper sulfate aqueous solution into synthesized NZVI under a stirring condition according to the following equation:
Cu2+ + Fe(s) → Cu(s) + Fe2+ (3-2)
After that, the Cu/Fe nanoparticles were filtered through a 0.22 μm membrane filter and washed with deoxygenated ultrapure water for several times. Subsequently, the Cu/Fe nanoparticles suspend in aqueous solution. Nanoscale bimetallic Ni/Fe particles were prepared with the same method of Cu/Fe preparation.
To check the effect of oxygen on the Cu/Fe nanoparticle synthesis, the removal reactions of TBBPA were evaluated by using Cu/Fe nanoparticles synthesized in a strictly anaerobic glovebox (Coy Laboratory Products Inc., USA) and in the atmosphere, respectively. To evaluate the oxidation of NZVI by copper (II), the oxidation states of iron before and after Cu ions adding were investigated.
3.3 Characterization of the synthesized Cu/Fe nanoparticles
The surface morphologies and physicochemical properties of the nanoparticles were characterized by field-emission scanning electron microscope with energy-dispersive X-ray spectroscopy (FE-SEM-EDS) and transmission electron
microscope (TEM). The particle size was determined by dynamic light scattering (DLS). The surface area was analysis by using Brunauer-Emmett-Teuller (BET) N2 adsorption method. The crystalline phase of Cu/Fe nanoparticles was identified with X-ray diffraction (XRD). The relative oxidation state of Cu/Fe nanoparticles was analyzed using X-ray absorption near edge structure (XANES).
3.3.1 Field-emission scanning electron microscope, FE-SEM
The SEM imagines of nanoparticles were obtained using JEOL JSM-7600F scanning electron microscope (JEOL, Japan) equipped with an energy dispersive X-ray (EDX) probe for semiquantitative chemical analysis. The accelerating voltage was 30 kV. The nanoparticles were separated from the suspension by vacuum filtration. The solid was filtrated through a 0.22 μm membrane filter and then washed with deoxygenated ultrapure water several times before vacuum freeze-drying.
3.3.2 Transmission electron microscope, TEM
The TEM images of nanoparticles were taken with JEOL JEM-1200EX transmission electron microscope (JEOL, Japan) at 120 kV. A drop of Cu/Fe bimetallic nanoparticles was placed on a Cu-grid to dry. Cu/Fe nanoparticles diluted in ethanol and ultrapure water were sonicated (40 kHz, 280W) for 1 min, respectively, before TEM analysis.
3.3.3 Dynamic light scattering, DLS
In aqueous systems, particle size and particle size distributions were determined by a DLS instrument (Zetasizer Nano ZS, Malvern, MA, USA) at 25 oC and at a measurement angle of 173°. DLS instrument utilizes a laser beam at 633 nm to
determine the size by measuring the particles’ Brownian motion of the sample in particle suspensions with the viscosity of water, 0.08872 poise, and refraction index of 1.330, the refraction index of iron, 2.86, and its adsorption coefficient of 0.1. The Cu/Fe particle suspensions diluted with methanol of same volume and then being sonicated (40 kHz, 280W) for 30 seconds before DLS analysis. DLS measurements were conducted by adding 1 mL of sample into a DLS plastic cell. NZVI suspensions were injected in folded capillary cells, and the electrophoretic mobility was measured using a combination of electrophoresis and laser Doppler velocimetry techniques. The intensity of autocorrelation functions was converted by the CONTIN algorithm to intensity-weighted particle hydrodynamic diameter distributions, assuming the Stokes-Einstein relationship for spherical particles.
3.3.4 Brunauer-Emmett-Teuller surface area
Cu/Fe nanoparticles were pre-dried with vacuum freeze-dryer. Nitrogen Brunauer-Emmett-Teuller adsorption isotherms of Cu/Fe nanoparticles were analyzed with a surface area analyzer (Micromeritics, ASAP-2010/C5-05, USA). The surface area can be determined from the corresponding N2 adsorption/desorption isotherms.
3.3.5 X-ray diffraction, XRD
The crystalline phase of Cu/Fe nanoparticles was identified with X-ray diffraction (XRD). Selected wet samples were analyzed at BL 13A1 beam line at the national synchrotron radiation research center (NSRRC) of Taiwan, using bicron diffractometer with a wavelength of 0.1 Ǻ adjusted with Si (111) monochromator. All samples were prepared and immersed in water in a plastic bag for XRD and the following XANES analysis. The nanoparticles were scanned from 5° to 35° (θ) with
step increments of 0.025° and time per step of two seconds. The radiation wavelength of data from the synchrotron were converted to Cu Kα radiation (λ=1.5418 Å ) and as showed in Figure 4-5, the wavelength have been converted to Cu Kα radiation (λ=1.5418 Å ).
3.3.6 X-ray absorption near edge structure, XANES
The relative oxidation state of Cu/Fe nanoparticles was analyzed using X-ray adsorption near edge structure (XANES). XANES spectra were collected from BL 16A1 and BL 07C1 beamlines at the NSRRC in Taiwan. The BL16A1 beamline was used to determine the oxidation state of iron only. The electron storage ring was operated with energy of 1.5 GeV and current of 300 mA. A Si(111) double-crystal monochromator (DCM) was used to provide highly monochromatized photon beams with energies of 2 to 8 keV and an energy resolution of 1.5×10⁻⁴ ~ 2.1×10⁻⁴ (keV/keV). The BL 07A1 beamline was used to determine the oxidation states of copper. The electron storage ring was also operated the same as above. A Si (111) DCM was also used to provide highly monochromatized photon beams with energies of 5 to 23 keV and an energy resolution of 1.5 ~ 2.5×10⁻⁴ (keV/keV). The data were collected in fluorescence mode with a Lytle ionization detector in the region of the Fe K edge (7115 eV) and Cu K-edge (8979 eV) at room temperature. The K-edge XANES scans for Fe (6912-7512 eV) and Cu (8779-9379 eV) were recorded with step increments of 0.2 eV and 4.0 eV, respectively. The XANES data were then analyzed by Athena version (0.8.058). To keep the samples in a reduction condition, solid particles were prepared in glovebox with ethanol and saved in plastic bags before put in the box that was full of CO2. After squeeze out the solid particles samples on the tapes, and then the samples were analyzed immediately.
3.3.7 Raman spectroscopy
The home-bult confocal Raman microscope is equipped with a monochromator (Shamrock SR 303i-A, Andor Technology, USA), a He-Ne laser (25-LHP-928-249, CVI Melles Griot, USA), a thermos- electric cooling CCD (DU 401-BR-DD-968, Andor, USA) and a microscope (BX51, Olympus, Tokyo, Japan). The sample of Raman spectroscopy were placed on a stainless steel holder and analyzed.
3.4 Batch experiments
The batch removal experiments for TBBPA transformation were conducted under Cu/Fe system in 4 ml amber glass vials capped with Teflon-lined septa under different environmental conditions. The removal was initiated by mixing 15 µ L of a tetrabromobisphenol A stock solution (1000 mg/L) which was prepared by dissolved TBBPA powder in methanol and a certain amount of freshly prepare Cu/Fe nanoparticles suspension as depicted in the following experiments. The total reaction volume was 3 mL and the reactors were shaken continuously at 150 rpm for the duration of experiments at 25 ± 2 °C. Each experiment was carried out triplicate.
Control experiments were carried out identically except for the addition of Cu/Fe nanoparticles suspension.
3.4.1 The effects of Cu content and Cu/Fe dosage on the removal of TBBPA with Cu/Fe nanoparticles
For Cu/Fe nanoparticle system, the batch experiments were performed to investigate the effect of Cu contents (0.5, 2.0, 4.0, 8.0 %) and Cu/Fe dosage (1.0, 2.0, 3.0, 4.0 g/L) on the removal of TBBPA with Cu/Fe nanoparticles. The initial
pH were not further adjusted (about pH 6.8-7.1).
3.4.2 The effect of TBBPA concentration on the removal of TBBPA with Cu/Fe nanoparticles
The effect of initial TBBPA concentrations (1.0, 5.0, 10.0, 15.0 mg/L) on the removal of TBBPA with Cu/Fe nanoparticles was studied by the batch experiments.
The dosage of Cu/Fe was 2.0 g/L containing 4.0 % Cu content, the initial pH value was 6.8 and the temperature was 25 °C.
3.4.3 The effect of initial pH on the removal of TBBPA with Cu/Fe nanoparticles
For Cu/Fe nanoparticles system, the batch experiments to investigate the effects of initial pH of pH 3.0, 5.0, 7.0, 9.0 and 11.0 on the removal of TBBPA by Cu/Fe nanoparticles. Initial solution pH was controlled by hydrochloric acid and sodium hydroxide. Buffers were not used to avoid complications from buffer-metal interactions. The pH values were monitored by pH meter with time. The initial concentration of TBBPA for removal reactions was 5 mg/L, the Cu/Fe dosage was 2.0 g/L containing 4.0 % Cu content for each experiment and the temperature was 25 °C.
The concentrations of TBBPA in the aqueous and solid phases were analyzed as 3.5.1 mentioned.
3.4.4 The effect of initial temperature on the removal of TBBPA with Cu/Fe nanoparticles
The effect of temperature on the removal of TBBPA with Cu/Fe nanoparticles
was conducted under different temperatures. The temperature was controlled in a shaking bath at the desired temperatures of 5, 15, 25, 35, and 45 °C. The initial concentration of TBBPA was 5 mg/L, the Cu/Fe dosage was 2.0 g/L containing Cu content of 4.0 %, and the initial pH value about 6.8.
The Arrhenius equation can be used to determine the activation energy for the reaction.
k = Ae(-Ea/RT) (3-3)
where k (min-1) is the measured rate constants, A (L min-1 m-2) is the frequency factor, Ea (kJ mol-1) is the activation energy for the reaction, R (kJ K-1 mol-1) is the ideal gas constant, and T (K) is the absolute temperature (Laidler, 1984).
3.4.5 Effects of the Fenton process
For H2O2-Fe2+ system, the batch experiments were carried out to study the effect of H2O2 on the removal of TBBPA debrominated byproduct with advanced oxidation.
The efficiency of TBBPA debrominated byproduct removal by the Fenton’s reaction was investigated by evaluating the effects of H2O2 and Fe2+concentration on BPA removal.
The reaction solutions were composed of 5 mg/L BPA and selected H2O2 and Fe2+concentration. The pH was adjusted by adding 0.1 M NaOH or 0.1 M HCl solution. The concentration of BPA and total organic carbon (TOC) were analyzed as mentioned in 3.5.4 and 3.5.7, respectively.
3.5 Analysis methods of TBBPA and its byproducts
3.5.1 TBBPA and BPA stock solutions
TBBPA and BPA solutions were prepared by dissolving a known mass of TBBPA and BPA powder in methanol as the stock solutions and stored at 4 oC.
3.5.2 Extraction method of TBBPA in solid and aqueous phase
At the select time, the samples were conducted to determine the concentration of TBBPA on Cu/Fe surface and aqueous solutions after precipitation of Cu/Fe nanoparticles with magnet. Aliquots in aqueous phase were withdrawn and the concentrations of TBBPA analyzed by a high performance liquid chromatography (HPLC, Agilent, USA). In order to know the concentration of adsorbed TBBPA on Cu/Fe nanoparticles surface, TBBPA was extracted by methanol after adding concentrated HCl which was used to dissolve the adsorbed TBBPA on nanoparticles surface on a vortex orbital mixer (Genie 2, G560) and then analyzed by HPLC. The different extraction methods for adsorbed TBBPA were shown in Fig. S6. (Appendix).
3.5.3 Analytical methods of TBBPA
The TBBPA samples were placed into the autosampler vials and then analyzed by HPLC with a UV detector (Agilent) at 280 nm. A C18 column (Agilent, Eclipse XDB-C18, 250 mm × 4.6 mm) was used. The mobile phase of 80 % methanol (contained 1 % acetic acid) and 20 % Milli-Q water was delivered at a rate of 1 mL/min. Each sample size was 20 μL. The retention time of TBBPA in HPLC was about 6.2 min. Quantification was done with a calibration curve of the tetrabromobisphenol A standard.
3.5.4 Analysis of byproducts
The TBBPA byproducts, including tribromobisphenol A (tri-BBPA), dibromo- bisphenol A (di-BBPA), bromobisphenol A (mono-BBPA), and bisphenol A (BPA), which reacted with Cu/Fe bimetallic nanoparticles were monitored after the reactions.
The concentrations of TBBPA were analyzed via the same HPLC with a UV detector at 280 nm and a C18 column. The mobile phase of 80 % methanol (contained 1 % acetic acid) and 20 % Milli-Q water was delivered at a rate of 0.8 mL/min. Each sample size was 20 μL. The column temperature was 30 oC. The retention times of TBBPA, tri-BBPA, di-BBPA and mono-BBPA on the chromatograms were 10.3, 6.7, 4.4, 3.3 min respectively. Because the mono-BBPA, di-BBPA and tri-BBPA were not commercially available, their concentrations in aqueous phase were determined from the chromatogram peak areas on a mass basis with compensation for the number of bromine based on the standard curves of TBBPA and BPA (Huang et al., 2013; Li et al., 2016).
The concentrations of BPA in the aqueous samples were also analyzed by same HPLC; and the same UV/Vis equipped with same column. The mobile phase was composed of 70 % methanol (contained 1 % acetic acid) and 30 % Milli-Q water at a flow rate of 0.8 mL/min. The sample loop was 20 μL. The retention time of BPA on the chromatograms was about 4.5 min. Quantification was done with a calibration curve of the bisphenol A standard.
These byproducts were collected with separated time and analyzed by high resolution negative-ion electrospray ionization mass spectrometry (HRESI(-)/MS) (Thermo Scientific, QE Plus, USA) in order to identified whether these byproducts were mono-BBPA, di-BBPA, and tri-BBPA.