CHAPTER III METHODOLOGY
This chapter introduced the general design of this study. Moreover, the introduction about the subjects, study site and procedure of student’s science achievement grouping were presented. The third part introduced the instructional units as well as a brief description of instructional activities from two instructional modes, including the inquiry instructional mode and the traditional instructional mode. The fourth part introduced the schedule of data collection as well as the construction of flow map. This study tried to explore the development of knowledge by means of investigation of cognitive structure, metacognitive regulation strategies and information processing strategies. The following part introduced the coding method about cognitive structure, metacognitive regulation strategies and information processing strategies. In additional to the data derived from flow map, the survey of Pupil’s MetaCognitive Scale (PMCS) was administrated. Hence, the construction of PMCS was presented in the sixth part. The last part introduced the data analysis about the aforementioned research questions in chapter one.
III.1.General Research Design
This study tried to investigate the students’ cognitive structure, the application of metacognitive regulation strategies and the usage of information processing strategies in learning science. The interview method was employed to elicit the respondents’
information. All the interview result was transcribed into a graphic display for representing their cognitive structures. Both qualitative and quantitative data derived from flow map were used to answer the research questions proposed in chapter one.
These transcribed flow map outcomes will be used as the database to test the
statistical significance, including role of instruction, role of achievement and effect of
knowledge domains. It also provided the results of correlation from different instructional
modes. Besides, the correlation of three different achiever groups was discussed. Besides,
the interaction between instructional modes and role of achievement was discussed. At
last the effect of knowledge domain was discussed.
As to the flow map outcomes, the Pupil’s Metacognition Scale (PMCS) was constructed for understanding the student’s status of metacognition.
III.2.An Introduction of The Sample Subjects
This section introduced the sample subjects and provided a brief introduction about this school. This study explored the effect of student’s achievement in learning science;
therefore, the achievement grouping criteria was applied to the subjects. Hence, the detailed procedure of achievement grouping was presented in the section.
III.2.1. Subjects
An initial sample of 112 sixth graders (12-13 years old) was selected. There are 2 girls moved to other schools; therefore, the final sample was 110 students. There are 54 boys and 56 girls in this study. These 110 students come from four different classes but at the same school. These pupils were re-assigned to four different classes in the beginning of their 5
thgrade.
Their science teacher was a senior science teacher with more than five years teaching experience. These pupils spent two months to get used to the science teacher. In order to explore the effect of inquiry instruction, these four classes were categorized into two groups, including experimental group and control group.
III.2.2. Introduction of school
This elementary school is located in the urban area of Tou-Cheng Town. Most of the
local residents work at farming. There are four classes in each grade. This school offers a
lot of authentic teaching environment to students, for example, a pond with a lot of plants
and many fishes in it. Moreover, there is a green house in which plant many plants are
raised. These environments offer more opportunities for pupils to observe or hand on
activities. With students’ authentic participation, this field derives many learning
activities, for example, insect observation, birds watching and environmental pollution.
By means of authentic observations, pupils could make connections between these activities and formal instruction concepts.
III.2.3. Science achievement grouping
This study also explored the role of achievement in the development of knowledge.
All students were categorized into three different achiever groups by their previous learning outcomes. We used 3 different student’s academic outcomes to be our grouping criteria, including their semester score and score of traditional standard paper-and-pencil examinations. The semester score came from students’ previous semester science score (the second semester of the 5
thgrade). The semester score was derived from students’
multiple-dimension performance in learning science, including lab work, quizzes, attitude of learning, reports, and group learning. The traditional standard paper-and-pencil examinations contained score of the mid-term examination and final examination in the previous semester. All of the three scores came from previous semester.
First of all, according to the score of students’ academic outcomes, we ranked them from the first place to the 30
thand assigned them a point. For example, the student with highest score in examination was ranked the first place and assigned one point, and the student with the lowest score was ranked the 30
thand assigned 30 points. After ranking all these three different academic outcomes, we added every student’s three assigned points. For example, student got 3 first place and his total assigned points was 1+1+1=3.
In other words, the higher assigned points the lower academic achievement and vice versa. By using the sum of assigned points among these three scores, the pupils were assigned respectively a final score ranging from 3 points to 90 points.
After sorting the final ranking score descending, the first part of 30% sample was categorized into the high achiever group (n=32), and the last part of 30% was categorized into low achieve group (n=34), the rest part of 40% was categorized into middle achiever group (n=44).
This comparison within different achiever groups might help the researcher to
discover the difference from cognitive structures, metacognitive regulation strategies and
information processing strategies.
III.3. Instructional Units and Instructional Activities
This section introduced the instructional units of this study and provided a brief introduction of instructional activities from two different instructional modes.
III.3.1. Instructional units
According to the schedule of science course in the school, the students received three periods of science instruction every week.
According to the National Standards of Elementary Science Education in Taiwan, there were four learning units for 6
thgraders in the first semester including the weather unit, the oxygen and carbon dioxide unit, the sound, and the bicycle. In the second semester, the instructional units contained the heats, the magnets, the rust-proof and decay-proof, and the energy and eco-conservation. In this study, three units were selected for exploration of students’ development of scientific knowledge, including the bicycle, the rust-proof and decay-proof and the energy and eco-conservation. Every unit might come from different knowledge domain. A brief introduction of these aforementioned units was presented in the following table, sorting by their knowledge domain (Table 3.1.).
Table 3.1. The units of the instruction
Unit Knowledge domain
Bicycle Physics
Rust-proof and decay-proof Chemistry
Energy and eco-conservation Earth science & Biology
According to Table 3.1, it reveals that the bicycle unit might come from the physics.
The rust-proof and decay-proof introduced the concepts of chemistry, for example the
process of oxidization and corrosion. The energy and eco-conservation was an integrated
unit, including the biology and the earth science.
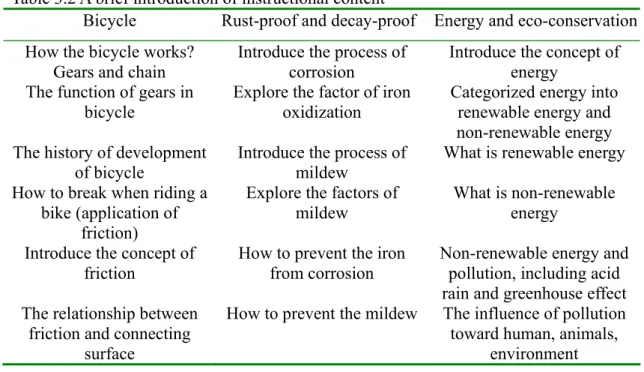
Table 3.2 A brief introduction of instructional content
Bicycle Rust-proof and decay-proof Energy and eco-conservation How the bicycle works?
Gears and chain
Introduce the process of corrosion
Introduce the concept of energy
The function of gears in bicycle
Explore the factor of iron oxidization
Categorized energy into renewable energy and non-renewable energy The history of development
of bicycle
Introduce the process of mildew
What is renewable energy How to break when riding a
bike (application of friction)
Explore the factors of mildew
What is non-renewable energy
Introduce the concept of friction
How to prevent the iron from corrosion
Non-renewable energy and pollution, including acid rain and greenhouse effect The relationship between
friction and connecting surface
How to prevent the mildew The influence of pollution toward human, animals,
environment
Table 3.2 provided a brief introduction of units. It revealed that every unit provided different learning content and every unit was isolated from each other. In other words, every unit was less related to each other. This could reduce the interaction or interference between previous unit and instructing unit during the interviews.
III.3.2. A brief introduction of instructional activities
This study tried to investigate the role of instructional modes in learning science. It provided two different instructional modes, including the inquiry instructional mode and the traditional instructional mode. The control group experienced traditional instruction.
The traditional instruction contained a teacher-center learning environment and cook book teaching strategies. The teaching activities basically followed the textbook. Students only acquired scientific knowledge directly from lecture. In other words, the students were regarded as a receiver of knowledge.
The inquiry instructional mode contained cooperative learning, group discussion and argument activities. The experimental group was a learner-centered environment.
Students were encouraged to construct their own knowledge. For example, with the aid of
internet-based technology, teacher post some questions before formal instruction.
Students’ answers were regarded as their prior knowledge. According to students’
responses, science teacher might challenge students’ alternative conceptions. Besides, students had to complete assigned projects. These projects might offer the opportunities of collaborative learning. By means of collaborative learning, it could facilitate the acquisition of many of the skills, for example, the data collection, evaluating and interpretation of gathered information and discussion. This study explored the effect of different instructional modes, including traditional instructional mode and inquiry instructional mode. According to the aforementioned introduction of different instructional modes, the inquiry instructional mode did not ask students to do these activities. In other words, students had to construct their knowledge voluntarily. For example, students could choose to answer the questions which were proposed by science teacher. Or students could answer the questions proposed in class voluntarily. On the other hand, if the students did not want to response these proposed questions; they could reject to answer these questions. In sum, the inquiry instructional mode did not provide detailed instruction of construction of knowledge.
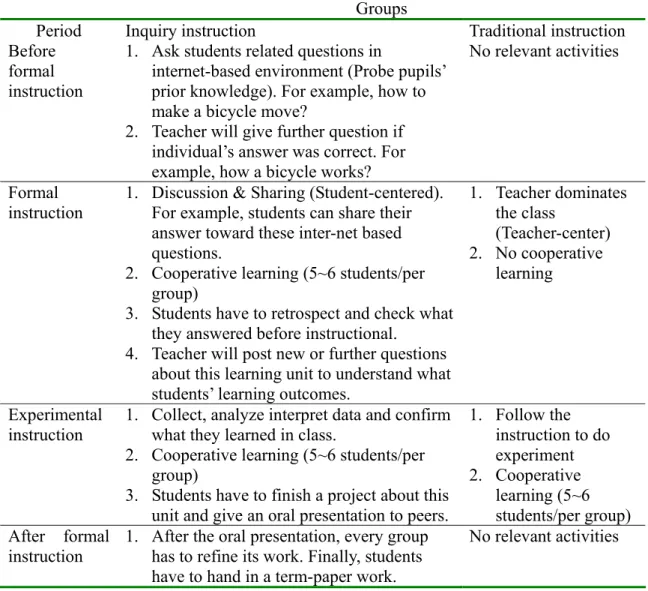
Table 3.3 shows a brief introduction about these two different instructional modes
in learning bicycle.
Table 3.3. A brief introduction of different instructional strategies in learning bicycle
Groups
Period Inquiry instruction Traditional instruction
Before formal instruction
1. Ask students related questions in
internet-based environment (Probe pupils’
prior knowledge). For example, how to make a bicycle move?
2. Teacher will give further question if individual’s answer was correct. For example, how a bicycle works?
No relevant activities
Formal instruction
1. Discussion & Sharing (Student-centered).
For example, students can share their answer toward these inter-net based questions.
2. Cooperative learning (5~6 students/per group)
3. Students have to retrospect and check what they answered before instructional.
4. Teacher will post new or further questions about this learning unit to understand what students’ learning outcomes.
1. Teacher dominates the class
(Teacher-center) 2. No cooperative
learning
Experimental instruction
1. Collect, analyze interpret data and confirm what they learned in class.
2. Cooperative learning (5~6 students/per group)
3. Students have to finish a project about this unit and give an oral presentation to peers.
1. Follow the instruction to do experiment 2. Cooperative
learning (5~6 students/per group) After formal
instruction
1. After the oral presentation, every group has to refine its work. Finally, students have to hand in a term-paper work.
No relevant activities
According to Table 3.3., students were encouraged to express what they thoughts and learned in class. Besides, they need to share and evaluate the information in class.
Moreover, they had to make conclusion and present his/her points of view in the oral presentation. In the inquiry instructional modes, the students were regarded as constructors of knowledge.
III.4. Data Collection
III.4.1. Schedule of data collection
For obtaining students’ cognitive structures, this study employs interview to elicit
46
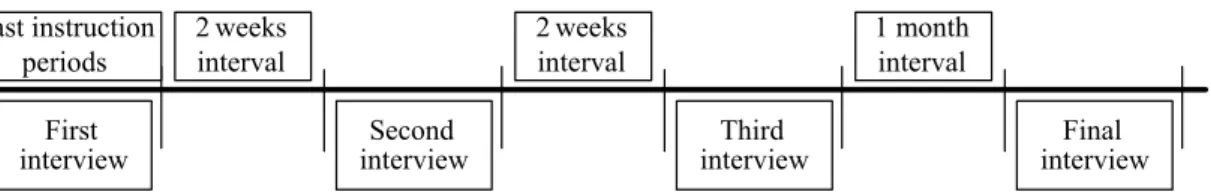
students’ concepts. The data collection sessions were conducted individually and were tape recorded for later coding and analysis. The first interview will be held after last instruction period immediately. After the first interview, the rest interviews will be conducted consequently. The second and third interviews were held every two weeks after the last instruction. The final interview will be taken place two months later after the last instruction period. In sum, there are four times of interviews will be held and they will be completed on 8 weeks after the last instruction. These interviews will try to investigate the possible information that pupils may learn after a long period of time when the instruction came to an end. Figure 3.1 shows the schedule of data gathering (interview) and the available variables in detail.
First interview
2weeks interval
Second interview
2weeks interval
Third interview
1 month interval
Final interview Last instruction
periods
Figure 3.1: A sample of schedule of data gathering of unit Bicycle
In addition to the interview data, this study also administrated the questionnaire
1to document pupil contemporary state of metacognition. The sample students have to
complete this questionnaire four times. Before the formal instruction, students
administrated the pre-test to obtain the original status of metacognition. In the middle of experimental period, the middle test was conducted. At the end of this study, the post-test (I) was conducted. Two months later, the students had to complete the post-test (II).
The data collection contained three different resources, including interview data, PMCS questionnaire. Providing a concise instruction about the whole process of data collection was necessary. The Figure 3.2 displayed the whole sequence of data collection including the order of instruction, interview schedule, schedule of PMCS administration.
A letter was given to represent different interviews. Letter A was regarded as the first interview, letter B was regarded as the second interview, letter C was regarded as the third interview, and letter D was regarded as the fourth interview. The pre-test of PMCS was
1 The following section (III.6) provided detailed description about this questionnaire.
administrated before the formal instruction of the bicycle unit. The middle test of PMCS was administrated between the interval of bicycle unit and rust-proof and decay-proof unit. The post-test (I) was administrated between the interval of rust-proof and
decay-proof unit and energy and eco-conservation unit. The post-test (II) was
administrated at the end of unit of energy and eco-conservation unit. Because the middle test and post-test (I) were administrated between the two instructional units, therefore, the results could be regards the post-test of previous unit, and the pre-test of coming unit. For example, the result of middle test could be the post-test (PMCS) of bicycle unit. Besides the result could be regarded as the result of pre-test (PMCS) of rust-proof and
decay-proof unit. These results provided the data for understanding students’ status of metacognition in each unit.
Formal instruction Bicycle unit
1 week interval
1 week interval
1 week interval
1 week interval
1 week interval
1 week interval
1 week interval
1 week interval
A B C D
Formal instruction Rust-proof and decay-proof
unit
1 week interval
1 week interval
1 week interval
1 week interval
1 week interval
1 week interval
1 week interval
1 week interval
A B C D
Formal instruction Energy and eco-conservation
unit
1 week interval
1 week interval
1 week interval
1 week interval
1 week interval
1 week interval
1 week interval
1 week interval
A B C D
PMCS Pre-test
PMCS Middle test
PMCS Post-test (I)
PMCS Post-test (II) : Interview : PMCS administration
A : First interview B : Second interview C : Third interview D : Fourth interview
Legend
Time
Figure 3.2: The schedule of data collection
III.4.2. Procedure of interview
Interviews were used to obtain a record of student narratives. The record of
interview was transcribed into graphic display by means of flow map technique. These
graphic displays were regarded as evidence of the student’s cognitive structures. Since
this part of the interview needs to be conducted in a non-directive way to help the student
to express what he or she known with minimum bias by the interviewer, the interview
48
questions were kept as simple as possible. To that end, the following questions were posed:
1. Please tell me what are the main ideas or ways of biological reproduction.
2. Could you tell me more about the ideas you have mentioned?
3. Could you tell me the relationships among the ideas you have already told me?
In this paper, all sample students finished four times of interviews in very unit. The students have to complete three different units, including bicycle, rust proof and decay proof, and energy and eco-conservation. In total, all of students had to finish 12 times of interviews. Each interview obtained 110 respondents’ narratives and then being diagramed into graphic displays of cognitive structure outcomes by a flow map method.
III.4.3. Date reduction: Construction of Flow map
The responses to these questions were tape-recorded, and then transcribed into the format of a flow map (Anderson & Demetrius, 1993; Bischoff & Anderson, 2001;
Bischoff & Anderson, 1998; Tsai, 1996, 1998; Tsai & Huang, 2001). According to the
extent of respondents’ narratives of elicitation, researcher entered these utterances into
flow map in sequence and linked by a connecting arrow. For example, John’s
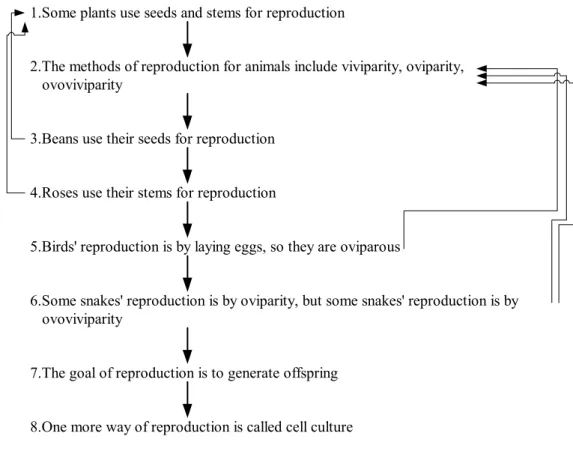
(pseudonym) flow map outcomes in the third interview, shown in Figure 3.3, began with
an introductory major statement that “Plants can not only use seed to reproduce but also
use part of their own body, for example, stem, root.” Then this statement was followed by
statement about animals’ methods of reproduction, function of reproduction. According to
the record of narratives, all of the utterances were entered sequentially and were assigned
a number consecutively in the flow map outcomes. Ordinal and consecutive number will
put on the left side of each concept according to narrative sequence. The last statement
shown on Figure 3.3 was added by the student within the processing of meta-listening.
1.Some plants use seeds and stems for reproduction
2.The methods of reproduction for animals include viviparity, oviparity, ovoviviparity
3.Beans use their seeds for reproduction 4.Roses use their stems for reproduction
5.Birds' reproduction is by laying eggs, so they are oviparous
6.Some snakes' reproduction is by oviparity, but some snakes' reproduction is by ovoviviparity
7.The goal of reproduction is to generate offspring 8.One more way of reproduction is called cell culture
Figure 3.3: A student’s (called John, pseudonym) flow map about biological reproduction (obtained from the third interview)
In addition to these sequential and ordinal linear linkages shown in flow map outcomes, if the respondents' narratives mention concepts relating with previous concepts, then a recurrent was drawn back to the previous one and these multi-relational patterns shown by linking new ideas to earlier ones recorded by inserting recurrent arrow. For example, the 6
thstatement was “Some snakes’ reproduction is by oviparity, but some snakes’ reproduction is by ovoviviparity”, basically included three relational ideas:
oviparity and ovoviviparity; therefore, two recurrent arrows should be drawn back to
previous mentioned idea for the statement; two recurrent linkages are drawn back to
statement 2 (ovoviviparity and oviparity). Once the narrative concept concerns with many
previous concepts and we still have to draw their cross-linkage as many as possible. For
detailed information about the flow map method, see Anderson & Demetrius, 1993; Tsai,
1998a, 2000a, 2001a.
50
The reliability of flow map diagramming was determined by asking a second independent researcher to diagram a subset of the student interview narratives. The inter-coder agreement for sequential statements (i.e., linear linkages) was 0.89 and for recurrent linkages was 0.83. Based on this evidence, this method was deemed to be sufficiently reliable for the purposes of this research study. In general, reliabilities are greater than 0.80 are considered sufficient for narrative analyses. This is close to the reliabilities reported in the original and following research of flow map by Anderson and Demetrius (1993) and Tsai (1998a).
III.5. Indicators of Flow Map
This study investigated the development of knowledge from cognitive structure, information processing strategies and metacognitive regulation strategies. This section introduced the indicators of flow map as well as the definition of the indicators.
III.5.1. Indicators of the cognitive structures
A flow map representation has the merit of exhibiting both the sequential pattern of recall and also evidence of an underlying interconnected texture of ideas in cognitive structures. The flow maps provided researchers with information about the extent and richness of an individual’s cognitive structures, or organizational schemata as represented by the evidence of connected knowledge contained in the flow map data (e.g., Bischoff and Anderson, 2001). The following two indicators for representing knowledge construction are obtained from the flow map data.
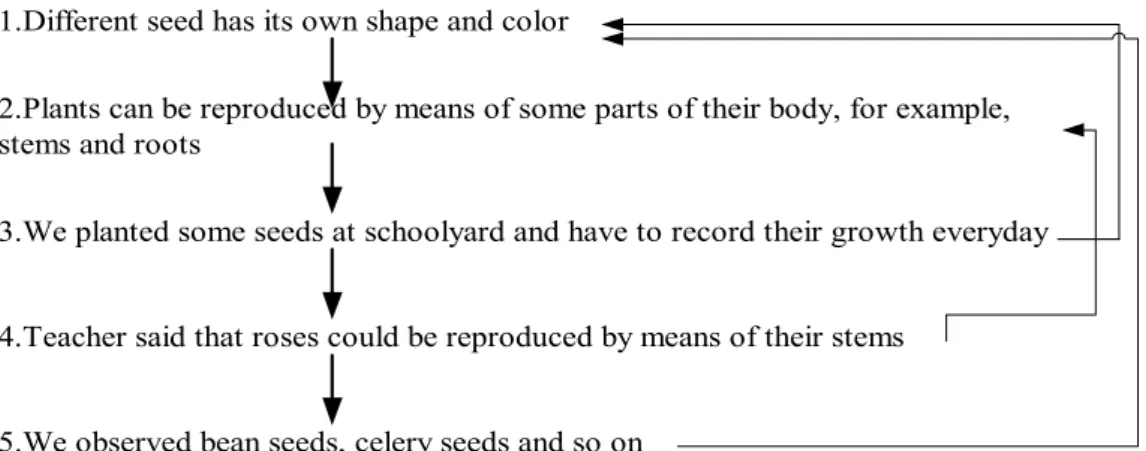
Extent: number of linear linkages as shown in the flow map, an indicator of the extent of recalled knowledge, e.g., 5 in Figure 3.4.
Richness: number of revisited and linked ideas indicated by recurrent linkages shown in the flow map, an indicator of the richness of knowledge networks within a student’s cognitive structure, e.g., 3 in Figure 3.4.
There are four times of interview in every unit study. The first interviews were
conducted at the end of instruction immediately. The second and the third interviews were conducted every two weeks after the first interview. The fourth (final) interview was held two months later after the first one. In other word, the duration between the third and the fourth interview is one month. Figure 3.3 is a student’s flow map obtained from the third interview. The same student’s flow map obtained from first, second and final interview is shown in Figure 3.4, Figure 3.5 and Figure 3.6, respectively.
1.Different seed has its own shape and color
2.Plants can be reproduced by means of some parts of their body, for example, stems and roots
3.We planted some seeds at schoolyard and have to record their growth everyday
4.Teacher said that roses could be reproduced by means of their stems
5.We observed bean seeds, celery seeds and so on
Figure 3.4: John’s (pseudonym) flow map obtained from the first interview
1.We inserted a section of rose stem into schoolyard and see its growth
2. Teacher said that orchid could be reproduced by means of cell culture
3. We can use sweet potato or potato roots for reproduction and then generate its offspring
4. Plants can use different methods for reproduction, for example, bean seeds, rose stems and potato roots
5.The goal of reproduction is to generate offspring 6.Moss can use spore for reproduction
Figure 3.5: John’s (pseudonym) flow map obtained from the second interview
52
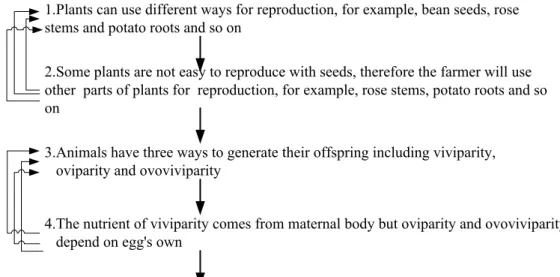
1.Plants can use different ways for reproduction, for example, bean seeds, rose stems and potato roots and so on
2.Some plants are not easy to reproduce with seeds, therefore the farmer will use other parts of plants for reproduction, for example, rose stems, potato roots and so on
3.Animals have three ways to generate their offspring including viviparity, oviparity and ovoviviparity
4.The nutrient of viviparity comes from maternal body but oviparity and ovoviviparity depend on egg's own
5.The main goal of reproduction is to generate offspring
Figure 3.6: John’s (pseudonym) flow map obtained from the fourth interview
III.5.2. Indicators of the information processing strategies
According to the student’s narrative in the flow maps, this study also used content analysis methods to examine students’ cognitive operations or information processing strategies. Each of the student’s ideas shown in the flow maps was categorized into the following five indicators of information processing strategies.
Defining: Providing a definition of a concept or a scientific term, e.g., Oviparity indicates animals that lay eggs and hatch outside the mother’s body.
Describing: Depicting a phenomenon or a fact, e.g., Some snakes’ reproduction is by oviparity, but some snakes’ reproduction is by ovoviviparity.
Comparing: Describing the relationships between (or among) subjects, things or methods, e.g., Comparing to other methods of reproduction, the oviparity could generate more offspring at one time.
Conditional Inferring: A description about what will be happened under certain
conditions, e.g., If the pollen deposits onto a pistil, it may generate seeds.
Explaining: Presenting an account to justify the causality of two facts or events, e.g., Since the oviparity lacks parental care, it needs a large amount of eggs to increase the survival rate.
This categorization scheme was the same as that used in Tsai (1999a, 2001a). The purpose of the information processing analyses was to acquire a deeper understanding about a student’s reasoning when (re)constructing science knowledge in the flow map interview task. A total count of the coded statements occurring in each of the categories was obtained by examining the statements in the flow map narrative. Students who evidenced higher frequencies of using higher-order modes of information processing (e.g., explaining) were viewed as those having better strategies in organizing information during recall. Previous study showed an inter-coder reliability of 0.88 was obtained for the content analysis (Tsai & Huang, 2001). After the reliability analysis was completed, those statements that lacked inter-coder agreement were finalized by consensus of the two coders so the content analysis could be completed. In this study, the inter-coder reliability about information processing coding was close to 0.85.
III.5.3. Indicators of metacognitive regulation strategies
According to Shimamura (2000), the metacognitive regulation strategies can be regarded as processes of selection, activation, manipulation of information in working memory. Therefore, Shimamura (2000) defined four indicators of metacognitive regulation, including selecting, maintaining, updating and rerouting (p.316). These four indicators can be arranged by level of complexity. These indicators were employed on the analysis of flow map outcomes.
Because the maintaining strategy depended on individual memory, including
short-term memory and long-term memory, the maintaining strategy was divided into
short-term maintaining and long-term maintaining. The short-term maintaining strategy
was related to short-term memory. The long-term maintaining strategy was related to the
long-term memory. Since the short-term maintaining strategy could be observed during
interview. As to the long-term maintaining strategy, it was observed within two
54
successive interview outcomes
Selecting: The first indicator, selecting, involves the focus of attention to specific sensory or memory features. In any interview, researcher represented a picture to students for enhancing their information retrieve from memory. The presented picture enabled students to sense and consequently, to filer any possible information in long-term memory and reconstruct in working memory. In other words, students could select what the most important information and utter. Selecting could be the basic function of metacognitive regulation. For example, in Figure 3.7, transcribed from the interview of last instruction about solar system. Mary (pseudonym) constructed what she learned during this unit learning.
When interviewed Mary, according to the interview questions, the relevant information might retrieve from long-term memory and by means of selection in working memory consequently derived five statements. Perhaps, for Mary, these five statements might be the most important information in this instruction. In sum, Mary might use the strategy of selecting 5 times in this interview.
Short-term Maintaining: This indicator referred to the ability to keep active information in working memory (short-term memory). Figure 3.7 showed that Mary (pseudonym) flow map outcomes from first interview. In the first interview, it contained five statements. In the first statement, she mentioned the concept “The solar system is composed of sun and nine planets”. In the fourth statement, she recalled the concept “The components of solar system, including sun, planets, satellites, comets and shooting stars”.
Comparing these two statements, Mary mentioned the key concept “solar system” in both
of statements. In other words, she used the short-term maintaining strategy once in this
interview.
1.The solar system is composed of the sun and its nine planets
2. The Earth contains the geosphere, hydrosphere and atmosphere that keep the Earth alive by means of their interaction.
3. It will be very cold when planet is far from sun and vice versa
4. The components of solar system, includes sun, planets, satellites, comet and shooting stars.
5. The moon is the satellite of the Earth
Figure 3.7: Mary (pseudonym) flow map outcomes from the first interview
Long-term Maintaining: This indicator refers to the ability to keep active information in long-term memory. Figure 3.8 showed that Mary (pseudonym) flow map outcomes from the second interview. In this flow map outcomes, it contained four statements. Comparing these two flow map outcomes, it revealed that the statement “The structure of Earth, including the geosphere, hydrosphere and atmosphere” had appeared on these 2 interviews. The frequency of using the long-term maintaining strategy was one.
Comparing two successive flow maps outcomes not only provided the observation
of using long-term maintaining strategy, it also provided an insight of higher-rank
metacognitive regulation strategy, the application of updating strategy.
56
1. Every planet has its own characteristics includes surface temperature, diagram, color and so on.
2. Every galaxy has its own planets, for example, the solar system contains nine planets, Earth, Venus, Mars, and so on. Additionally, some plants have satellites, for example, moon is the satellite of the Earth
3. The structure of Earth includes the geosphere, hydrosphere and atmosphere
4. The Earth is so unique and suitable for living in solar system, we need to pay more endeavor to protect her
Figure 3.8: Mary (pseudonym) flow map outcomes from the second interview
Updating: When information in working memory requires change in activation, the metacognitive regulation employed updating. Updating is important on memory retrieval tasks (Shimamura, 2000). In Figure 3.7, the 4
thand 5
thstatements are “The components of solar system, including sun, planets, satellites, comet and shooting stars. The components of solar system, including sun, planets, satellites, comet and shooting stars”
and ” The moon is the satellite of the Earth.” In the figure, Mary combined these 2 statements into one statement “Every galaxy has its own planets, for example, the solar system contains nine planets, Earth, Venus, Mars. Additionally, some plants have satellites, for example, moon is the satellite of the Earth.” This process of integration could be regard as updating strategies.
Rerouting: Rerouting refers to the ability to switch from one cognitive process or
response set to another. In the Figure 3.8, Mary uttered the statement “The Earth is so
unique and suitable for living in solar system, we need to pay more endeavor to protect
her” that was a processing of set or task switching. It means that Mary might understand
what did the Earth so suitable for creatures and awareness the importance of protecting
the Earth. In sum, she tried to reconstruct her own knowledge across different units learning for example, solar system, pollution, ecology.
As to the inter-coder reliability, this study will ask for second researcher coding 50 flow maps by the means of aforementioned coding criteria. Comparing the agreement between two different researchers and generate the coefficient of inter-coder reliability.
The inter-coder agreement was 0.81. The reliability was considered sufficient for narrative analyses.
III.6. Construction of Pupil’s Metacognition Scale (PMCS)
In order to investigate students’ metacognition, this study tried to use two sources to assess students’ metacognition, including the pupils’ metacognition scale (PMCS) and content analysis of metacognitive regulation strategies. By means of the PMCS, it could provide a convenient device for understanding students’ status of metacognition.
III.6.1. Subscales of PMCS
To develop Pupils’ Metacognition Scale (PMCS), a pool of items was collected. As previously discussed, this study adopted two dimensions (or subscales) to assess early adolescents’ views about the metacognition, that is, the knowledge of cognition, and the regulation of cognition. The subscale “knowledge of cognition” assesses students’
knowledge about the metacognition. The subscale of “regulation of cognition” explores students’ self-regulatory skill that exert on his/her learning processes and knowledge construction. Based upon the research work (Sperling et al., 2002) and by consulting with some experts in science education, there were finally 18 items in this questionnaire. Each subscale contained 9 items respectively. All of the items were presented in Chinese language. The following two statements are sample items for the subscales respectively, cited directly from the questionnaire.
1. I can motivate myself to learn when I need to. (knowledge of cognition)
2. I ask myself if I learned as much as I could have once I finished a task.
(regulation of cognition)
58
This questionnaire consisted of bipolar agree-disagree statements on a 5-1 Likert scale. Students who attained high scores on the subscale knowledge of cognition might imply them know how to motivate their learning processes, for example, “I can learn more when I am interested on this topic.” Students have high scores on the subscale of regulation of cognition tended to reveal that they might have exerted related and useful strategies on their learning processes, for example, “I try to set specific goals before a task”, or “I try to ask myself if I have considered all options when solving a problem.”
This study was conducted in I-Lan county, the northeast of Taiwan. All of sample students came from the same school and same grade. The initial number of sampled was 193, and all the early adolescents (6
thgraders) in the schools were asked to fill PMCS.
After excluding some unfinished questionnaires and uncertain responses (about 6 respondents), the valid questionnaires for statistical analysis are 187, including 93 boys (49.7%) and 94 girls (50.3%).
III.6.2. Results of PMCS
An exploratory factor analysis was applied to clarify the structure of item factors.
This study used principle component analysis with varimax rotation to reveal the structure of PMCS. By the factor analysis, two factors, as expected, were revealed in PMCS. A questionnaire item was retained only when it loaded greater than 0.50 on the relevant factor, and less than 0.50 on non-relevant factor. As a result, the initial 18 items were reduced to 10 items
2.
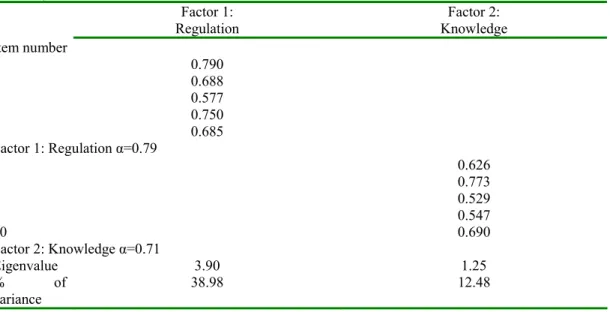
Table 3.4 revealed that the eigenvalues of the two factors (knowledge of cognition and regulation of cognition) from the principle component analysis were all larger than one: 3.90 and 1.25. These two factors (subscales) on this scale accounted for 51.45% of the variance. The internal reliability, alpha coefficient, was acceptable for these two subscales, which is 079, and 0.71 respectively for these two subscales and total questionnaire is 0.822 (Table 3.2).
2 Refer to Appendix A.
Table 3.4. Rotated factor loadings and Cronbach’s α value for the two factors of PMCS (n=187)
Factor 1:
Regulation
Factor 2:
Knowledge Item number
1 0.790 2 0.688 3 0.577 4 0.750 5 0.685 Factor 1: Regulation α=0.79
6 0.626
7 0.773
8 0.529
9 0.547
10 0.690
Factor 2: Knowledge α=0.71
Eigenvalue 3.90 1.25
% of variance
38.98 12.48
total variance of explained is 51.45%.
Total reliability α=0.822 III.6.3. Survey of PMCS
In this study, all of sample students have to administrate PMCS four times. The first time survey was pre-test. The pre-test took place before formal instruction of this study.
The middle test administrated during the instructional period. The post-test (I) took place at the end of last instructional period in the energy and eco-conservation. The post-test (II) administrated two months later after the post-test (I).
III.7. Data Analysis
The study tried to explore the process of development of scientific knowledge. The descriptive data were presented. In order to exploring the correlation analysis within the indicators, the correlation analysis was conducted.
As to the exploration of role of instruction, two different instructional modes were
used in this study. Moreover, the independent t-test analysis was employed for further
analysis about role of instruction.
60
Additionally, the investigation of role of achievement was discussed. All subjects were categorized into three different achiever groups, including the high achiever group, the middle achiever group and the low achiever groups. The one-way analysis of variance (one-way ANOVA) was conducted in exploration the role of achievement. Besides, the post-hoc test was also used in the investigation of cognitive structure, metacognitive regulation strategies and information processing strategies from three different achiever groups.
As to the interaction between achievement and instruction, the two-way analysis of variable (two-way ANOVA) was conducted.
The exploration of the effect of knowledge domain was discussed by the repeated measures statistical method. It provided a detailed discussion about the effect of knowledge domain. Besides, the interaction between knowledge domain and other variables was presented at the same section.
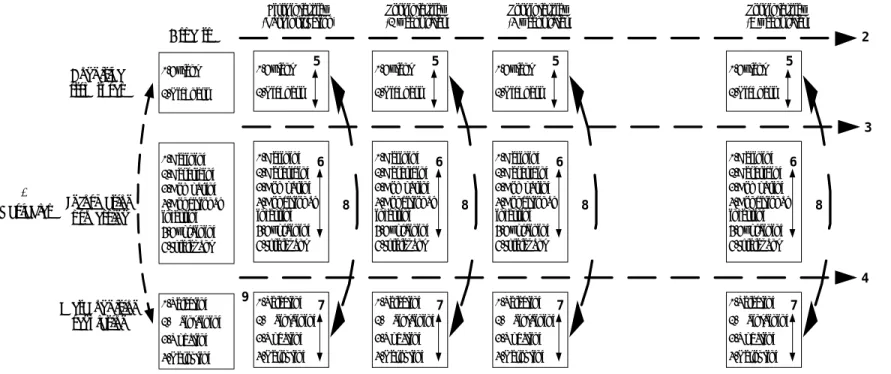
In Figure 3.9, the relevant descriptive data and investigation the role of student’s academic achievement was discussed. Besides, the relationships between students’ PMCS and metacognitive regulation strategy were presented. Moreover the relationship within the indicators was discussed. In other words, it provided an overall introduction about the outcomes of learning, including cognitive structure, metacognitive regulation strategies, information processing strategies and PMCS. In addition to overall introduction about the subjects’ development of knowledge, the discussion about the role of achievement was presented.
In Figure 3.10, it will investigate the effect of two different instructional modes, including the inquiry instructional mode and the traditional instructional mode. The comparison between the experimental group and the control group was conducted.
Besides, the relationships within all indicators were discussed from two different groups.
In addition to exploration of role of instruction and role of achievement respectively,
this study also investigated the interaction between achievement and instruction. To end
that, a two-way ANOVA analysis was employed.
Finally, this study also investigated the role of knowledge domains
3. The repeated measures method was conducted for further discussion. The discussion about the role of knowledge domains was presented in Figure 3.11.
3 Refer to III.3.1Instructional units
Post interview (2 weeks later)
Cognitive structures
Information processing Variables
Legend
1. Flow map outcomes, including cognitive structures, information processing, and metacognition regulation application (Descriptive analysis) 2. The development of indicators of cognitive structures in very interview (Descriptive & correlational analysis)
3. The development of indicators of information processing in very interview (Descriptive & correlational analysis) 4. The development of indicators metacognition regulation in very interview (Descriptive & correlational analysis)
5. Comparing the role of academic achievement in cognitive structures in very interview (Correlational & one-way ANOVA analysis) 6. Comparing the role of academic achievement in information processing in very interview (Correlational & one-way ANOVA analysis) 7. Comparing the role of academic achievement in metacognitive regulatoin in very interview (Correlational & one-way ANOVA analysis) 8. Exploring the relationships among indicators during interviews (Correlational analysis)
9. Exploring the development and relationships between Pupils' Metacognition Scale (PMCS) and metacognition regulation (Descriptive and correlational analysis & t-test analysis) 1
Post interview (4 weeks later)
Post interview (8 weeks later) First interview
(Last instruction)
2
1.Defining 2.Describing 3.Comparing 4.Conditional inferring 5.Explaining 6.Irrelevant
3 1.Extent
2.Richness
Metacognition regulation
1.Selecting 2.Maintaining 3.Updating 4.Rerouting
4 Aspects
9
8
1.Selecting 2.Maintaining 3.Updating 4.Rerouting
7 1.Defining 2.Describing 3.Comparing 4.Conditional inferring 5.Explaining 6.Irrelevant
6 1.Extent 2.Richness
5
8
1.Selecting 2.Maintaining 3.Updating 4.Rerouting
7 1.Defining 2.Describing 3.Comparing 4.Conditional inferring 5.Explaining 6.Irrelevant
6 1.Extent 2.Richness
5
8
1.Selecting 2.Maintaining 3.Updating 4.Rerouting
7 1.Defining 2.Describing 3.Comparing 4.Conditional inferring 5.Explaining 6.Irrelevant
6 1.Extent 2.Richness
5
8
1.Selecting 2.Maintaining 3.Updating 4.Rerouting
7 1.Defining 2.Describing 3.Comparing 4.Conditional inferring 5.Explaining 6.Irrelevant
6 1.Extent 2.Richness
5
Figure 3.9: Framework of basic data analysis
Experimental Group (Inquiry instruction)
Control Group (Traditional instruction)
1
1
Legend
1. Two groups of students' flow map outcomes, including cognitive structures, information processing, and metacognition regulation application (Descriptive analysis) 2. Correlational analysis of two groups of students' cognitive structures, information processing, and metacognitive regulatoin in very interview (Correlational analysis) 3. Comparing the indicators of students' cognitive structures from two groups of student in very interview (Descriptive & correlational analysis & t-test analysis) 4. Comparing the indicators of students' information processing from two groups of student in very interview (Descriptive & correlational analysis & t-test analysis) 5. Comparing the indicators of students' metacognitive regulation from two groups of student in very interview (Descriptive & correlational analysis & t-test analysis)
6. Comparing two groups of students' Pupils' Metacognition Scale (PMCS) outcomes, relationship between PMCS and metacognition regulation (Descriptive and correlational analysis & t-test analysis) First interview
(Last instruction) Second interview
(2 weeks later) Third interview
(4 weeks later) Fourth interview
(8 weeks later)
Information processing 1.Defining 2.Describing 3.Comparing 4.Conditional inferring 5.Explaining 6.Irrelevant Cognitive
structures
1.Extent 2.Richness
Metacognitive regulatoin
1.Selecting 2.Maintaining
3.Updating 4.Rerouting
Information processing 1.Defining 2.Describing 3.Comparing 4.Conditional inferring 5.Explaining 6.Irrelevant Cognitive
structures
1.Extent 2.Richness
Metacognitive regulatoin
1.Selecting 2.Maintaining
3.Updating 4.Rerouting
2
2
5
3 4
Information processing 1.Defining 2.Describing 3.Comparing 4.Conditional inferring 5.Explaining
6.Irrelevant Cognitive
structures
1.Extent 2.Richness
Metacognitive regulatoin
1.Selecting 2.Maintaining
3.Updating 4.Rerouting
Information processing 1.Defining 2.Describing 3.Comparing 4.Conditional inferring 5.Explaining
6.Irrelevant Cognitive
structures
1.Extent 2.Richness
Metacognitive regulatoin
1.Selecting 2.Maintaining
3.Updating 4.Rerouting
2
2
5
3 4
6
Figure 3.10: Framework of data analysis from experimental/control groups
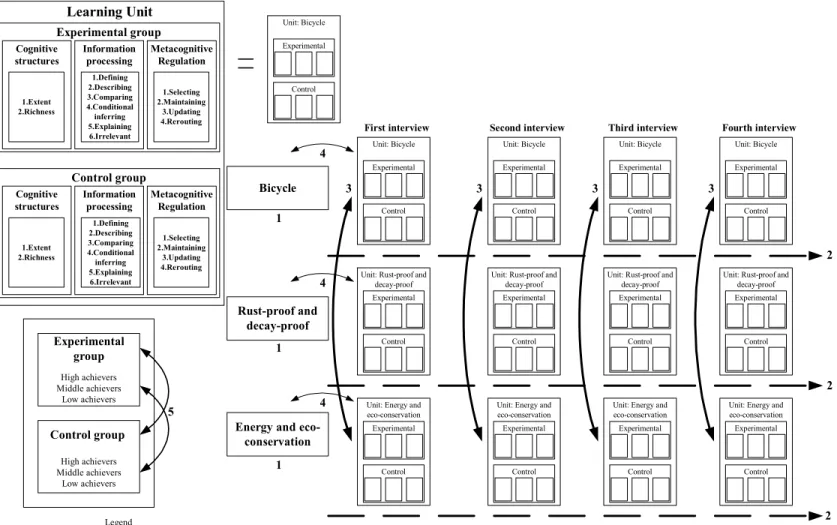
Legend
1. Students' flow map outcomes from three different units, including the bicycle unit, rust-proof and decay-proof unit and the energy and eco-conservation unit (Descriptive analysis) 2. The development of students' cognitive structures, information processing, and metacognitive regulatoin from three different units (Descriptive analysis)
3. Exporation of effect of knowledge domain (Repeated measures analysis)
4. Exploring the interaction between achievement, instructional modes and the role of knowledge domain (Repeated measures analysis) 5.The interaction between instruction and achievement (two-way ANOVA)
First interview
3
Unit: Rust-proof and decay-proof Experimental
Control Unit: Bicycle Experimental
Control
Unit: Energy and eco-conservation Experimental
Control
Second interview
3
Unit: Rust-proof and decay-proof Experimental
Control Unit: Bicycle Experimental
Control
Unit: Energy and eco-conservation Experimental
Control
Third interview
3
Unit: Rust-proof and decay-proof Experimental
Control Unit: Bicycle Experimental
Control
Unit: Energy and eco-conservation Experimental
Control
Fourth interview
3
Unit: Rust-proof and decay-proof Experimental
Control Unit: Bicycle Experimental
Control
Unit: Energy and eco-conservation Experimental
Control
2
2
2 Energy and eco-
conservation 1 Rust-proof and
decay-proof 1 Bicycle
1 Learning Unit
Experimental group Information
processing 1.Defining 2.Describing 3.Comparing 4.Conditional inferring 5.Explaining 6.Irrelevant
Metacognitive Regulation
1.Selecting 2.Maintaining
3.Updating 4.Rerouting Cognitive
structures
1.Extent 2.Richness
Control group Information
processing 1.Defining 2.Describing 3.Comparing 4.Conditional inferring 5.Explaining 6.Irrelevant
Metacognitive Regulation
1.Selecting 2.Maintaining
3.Updating 4.Rerouting Cognitive
structures
1.Extent 2.Richness
Unit: Bicycle Experimental
Control
4 4 4
High achievers Middle achievers
Low achievers
Experimental group
High achievers Middle achievers
Low achievers
Control group 5