國立臺灣大學理學院化學系 碩士論文
Department of Chemistry College of Science
National Taiwan University Master Thesis
以紫外線吸收光譜法測量甲基乙烯基酮氧化物 (一種共振穩定的克里奇中間體)的反應動力學
Kinetics of Methyl Vinyl Ketone Oxide, A
Resonance-Stabilized Criegee Intermediate, Studied by UV Absorption Spectrometry
林妍秀 Yen-Hsiu Lin
指導教授:林志民 博士 Advisor: Jim Jr-Min Lin, Ph.D.
中華民國 109 年 6 月 June 2020
摘要
由烯類的臭氧化反應產生的克里奇中間體是大氣中很活潑的氧化劑,會和二 氧化硫、二氧化氮、水蒸氣、有機酸、無機酸等氣體分子反應,或單分子分解產 生氫氧自由基,進而影響大氣的氧化能力及酸雨、氣膠等之形成。
異戊二烯是大氣中含量最豐富的烯類,臭氧化異戊二烯將產生最簡單的克里 奇中間體(CH2OO)、甲基乙烯基酮氧化物(CH3(C2H3)COO,簡稱 MVKO)及甲基丙 烯醛氧化物(H2C=C(CH3)CHOO)。MVKO 及 H2C=C(CH3)CHOO 為共振穩定的克里 奇中間體,目前直接觀測此種克里奇中間體的研究並不多,我們預期共振穩定結 構將影響此種克里奇中間體的反應動力學行為。
我們實驗室使用 Barber et al. (J. Am. Chem. Soc., 2018, 140, 10866)所發表的方 法來產生 MVKO (ICH2CHCICH3 + h→ CH3(C2H3)CI + I,CH3(C2H3)CI + O2 → CH3(C2H3)COO + I),並根據 Vansco et al. (J. Chem. Phys.,2018, 149, 244309) 及 Caravan et al.(包括我們實驗室) (Proc. Natl. Acad. Sci. U.S.A., 2020, 117, 9733-9740) 報導的 MVKO 紫外光吸收光譜,藉著測量 MVKO 對 340 nm 紫外光吸收度隨時間 的變化,來觀察其反應動力學。我們發現在高壓(>100 Torr)下,MVKO 有個較慢
的生成過程(約 1-2 ms),我們推測此過程可能是加成物的分解反應(CH3(C2H3)CIOO
→ CH3(C2H3)COO + I),據此提出的動力學模型可描述 MVKO 濃度隨時間的變化。
實驗測得加成物分解反應具有正溫度效應,活化能為(14.0±0.9) kcal mol1;此值與
我們實驗室 (Lin et al., Phys. Chem. Chem. Phys., 2020, 22, 13603) 報導的理論計算
的加成物分解所需能量 14.0 kcal mol1相近。加成物較 MVKO 穩定,但推測由於
加成物不像 MVKO 具有共振穩定結構,加成物與 MVKO 的能量差僅有 14.0 kcal
mol1,因此我們才能在微秒尺度觀測到加成物分解為 MVKO 的反應。
我們測量 MVKO 跟二氧化硫的反應,求得反應速率常數在 298 K 為(4.0±0.6) x
1011 cm3 s1,且在 4-703 Torr 之間沒有明顯的壓力效應,活化能為(3.1±0.8)
kcal mol1,負的活化能代表此反應的過渡態能量低於反應物。我們也量測甲基乙
烯基酮氧化物的單分子分解反應,求得反應速率常數在 299 K 為(71±18) s1,且在
100-503 Torr 沒有明顯的壓力效應,活化能為(8.3±2.5) kcal mol1。跟小型克里奇中 間體比較,MVKO 在 299 K 的單分子反應速率常數比最簡單的克里奇中間體 (CH2OO, (0.19±0.07) s1 at 297±1 K)快,但比 syn-甲基取代克里奇中間體 (syn-CH3CHOO, 122 s1)跟雙甲基取代的克里奇中間體((CH3)2COO, 361 s1)慢 (Chem. Soc. Rev., 2017, 46, 7483-7497.)。依據實驗結果,我們推測 MVKO 在大氣中 的主要分解途徑為單分子分解反應。
關鍵詞:克里奇中間體、紫外光吸收光譜、氣態反應動力學、雙分子反應、單分 子分解反應
Abstract
Criegee intermediates, known as carbonyl oxides, are very reactive species
generated from ozonolysis of alkenes. Criegee intermediates can react with atmospheric gases, such as SO2, NO2, H2O, organic acid, inorganic acid, volatile organic compounds (VOCs), etc. and the unimolecular decomposition of Criegee intermediates generate OH radicals. These processes play important roles in atmospheric chemistry.
Isoprene is the most abundant alkene in the atmosphere. Ozonolysis of isoprene generates the simplest Criegee intermediate (CH2OO), methyl vinyl ketone oxide (CH3(C2H3)COO, MVKO), and methacrolein oxide (H2C=C(CH3)CHOO, MACRO).
Our group used the method reported by Barber et al. (J. Am. Chem. Soc., 2018, 140, 10866) to generate MVKO (ICH2CHCICH3 + h→ CH3(C2H3)CI + I,CH3(C2H3)CI + O2 → CH3(C2H3)COO + I). Utilizing the UV absorption spectrum reported by Vansco et al. (J. Chem. Phys.,2018, 149, 244309) and Caravan et al.(including our group) (Proc.
Natl. Acad. Sci. U.S.A. 2020, 117, 9733-9740), we studied the kinetics of MVKO with
its UV absorption at 340 nm. We found that at high pressure (>100 Torr), there ia a slow process of MVKO formation (1-2 ms). We assume that this slow formation of MVKO is from the decomposition of the adduct (CH3(C2H3)CIOO → CH3(C2H3)COO + I). Based on this adduct mechanism, our kinetic model agrees very well with the experimental observations of MVKO kinetics. The activation energy of the decomposition of the
adduct was measured to be (14.0±0.9) kcal mol1, which is similar to the calculated energy difference between CH3(C2H3)CIOO and (MVKO + I) reported by our group (Lin et al., Phys. Chem. Chem. Phys., 2020, 22, 13603). The adduct is more stable than MVKO. However, because the adduct has no resonance-stabilized structure like MVKO, the energy difference between the adduct and MVKO is only 14.0 kcal mol1, and the rate coefficient of the formation of MVKO from the adduct can reach ~103 s1 at room temperature.
We studied the kinetics of the reaction of MVKO with SO2; the observed reaction
rate coefficient is (4.0±0.6) x 1011 cm3 s1 at 298 K with an insignificant pressure effect in range 4-703 Torr. The activation energy was measured to be (3.1±0.8) kcal mol1. A
negative activation energy means that the transition state energy is lower than that of the reactants. We also studied the unimolecular decomposition of MVKO, and the rate coefficient was determined to be (71±18) s1 at 299 K with an insignificant pressure effect for 100-503 Torr. The measured activation energy is (8.3±2.5) kcal mol1 at 302 Torr and 278-319 K. Comparing with small Criegee intermediates, the measured unimolecular decomposition rate coefficient of MVKO at 299 K is larger than that of CH2OO ((0.19±0.07) s1 at 297±1 K), and smaller than those of syn-CH3CHOO (122 s1) and (CH3)2COO (361 s1). According to the experimental results, we conclude that the dominant removal pathway for MVKO in the atmosphere is its unimolecular
decomposition.
Keywords: Criegee intermediates, UV absorption spectrum, gas phase reaction kinetics, bimolecular reactions, unimolecular reactions
Table of Contents
摘要……….. i
Abstract………. iii
Chapter 1. Introduction………... 1
Chapter 2. Experimental setup………. 7
2.1 Production of MVKO……….. 7
2.2 Light path……….………... 8
2.3 The measurements of the concentrations of SO2 and 1,3-diiodo-2-butene... 11
2.4 Impurity in 1,3-diiodo-2-butene (sample)………... 13
2.5 The temperature of the reactor... 19
Chapter 3. Reaction of MVKO with SO2 and Kinetics of the Adduct... 20
3.1 Time traces of MVKO at different pressure... 20
3.2 Analysis... 24
3.3 Results... 29
3.3.1 Results at 298 K and 4-703 Torr... 29
3.3.2 Results at 278-319 K and 302 Torr... 32
3.4 Discussion...33
3.4.1 MVKO conformer distribution...33
3.4.2 The comparison between adducts: CH2IOO v.s. CH3(C2H3)CIOO... 34
3.4.3 The reaction of Criegee intermediates with SO2... 37
3.5 Conclusions... 38
Chapter 4. Unimolecular Decomposition of MVKO...40
4.1 The reaction of MVKO at 278-319 K and 302 Torr... 40
4.2 Analysis... 44
4.3 Results... ... 49
4.4 Unknown species... 58
4.5 Discussion... 66
4.5.1 Unimolecular decomposition of Criegee intermediates... 66
4.5.2 MVKO in the atmosphere... 67
4.5.3 Possible source for the unknown species... 69
4.6 Conclusions... 70
References... 72
List of Figures
Figure 1. Four conformers of MVKO with their calculated zero-point-corrected energies….4 Figure 2. Schematic diagram of the optical light path………. 9 Figure 3. UV absorption spectrum of MVKO at 298 K………... 10 Figure 4. The experimental setup for the mass system……… 15 Figure 5. The mass spectrum of the precursor (1,3-diiodo-2-butene, m=308) sample
measured by RGA………... 16 Figure 6. The observed time trace of MVKO while the precursor sample mass spectrum is also recorded………... 17 Figure 7. Time profiles of mass channels of the precursor (1,3-diiodo-2-butene, m=308) sample from RGA, the maximum of the absorbance change of MVKO, and the
observed decay rate coefficient (kobs) of MVKO………... 18 Figure 8. Typical time traces of absorbance change of MVKO at various [SO2] at 4.2
Torr and 298 K………... 20 Figure 9. Time traces of the absorbance change of MVKO under various [SO2] at 102 Torr and 299 K………... 22 Figure 10. Time traces of MVKO at 31-702 Torr and 299 K with the concentration of
the precursor and the laser fluence controlled to be constant……….. 23 Figure 11. Time trace of MVKO absorption and its model fit at 102 Torr and 299 K…… 26 Figure 12. Time traces of MVKO under various [SO2] at 102 Torr and 299 K………….. 27 Figure 13. The observed decay rate, kobs, from the “kobs local fit” as a function of [SO2]... 28 Figure 14. Plot of fitting parameters, kSO2, adduct yield (1), and kr, as functions of the total pressure……… 30 Figure 15. Arrhenius plots of kSO2 and kr at 302 Torr and 278-319 K………. 32 Figure 16. The calculated effective potential energy curves along the CI and CO
bonds for the CH2OO + I and MVKO + I systems……….. 36 Figure 17. Time traces of MVKO under various [SO2] at 301 Torr………... 42 Figure 18. Pseudo-first-order plots of the reaction of MVKO with SO2 at 301 Torr and 319 K/299 K/278 K………. 43 Figure 19. Plot of k0 against L[MVKO]total at 302 Torr and 278-319 K……….... 44 Figure 20. The time traces of the absorption signal of CH2OO under various [CH2OO]0 at 301 Torr and 299 K………..…… 45 Figure 21. The plot of kobs against [CH2OO]0 at 301 Torr and 278-319 K……….. 47 Figure 22. Plot of the wall loss rate against temperature at 301 Torr……….. 47 Figure 23. Arrhenius plot of the unimolecular decomposition rate coefficient of MVKO at 302 Torr……… 49 Figure 24. Plots of kSO2, the adduct yield (1), and kr against L[MVKO]total at 302
Torr and 278-319 K………... 51 Figure 25. Plot of k0 against L[MVKO]total at 299 K and 100-503 Torr……… 52 Figure 26. Plot of kSO2, the adduct yield (1), and kr as functions of L[MVKO]total at 299 K and 100-503 Torr……….. 53 Figure 27. The time trace of absorption signal of MVKO at 319 K and 303 Torr……….. 58 Figure 28. Time traces of absorption signal of MVKO with [SO2] = 0/2.2 x 1014 cm3…. 59 Figure 29. The time trace of the absorption signal of MVKO and its fitting result……… 61 Figure 30. The Arrhenius plot of the unimolecular decomposition rate coefficient of
MVKO at 302 Torr……….. 62 Figure 31. The Arrhenius plot of the reaction rate coefficient of MVKO with SO2 at 302 Torr……….. 62 Figure 32. Plot of the effective yield of the unknown species against temperature…….... 63
Figure 33. The estimated absorption spectra of CH3(C2H3)COO,
(CH2=CH)(CH2)-COOH, H2C=C(O)-C(H)=CH2, and CH3(C2H3)CIOO………... 70
List of Tables
Table 1. Summary of experimental conditions and fitting results of the reaction of
MVKO with SO2 at 298 K and 4-703 Torr……….. 31 Table 2. Calculated relative energies H and equilibrium constants Keq for MVKO + I
and CH2OO + I system……… 35
Table 3. Summary of experimental conditions and the results of the wall loss by the
measurement of the kinetics of CH2OO at 301 Torr and 278-319 K………... 48 Table 4. Summary of experimental conditions and fitting results of the unimolecular
decomposition of MVKO at 100-503 Torr and 278-319 K………... 54 Table 5. Summary of the experimental conditions and the fitting results of the unimolecular decomposition of MVKO of experimental subsets at 100-503 Torr and 278-319 K……... 55 Table 6. Summary of experiment conditions and fitting results of the unimolecular
decomposition of MVKO with the model considering the unknown species at 302 Torr and 298-319 K………. 63 Table 7. Comparison of the two results with and without the unknown species U in the unimolecular decomposition of MVKO at 302 Torr………... 65 Table 8. Summary of the bimolecular rate coefficients of MVKO with atmospheric
species……….. 67
Chapter 1. Introduction
Criegee intermediates, also known as carbonyl oxides, are generated through ozonolysis of alkene in the atmosphere.1 Criegee intermediates can react with atmospheric gases, such as SO2, NOx, H2O, organic acid, inorganic acid, volatile organic compounds (VOCs), etc. Also, the unimolecular decomposition of Criegee intermediates generates OH radicals, which plays an important role in atmospheric chemistry.2
Before 2012, the direct measurement of the Criegee intermediate in kinetic studies was unachievable. The steady-state concentration of the Criegee intermediate is
estimated by Equation 1 below.
3
3
alkene O 3
s.s.
uni CI+O 3 CI+alkene CI+product
[alkene][O ]
[CI] [O ] [alkene] [product]
k
k k k k
(Equation 1)
where kalkene+O3 represents the reaction rate coefficient of ozone with alkene, which is only ~1017 cm3 s1;3 kuni indicated the unimolecular decay rate of Criegee intermediates, which is ~101-103 s1 dependent on the structure of Criegee intermediates;4-6 kCI+O3 is the reaction rate coefficient of Criegee intermediates with ozone, which has been reported to be 6.7 x 1014 cm3 s1 for CH2OO;7 kCI+alkene means the reaction rate coefficient of Criegee intermediates with alkene, which has been reported to be 1.5 x
1015 cm3 s1 for the reaction of CH2OO with isoprene;8 kCI+product is the reaction rate
coefficient of Criegee intermediate with products, such as aldehyde, ketone, acid, etc, the reaction rate coefficients of Criegee intermediates with acids has been reported to be
~1010-1011 cm3 s1.6, 9
Assume [alkene] = 1010 cm3, [O3] = 1012 cm3, and the reaction rate coefficients of Criegee intermediates + O3 and Criegee intermediates + alkene can be represented by the rate coefficients of CH2OO + O3 and CH2OO + isoprene, the steady-state
concentration of Criegee intermediates is estimated to be:
17 3 1 10 3 12 3
s.s. 1 3 1 14 3 1 12 3 15 3 1 10 3
CI+product
2 4 3
10 cm s 10 cm 10 cm
[CI]
(10 -10 ) s 6.7 10 cm s 10 cm 1.5 10 cm s 10 cm [product]
~ 10 -10 cm
k
which is too low to be measured directly.
If we increase the concentration of alkene and O3 to obtain higher concentration of Criegee intermediates, the concentration of byproducts, such as aldehyde, ketone, and acid, would also increase. The reaction of Criegee intermediates with byproducts would make the kinetics of Criegee intermediates too complicated to be solved.
The reaction rate coefficients obtained from indirect measurements have a large scatter of several orders of magnitude.5, 10 At 2012, Taatjes et al. reported a method to generate the simplest Criegee intermediate (CH2OO) through the reaction of O2 and a iodo-alkyl radical, produced from the photolysis of diiodomethane (CH2I2 + h → CH2I
+ I; CH2I + O2 → CH2OO + I), and directly measured the kinetics of Criegee
intermediate for the first time.11 Many researches on small alkyl Criegee intermediates (CH2OO, CH3CHOO, (CH3)2COO, CH3CH2CHOO) emerged since then, and there have been several reviews to summary these works.6, 12-18 However, due to the lack of proper precursors, the researches on large and non-alkyl Criegee intermediates are relatively
scarce.
Isoprene is the most abundant alkene in the atmosphere.19 The ozonolysis of isoprene can generate three kinds of Criegee intermediates, which are methyl vinyl ketone oxide (CH3(C2H3)COO, MVKO, yield = 0.23), formaldehyde oxide (CH2OO, yield = 0.58), and methacrolein oxide (CH3CCH2CHOO, MACRO, yield = 0.19).4 Both MVKO and MACRO are resonance-stabilized vinyl substituted Criegee intermediates. However, it is difficult to study their individual kinetics from the ozonolysis of isoprene.20, 21
At 2018, Barber et al. reported a new method to produce methyl vinyl ketone oxide from the reaction of O2 and an iodo-alkenyl radical, which was produced from the
photolysis of 1,3-diiodo-2-butene (ICH3CHCICH3 + h → CH3(C2H3)CI + I;
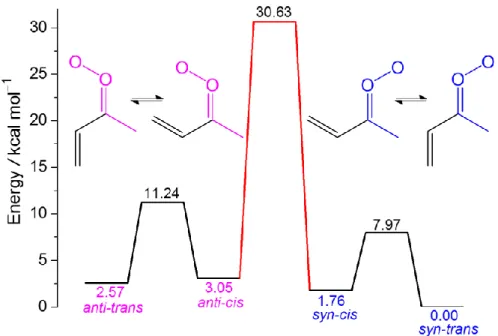
CH3(C2H3)CI + O2 → CH3(C2H3)COO (MVKO) + I).4 This method made the direct measurement of MVKO in kinetic studies possible. There are four possible conformers of MVKO, which are syn-trans-MVKO, syn-cis-MVKO, anti-trans-MVKO, and
anti-cis-MVKO; syn and anti refer to the orientation of methyl group with respect to the
terminal oxygen, while trans and cis refer to the orientation of the C=C and C=O double bond. The calculated barrier for the trans-cis isomerization is lower than that of the syn-anti isomerization. syn-trans-MVKO is the most stable conformer.4 (See Figure 1)
Figure 1. Four conformers of MVKO with their calculated zero-point-corrected energies.
The calculated isomerization barriers are also shown. The calculated values are adapted from Barber et al.4 Geometries optimization is done at the B2PLYP-D3/cc-pVTZ level, and energies are calculated at the ANL0-B2F level. The stationary point energy for the transition state of anti-cis-MVKO to syn-cis-MVKO is calculated by
CCSD(T)-F12b/cc-pVTZ-F12 with some corrections.
Barber et al. used an infrared laser to pump MVKO and probed the OH radical product with laser induced fluorescence. IR spectrum of MVKO was measured with this IR pump-UV probe system. All four conformers of MVKO were observed. The
energy-dependent unimolecular decay rate coefficients k(E) of MVKO were also
obtained through the formation rate coefficient of OH radicals from MVKO excited in the region of CH stretch overtone (2CH). The thermal-dependent unimolecular decay
rate coefficient k(T) was predicted through the extension of k(E) with the master
equation modeling. For syn-MVKO, the thermal rate coefficient for unimolecular decay was calculated to be 33 s1 at 298K, and that for anti-MVKO was reported to be 2140 s1.4
Vansco et al. used the same method as Barber et al. to generate MVKO in pulsed supersonic expansion. MVKO was excited at its first * ← electronic band with
tunable UV-Vis light at 305-480 nm before being ionized with vacuum ultraviolent photoionization at 118 nm. The UV spectrum of MVKO with peak at 388 nm was measured from the depletion of the mass signal at m/z = 86 channel (MVKO, m = 86).22 At 2020, Caravan et al. (including our group) reported the UV absorption spectrum of MVKO at 298 K with multi-pass broadband probe light. The peak of the spectrum was at 370.6 nm with full width at half maximum (FWHM) of 73.4 nm.9 Comparing the UV spectrum of MVKO with that of small alkyl Criegee intermediates,23-26 we could find
that the spectrum of MVKO was red-shifted. This result is consistent with the previous theoretical research.27
Our group generated MVKO with the method reported by Barber et al
(ICH3CHCICH3 + h → CH3(C2H3)CI + I; CH3(C2H3)CI + O2 → CH3(C2H3)COO (MVKO) + I)4 and studied the kinetics of MVKO via its strong UV absorption. The detail of experimental setup is in chapter 2. We measured the reaction rate coefficient of MVKO with SO2 at 4-703 Torr. Also, we observed that the behavior of MVKO
generation depends on pressure and used a model with the formation of MVKO from an adduct to explain this phenomenon. The recorded time traces of MVKO were fitted well with the model considering the adduct kinetics. The results and discussion about the kinetics of the adduct as well as the reaction of MVKO with SO2 are in chapter 3.
Chapter 4 discusses the unimolecular decomposition of MVKO. The unimolecular reaction of MVKO was measured in 100-503 Torr and at 278-319 K.
Chapter 2. Experimental setup 2.1 Production of MVKO
We followed the innovative method of Barber et al. to produce MVKO. The related reactions were listed below (R1-R2). MVKO was generated from the reaction of O2
with the radical produced from laser photolysis of (Z)-1,3-diiodo-2-butene (Accela, >
98.1 % by gas chromatography).4
ICH2CHCICH3 + h→ CH3(C2H3)CI + I (R1) CH3(C2H3)CI + O2 → CH3(C2H3)COO (MVKO) + I (R2)
The 248-nm KrF excimer laser (Coherent, CompExPro 205F) was used for the photolysis light source. The precursor (1,3-diiodo-2-butene)/O2/N2 flow was mixed with the reactant SO2/N2 flow right before entering the reactor. The reaction gases were injected through the middle of the reactor and were pumped out from two ends. All gas flows were controlled by mass flow controllers (Brooks, 5850E/Bronkhost FG-201 CV).
The gases in the reactor were adjusted to fully refresh between each laser pulse.
(Photolysis rate: 0.55-1.7 Hz)
2.2 Light path
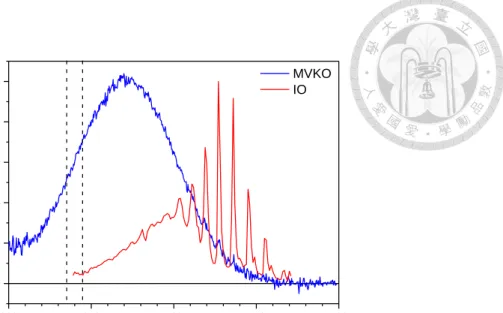
The UV spectrum of MVKO has been reported by Vansco et al. (peak at 388 nm)22 and Caravan et al. (peak at 370.6 nm with FWHM of 73.4 nm; see Figure 3)9. We measured MVKO with its strong UV absorption at 340 nm to avoid the signal of byproduct IO. A broadband Xe lamp (Energetiq, EQ-99) was used as the probe light source and was focused by an achromatic lens (f = 100 mm, Thorlabs,
ACA254-100-UV) to the reactor. The reactor was glass tube with inner diameter 1.9 cm and length 80 cm, sealed with anti-reflection SiO2 windows (Edmund, 65875) at two ends. To prevent windows from contamination, N2 flowed from two sides for purges and reduced the effective sample length to 71 cm. To enhance the absorption signal, the probe light was reflected six times through the reactor by a prism (Thorlabs, PS609, fused silica, right-angle, uncoated, 5 mm) and a spherical mirror (R=1m, Thorlabs, CM750-500-F01). The effective light path was therefore 426 cm. The signal was then reflected by another prism and mirrors (Edmund, 68315 or 48016), and was focused by a lens (f = 50 mm) to the balanced photodiode detector (Thorlabs, PDB450A). The reference beam was focused by another achromatic lens (f = 150 mm, Thorlabs,
ACA254-150-UV), and passed through a neutral density filter for tuning the intensity to be similar to that of the signal beam. The reference beam was reflected by mirrors (Edmund, 68315 or 48016) and was focused to the balanced photodiode detector
(Thorlabs, PDB450A). Both signal and reference beam went through a 340 nm bandpass filter (Edmund Optics, 65129, 10 nm OD4) in front of the detector to select the probe wavelength. Figure 2. shows the schematic diagram of our optical light path.
The signals were recorded with the oscilloscope (LeCroy, HDO4034). The time traces of 60-120 laser pulses were averaged to improve the signal-to-noise ratio.
Figure 2. Schematic diagram of the optical light path. NDF: neutral density filter. LP 275: long-pass filter at 275 nm. This figure is adapted from Chao et al.28
Figure 3. Blue line: UV absorption spectrum of MVKO at 298 K recorded in our laboratory; it has been reported by Caravan et al.9 Red line: UV absorption spectrum of byproduct IO.29 The range between the two dashed lines represents our probe
wavelength range (340±5) nm.
The 248 nm photolysis laser beam passed through an attenuator and was focused by a cylindrical lens (1m). Two long pass filters (Asahi Spectra Co., Ltd. UV 275 nm, 25 mm dia. F0201 & F0204) were placed in the two ends of the reactor, and coupled the photolysis laser pulse in and out of the reactor. After reflected out of the reactor, the laser pulse energy was measured by an energy meter (Gentec EO, UP25N-100H-H9-D0 for the experiments of the reaction of MVKO with SO2) or a thermal meter (Gentec EO, QE25SP-H-MB-D0 for the experiments of the unimolecular decomposition of MVKO).
300 350 400 450 500
0.0 0.2 0.4 0.6 0.8 1.0
Normalized Abs
Wavelength / nm
MVKO IO
The laser pulse was triggered by a delay generator (DG535), and the data recording was controlled by a LabView program.
2.3 The measurements of the concentrations of SO2 and 1,3-diiodo-2-butene Both the concentrations of 1,3-diiodo-2-butene and SO2 were determined by UV absorption spectrum. The measurements for 1,3-diiodo-2-butene and SO2 were
performed in two glass cells separately (length = 90 or 75.3 cm for 1,3-diiodo-2-butene / 90 cm for SO2; diameter = 1.2 cm for both cases). Deuterium lamps (Hamamatsu, L10904) were used as the probe light sources and the detectors were mini spectrometers (Ibsen FHW-380 for SO2 and Ocean Optics, FLAME-S-XR1-ES for
1,3-diiodo-2-butene).
SO2 (Matheson, 99.98 %) was diluted in a ~2 L stainless steel cylinder with N2
before the experiments. To get the concentration of SO2, we used Beer’s law with Equation 2.
2 2
2 2 2 2
250nm 350nm
SO _cell SO _cell
200nm 200nm
2 cell 250nm 350nm
SO _cell 200nm SO SO _cell 200nm SO
( ) ( )
[SO ] or
( ) ( )
Abs d Abs d
L d L d
(Equation 2) where [SO2]cell is [SO2] in the glass cell, LSO2_cell is the light path length in the glass cell, which is 90 cm, AbsSO2_cell(λ) represents the absorbance of SO2 in the glass cell, SO2
indicates the cross section of SO2.30
As for 1,3-diiodo-2-butene, due to the lack of absolute UV absorption cross section, the concentration could not be derived. Thus, we presented the concentration of
precursor by its absorbance (Absprec) at 238.5 nm in the reactor.
[SO2] and Absprec in the photolysis reactor were derived by considering flow mixing ratio, temperature, and pressure difference between the cell and the reactor by assuming ideal gas behavior as Equations 3-5. (For Absprec, the difference between effective light paths of the cell and the reactor was also considered.) The temperature and pressure of the cell were measured by a temperature meter (Rotronics, HC2-S) tied on the cell and gauges (INFICON, CDG025D 1000 Torr) connected in the middle.
2 2
2
SO _cell reactor SO _cell 2 reactor 2 cell
reactor SO _cell reactor
[SO ] [SO ] F P Temp
F P Temp
(Equation 3)
where FSO2_cell is the flow through the glass cell for [SO2] measurement, Freactor is the total flow through the reactor, PSO2_cell and TempSO2_cell represent the pressure and temperature of the glass cell for [SO2] measurement. Preactor and Tempreactor indicate the pressure and temperature of the reactor.
prec prec_cell
lnT Abs
(Equation 4)
prec_cell reactor prec_cell reactor prec_reactor prec_cell
reactor prec_cell reactor prec_cell
F P Temp L
Abs Abs
F P Temp L
(Equation 5)
where Tprec and Absprec_cell represent the transmittance and absorbance of precursor in the glass cell, Absprec_reactor is the absorbance of precursor in the reactor, Fprec_cell is the flow through the glass cell for precursor measurement, Pprec_cell and Tempprec_cell represent the pressure and temperature of the glass cell for precursor measurement. Lreactor is the length of effective optical path in the reactor, which is 426 cm. Lprec_cell is the length of light path in the glass cell, which is 75.3 or 90 cm.
2.4 Impurity in 1,3-diiodo-2-butene (sample)
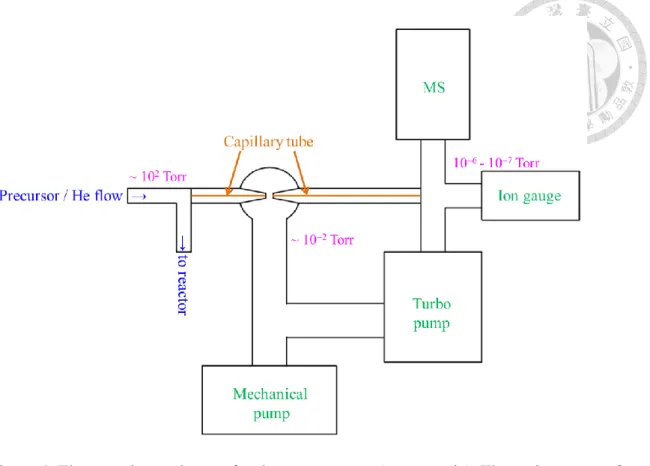
We used a quadruple mass spectrometer (Stanford Research Systems, RGA 200) to check the impurity in the precursor sample during the experiments. The schematic setup of RGA is shown in Figure 4. The precursor was carried out by a He flow, and a small amount of precursor / He flow was sent to RGA through a jet separator made of
capillary tubes. The RGA system was pumped by a turbo pump (PFEIFFER, TMU 064) to around 106-107 Torr, and the pressure was measured by an ion gauge
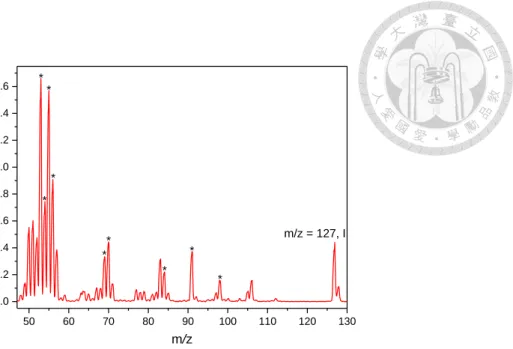
(Granville-Phillips). A mechanical pump (Edwards, RV Two Stage 12) served as the backing pump for the turbo pump, and was also used to pump the jet separator to ~102 Torr while the pressure in the reactor was ~102 Torr. The result of the RGA was shown in Figure 5. We started the mass spectrum scan from m/z = 47 to avoid saturating the detector by the large signal of carbon dioxide (m/z = 44). The nominal mass of the
precursor (C4H6I2) is 308 amu, and possible daughter ions are m/z = 54 (C4H6+
), 53 (C4H5+
). The mass channels m/z = 127,128 represent the signal from I and HI, and the signals of m/z = 55-126 could be from impurities. We checked the mass spectra of the reactants in the synthesis process of the precursor,4 but none of them match the
spectrum we measured. The possible sources of the impurities are unknown in this point.
Meanwhile, the mainstream of the precursor / He flow was mixed with an O2 flow and a buffer N2 flow before flowing into the reactor and photolyzed by 248 nm laser pulses to generate MVKO. (Photolysis rate: 3.01 Hz) The time traces were averaged for 100 laser pulses, and shown in Figure 6. Equation 6 was used to fit the time traces. (kobs indicates the observed decay rate coefficient of the trace. More detail of the fitting model is discussed in Chapter 3.2)
obs obs r
0
total r 0
r obs
[MVKO]( )
[MKVO] { k t (1 ) [ k t k t]}
Abs L t C
L e k e e C
k k
(Equation 6)
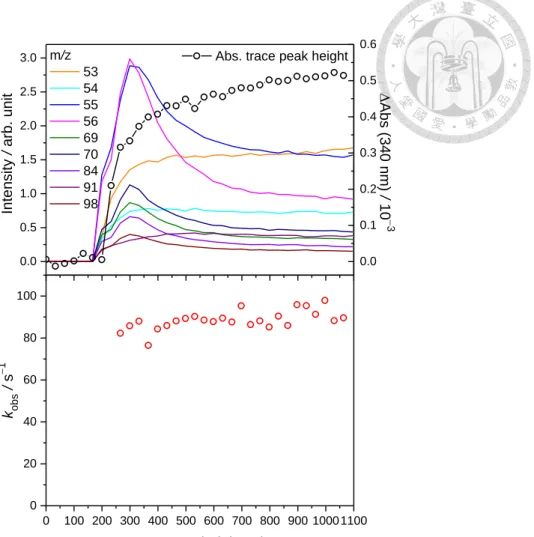
The temporal behaviors of specific m/z mass channels were recorded while the time trace of MVKO was recorded. The results are shown in Figure 7. The observed decay rate coefficient of MVKO (kobs) did not correlate to the intensities of the impurity mass peaks. Thus, even though there were some impurities in the precursor, these impurities did not affect the kinetics of MVKO.
Figure 4. The experimental setup for the mass system (not to scale). The main stream of the precursor / He flow is introduced to the reactor while a minor flow is sent to a quadrupole mass spectrometer through a jet separator to measure the mass spectrum.
Figure 5. The mass spectrum of the precursor (1,3-diiodo-2-butene, C4H6I2, m=308) sample measured by RGA. The signal at m/z = 54 could be from C4H6+
, which could be a daughter ion of the precursor. The peaks at m/z = 127, 128 mass channels represent the signal of I and HI, and the peaks at m/z = 55-126 might be from impurities. The time behaviors of the peaks with star marks (m/z = 53, 54, 55, 56, 69, 70, 84, 91, and 98 mass channel.) are recorded. (Figure 7. Upper panel)
50 60 70 80 90 100 110 120 130
0.0 0.2 0.4 0.6 0.8 1.0 1.2 1.4 1.6
*
*
*
*
*
*
*
*
Intensity / arb. unit
m/z
m/z = 127, I
*
Figure 6. The observed time trace of MVKO while the precursor sample mass spectrum is also recorded. (P = 300 Torr. PO2 = 11.2 Torr. T = 299 K. Laser fluence = 2.04 mJ cm2. Absprec in the reactor = 0.03.) The time zero is set as the laser pulse. The probe wavelength is (340±5) nm. The black curve represents the fitting result from Equation 6.
0 10 20 30 40
0.0 0.1 0.2 0.3 0.4 0.5 0.6
Abs (340 nm) / 103
Time / ms
Figure 7. Upper panel: Representative time-dependent signals of m/z = 53, 54, 55, 56, 69, 70, 84, 91, 98 mass channels of the sample from RGA (left y-axis) & the time
profile of the maximum of the absorbance change of MVKO (right y-axis). Lower panel:
the time behavior of the observed decay rate coefficient (kobs) of MVKO. The observed decay rate coefficient does not correlate to the time behavior of most of the mass peaks, for example, signals m/z = 55, 56 have pronounced peaks at ~300 s but the observed decay rate coefficient does not correlate to them. The observed rate coefficient seems to be quite consistent with time. (kobs = (88.6 ± 4.53) s1, avg ± 1 std).
0.0 0.5 1.0 1.5 2.0 2.5 3.0
0 100 200 300 400 500 600 700 800 900 1000 1100 0
20 40 60 80 100
Intensity / arb. unit
m/z 53 54 55 56 69 70 84 91 98
0.0 0.1 0.2 0.3 0.4 0.5 0.6 Abs. trace peak height
Abs (340 nm) / 10 3
kobs / s1
Data recorded time / s
2.5 The temperature of the reactor
The reactor was a double-layer glass tube. The outer jacket was filled with water circulated from a constant temperature bath (Yih Der BL-730) to control the
temperature of the reactor. The circulated water entered the outer jacket of the reactor from two sides and went out from the middle. The water then flowed into a water bath used to preheat and precool the mainstream of reaction gases through a ~ 75 cm long copper tube before it circulated back to the constant temperature bath. To calibrate the temperature of reaction gases, a resistance temperature detector (RTD) was stuck into the reactor with N2 flowing before the experiments. The temperature difference between the gas temperature in the inner jacket and the water temperature in the outer jacket of the reactor was less than 0.5 oC. During experiments, 3 RTDs were placed at the two ends and the middle of the reactor to measure the temperature of water at the outer jacket of the reactor.
Chapter 3. Reaction of MVKO with SO2 and Kinetics of the Adduct (CH3(C2H3)CIOO)
3.1 Time traces of MVKO at different pressure
The time traces of MVKO absorption signal under various [SO2] at 4.2 Torr and 298 K are shown in Figure 8. The change of the absorbance after the photolysis laser pulse is proportional to the concentration of MVKO. From Figure 8, we can find that MVKO reacts with SO2, and the time trace of MVKO decays faster under higher [SO2].
Figure 8. Typical time traces of absorbance change of MVKO at various [SO2] at 4.2 Torr and 298 K. The data are from Table 1, Exp K1. The probe wavelength = (340±5) nm. The time zero is set as the photolysis laser pulse. At higher [SO2], the signal of MVKO decays faster.
We also checked the time traces of MVKO at various [SO2] at 102 Torr and 299 K.
(See Figure 9) Unlike the time traces at 4.2 Torr, the prompt generation of MVKO right after the laser pulse is followed by a slow formation of MVKO at 102 Torr. The
concentration of MVKO reaches its peak at around 1-2 ms delay time. The prompt generation is from the reaction of O2 with the iodo-alkenyl radical. The rate coefficient
has been reported to be 1.7 x 1013 cm3 s1.9 At [O2] ~ 1017 cm3 in our experiments, the lifetime of the iodo-alkenyl radical would be <50 s. To explain the slow formation of
MVKO, we propose that in addition to MVKO (R2a), an adduct (CH3(C2H3)CIOO) (R2b) is also generated in the reaction of O2 with iodo-alkenyl radical (CH3(C2H3)CI).
The slow formation of MVKO is from the reaction of the adduct (R2c) with the
observed lifetime of the adduct to be ~ms. At higher pressure, the adduct is easier to be stabilized; therefore, the yield of the adduct is higher.
ICH2CHCICH3 + h→ CH3(C2H3)CI + I (R1) CH3(C2H3)CI + O2 → CH3(C2H3)COO + I (R2a, k2) CH3(C2H3)CI + O2 + M → CH3(C2H3)CIOO + M (R2b, (1)k2) CH3(C2H3)CIOO + M → CH3(C2H3)COO + I + M (R2c, kr) CH3(C2H3)COO + SO2 → Products (R3, kSO2) CH3(C2H3)COO + X → Products (R4, kX)
Figure 9. Time traces of the absorbance change of MVKO under various [SO2] at 102 Torr and 299 K. The data are from Table 1, Exp K6a. The probe wavelength = (340±5) nm. The time zero is set as the photolysis laser pulse.
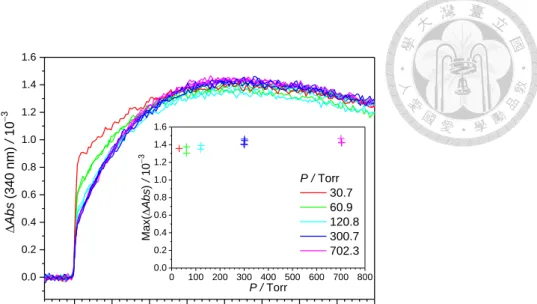
To examine this idea, we did experiments at 31-702 Torr with the concentration of the precursor and the laser fluence controlled to be constant. The result is shown in Figure 10, and the yield of the adduct changes with pressure. The maximums of the absorption signals are similar at 31-702 Torr, which means that all the adduct turns into MVKO eventually.
0 2 4 6 8 10
0.0 0.2 0.4 0.6 0.8
[SO2] / 1013 cm3
0 0.68 1.07 1.53 1.97
Abs (340 nm) / 103
Time / ms
Figure 10. Time traces of MVKO at 31-702 Torr and 299 K with the concentration of the precursor and the laser fluence controlled to be constant. The probe wavelength is (340±5) nm. The time zero is when the photolysis laser pulse fired. PO2 = 11 Torr, N2
balanced; T = 299 K; Absprec = 0.139; Laser fluence = 1.06 mJ cm2. Inset: plot of Max(Abs) against pressure. Max(Abs) is the average of Abs during 1.8-2.4 ms
normalized by the deviation of the concentration of precursor and the laser fluence (~
2%).
0.0 0.5 1.0 1.5 2.0 2.5 3.0 3.5 4.0
0.0 0.2 0.4 0.6 0.8 1.0 1.2 1.4 1.6
0 100 200 300 400 500 600 700 800 0.0
0.2 0.4 0.6 0.8 1.0 1.2 1.4 1.6
Max(Abs) / 103
P / Torr
Abs (340 nm) / 103
Time / ms
P / Torr 30.7 60.9 120.8 300.7 702.3
3.2 Analysis
From processes R1-R4, we can write the equations below:
3 2 3 3 2 3 0 2 2
[CH (C H )CI]( )t [CH (C H )CI] exp(k [O ] )t (Equation 7)
2 2 3 2 3 0
r 2 2
2 2 r
(1 ) [O ][CH (C H )CI]
[adduct]( ) [ exp exp [O ] ]
[O ]
t k k t k t
k k
(Equation 8)
2 2 3 2 3 0 r
r obs
2 2 r obs r
2 2 3 2 3 0 r
obs 2 2
2 2 r obs 2 2
2 2 3 2 3 0
obs
obs 2 2
[O ](1 )[CH (C H )CI]
[MVKO] exp exp( )
[O ] [O ](1 )[CH (C H )CI]
exp( ) exp [O ]
[O ] [O ]
[O ][CH (C H )CI]
exp( ) e
[O ]
k k
k t k t
k k k k
k k
k t k t
k k k k
k k t
k k
xp
k2[O ]2 t
(Equation 9)
where k2 is the reaction rate coefficient of the iodo-alkenyl radical with O2, and has been reported to be 1.7 x 1013 cm3 s1.9 represents the yield of prompt MVKO from the reaction of O2 with iodo-alkenyl radical, (1 is the yield of the adduct from the reaction of O2 with iodo-alkenyl radical, kr indicates the reaction rate coefficient of the adduct → MVKO + I, kobs means the observed decay rate coefficient of MVKO.
From mechanisms R1-R2 and Figure 10, we assume that the iodo-alkenyl radical reacted with O2 would all turn into MVKO or the adduct, and the adduct would all turn into MVKO eventually. Thus, [CH3(C2H3)CI]0 can be written as [MVKO]total. At [O2] ~
1017 cm3 in our experiments, the lifetime of the iodo-alkenyl radical would be <50 s.
Because the rate coefficient k2[O2] (> 2 x 10⁴ s1) is much larger than that of kr or kobs (~102-103 s1), Equations 7-9 can be simplified as Equations 10-12 below:
[MVKO]0 = [MVKO]total [adduct]0 = (1)[MVKO]total (Equation 10) [adduct](t) = [adduct]0 exp(kr t) (Equation 11)
]}
[ )
1 ( {
] M VKO [
] [
] adduct [ ]
M VKO [
) ](
M VKO [
r o b s o b s
r o b s o b s
obs r
r total
obs r
r 0 0
t k t k t
k
t k t k t
k
e k e
k e k
e k e
k e k
t
(Equation 12)
Abs = L[MVKO](t) + C0. (Equation 13) kobs = kSO2[SO2] + k0 (Equation 14) where is the absorption cross section of MVKO at the probe wavelength, L is the
effective light path length (L = 71 x 6 = 426 cm), C0 represents the baseline of the absorption signal at long delay time. The result of fitting is shown in Figure 11.
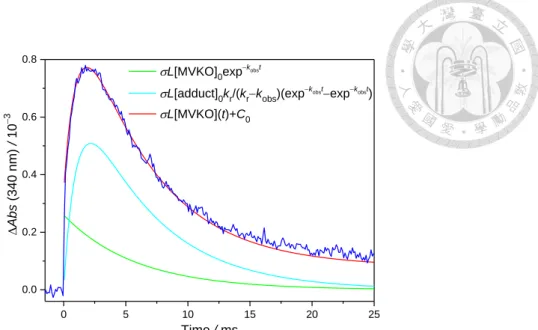
Figure 11. Time trace of MVKO absorption and its model fit at 102 Torr and 299 K. The probe wavelength is (340±5) nm. The fitting range is 0.1-25 ms. The data is from Table 1, Exp K6a. Time zero is when the photolysis laser fired. Green and cyan curves show the fitting of promptly generated MVKO and the fitting of MVKO formed from the reaction of the adduct. The red curve is the sum of them.
During experiments for the reaction of MVKO with SO2, we controlled the concentration of precursor and the laser fluence to be constant, and [SO2] was scanned
up and down in one experimental set. From Equations 12-14, time trace of MVKO absorption can be fitted with six parameters, which are L[MVKO]total, (1), kr, kSO2,
k0, and C0. In the fitting, L[MVKO]total, (1), kr, kSO2, k0 were set as global
parameters which were optimized for all traces in one experimental set, while C0 was
0 5 10 15 20 25
0.0 0.2 0.4 0.6 0.8
Abs (340 nm) / 103
Time / ms
L[MVKO]0expkobst
L[adduct]0kr/(krkobs)(expkobstexpkobst)
L[MVKO](t)+C0
treated as a local parameter optimized to fit each trace. (See Figure 12 for the fitting result.) In this way, the parameters would not couple with one another.
Figure 12. Time traces of MVKO under various [SO2] at 102 Torr and 299 K. [SO2] = 0-4 x 1014 cm3. The data are from Table 1, Exp K6a. The probe wavelength is (340±5) nm. The fitting range is 0.1-25 ms. The laser pulse is set at time zero. Traces are vertically shifted for clarity. With more SO2, the signal of MVKO decays faster. The curves represent the fitting results from Equation 12. Note that there are two traces for each [SO2] except for [SO2] = 4 x 1014 cm3 because we recorded MVKO traces by scanning [SO2] from 0 to maximum, then, back to 0. The stability of our system is good because the traces at the same condition are similar.
0 2 4 6 8 10
0.0 0.2 0.4 0.6 0.8 1.0 1.2 1.4
35.3 2.46 2.01 1.56 1.10 0.67
[SO2] / 1013 cm3
Abs (340 nm) / 103
Time / ms 0
We also tried the “kobs local fit”, in which kobs and C0 are local parameters while
L[MVKO]total, kr, and (1) are set as global parameters. The result is shown in Figure
13. kobs derived from the “kobs local fit” with the data of [SO2] = (0-2.2) x 1013 cm3 is 4.2 x 1011 cm3 s1, which is similar to kobs obtained from the global fit (4.24 x 1011 cm3 s1). However, kobs obtained from the “kobs local fit” would deviate to 3.7 x 1011 cm3 s1 if including the data of [SO2] = 4.4 x 1013 cm3. The data of high [SO2] are less reliable because of small signal. (see Figure 13).
Figure 13. The observed decay rate coefficient, kobs, from the “kobs local fit” as a function of [SO2]. The data are from Exp K8a in Table 1. “kobs local fit” means kobs and C0 are set as local parameters while L[MVKO]total, kr, and (1) are set as global parameters. The solid lines show the range of linear regression, and the dash lines indicated the extension of solid lines. The slope of the linear regression in the range of
0 1 2 3 4 5
0.0 0.5 1.0 1.5 2.0 2.5
kSO2 = 4.2 x 1011 cm3 s1
kobs / 103 s1
[SO2] / 1013 cm3
kSO2 = 3.7 x 1011 cm3 s1
L[MVKO]total = 8.23 x 10⁴, 1 = 0.84, kr = 966 s1
[SO2] = (0-2.2) x 1013 cm3 (red line) is close to the result from the global fit (kSO2 = 4.24 x 1011 cm3 s1). However, for the linear regression including data of [SO2] = 4.4 x
1013 cm3, kSO2 is 3.7 x 1011 cm3 s1. kobs obtained from higher [SO2] could be less reliable due to smaller signal (see Figure 12).
3.3 Results
3.3.1 Results at 298 K and 4-703 Torr
The results of the reaction of MVKO with SO2 at 298 K and 4-703 Torr are shown in Figure 14 and Table 1. From the upper panel of Figure 14, we conclude that the reaction rate coefficient, kSO2 is independent on the total pressure at 4-703 Torr, and kSO2
= (4.0±0.6) x 1011 cm3 s1 at 298 K. The relationship between the adduct yield, (1), and the total pressure is shown in the middle panel of Figure 14. The yield increases sharply from 4 to 101 Torr, and remains nearly a constant (~0.8) for 101-703 Torr. The lower panel of Figure 14 represents the reaction rate coefficient of CH3(C2H3)CIOO → CH3(C2H3)COO + I, kr, plotted against the total pressure. Note that for P < 100 Torr, the concentration of adduct is small and the observed kr is less reliable. At P = 101-703 Torr, kr shows an insignificant pressure effect.
We believe the error of the measured reaction rate coefficient of MVKO with SO2
is mainly from the error of [SO2]. The error of the literature cross section of SO2 is 5-10
%,30 and the error from gas mixing and pressure change is less than 8 %. The error from the baseline of the spectrum is ~5 %. Therefore, the total error of [SO2] is 11-14 %.
Figure 14. Plot of fitting parameters, kSO2, adduct yield (1), and kr, as a function of the total pressure.
0 1 2 3 4 5
0.0 0.2 0.4 0.6 0.8 1.0
0 100 200 300 400 500 600 700 0.0
0.2 0.4 0.6 0.8 1.0 1.2 1.4
301.5 702.5 307.4 307.8 308.1 K6b, K7, K8a, K8b, K8c, Exp,
K1, K2, K4, K5, K6a,
k SO2 / 1011 cm3 s1
P / Torr 4.2 7.6 101.4 301.7 101.5
301.5 702.5 307.4 307.8 308.1 K6b, K7, K8a, K8b, K8c, Exp,
K1, K2, K3 K4, K5, K6a,
P / Torr 4.2 7.6 50.3 101.4 301.7 101.5
yield (1)k r / 103 s1
P / Torr
301.5 702.5 307.4 307.8 308.1 K6b, K7, K8a, K8b, K8c, Exp,
K1, K2, K3 K4, K5, K6a,
P / Torr 4.2 7.6 50.3 101.4 301.7 101.5
![Figure 8. Typical time traces of absorbance change of MVKO at various [SO 2 ] at 4.2 Torr and 298 K](https://thumb-ap.123doks.com/thumbv2/9libinfo/9604410.630601/31.892.251.626.546.823/figure-typical-traces-absorbance-change-mvko-various-torr.webp)
![Figure 9. Time traces of the absorbance change of MVKO under various [SO 2 ] at 102 Torr and 299 K](https://thumb-ap.123doks.com/thumbv2/9libinfo/9604410.630601/33.892.245.788.109.442/figure-time-traces-absorbance-change-mvko-various-torr.webp)
![Figure 13. The observed decay rate coefficient, k obs , from the “k obs local fit” as a function of [SO 2 ]](https://thumb-ap.123doks.com/thumbv2/9libinfo/9604410.630601/39.892.127.783.116.1068/figure-observed-decay-rate-coefficient-obs-local-function.webp)
