國立臺灣大學電機資訊學院資訊工程學系 博士論文
Department of Computer Science and Information Engineering College of Electrical Engineering and Computer Science
National Taiwan University
利用機器學習演算法篩選適當模板結構提升預測轉錄 因子結合序列特徵之準確度
Selecting appropriate template structures to improve precision in predicting protein-DNA binding profiles
簡廷因
Ting-Ying Chien
指導教授:歐陽彥正 博士 陳倩瑜 博士 Advisor: Yen-Jen Oyang, Ph.D.
Chien-Yu Chen, Ph.D 中華民國 102 年 1 月
January 2013
i
中文摘要
DNA 結合蛋白質(DNA-binding protein)利用它的 DNA 結合區域(DNA-binding
domain)鍵結在基因體中的特殊序列上,藉此啟動許多重要的生物反應,例如:轉
錄因子(transcription factor)就為此類蛋白質。能夠準確預測這樣的標的序列,在了
解許多生物反應是非常重要的步驟,這樣的標的序列通常利用位置權重矩陣
(position weight matrix,PWM)表示。過去的研究顯示,若將以知識為基礎的能量
函數(knowledge-based potential function)應用於蛋白質三級結構上,可以產生和實
驗數據相近的位置權重矩陣,然而這樣的想法尚未延伸到缺乏共同結晶結構
(co-crystallized structure)的 DNA 結合蛋白質上。本篇論文的目的旨於探討如何從
蛋白質的非結合狀態結構(unbound structure)去預測 DNA 結合蛋白質的標的序
列。當給定一個目標蛋白質的非結合狀態結構時,本論文提出的方法首先將這個
結構跟資料庫中所有的模板結構 (template structure) 比對,藉此產生人工合成的
蛋白質-DNA 複合物,然後利用支持向量機(support vector machines)建立分類器去
選擇最適當的複合物去預測位置權重矩陣。支持向量機模型所使用的特徵集合包
含目標蛋白質跟模板蛋白質之間的相似度、目標蛋白質與模板蛋白質之二級結構
的組成比例、在人工合成的蛋白質-DNA 複合物中,與 DNA 分子距離介在某個特
殊範圍的胺基酸個數。當最適當的複合物找到之後,本論文利用以知識為基礎的
能量函數去預測目標蛋白質可能可以結合之標的序列的位置權重矩陣。這篇論文
ii
利用19 個已有位置權重矩陣的蛋白質當作驗證的資料。根據這論文的分析,蛋白
質結構在 DNA 結合時所發生的結構變異對於預測的準確度有非常大的影響。此
外這篇論文建立一個網站(DBD2BS),將整個預測位置權重矩陣的流程變得更加便
利,這個網站將不同模板預測出來的位置權重矩陣視覺化,並呈現目標蛋白質、
DNA 結合區域與 DNA 的空間關係,此介面讓使用者容易使用。本篇論文揭示了
在預測缺乏共同結晶結構的蛋白質之標的 DNA 序列的挑戰,結果顯示利用結構
比對(structure alignment)、結構嵌合(docking)跟同源建模 (homology modeling) 等
方法建構人工合成複合物時仍需要更多的努力。
關鍵詞:DNA 結合蛋白質、轉錄因子、蛋白質-DNA 結合特徵、以知識為基礎的
能量函數、支持向量機
iii
Abstract
DNA-binding proteins such as transcription factors use DNA-binding domains (DBDs)
to bind to specific sequences in the genome to initiate many important biological
functions. Accurate prediction of such target sequences, often represented by position
weight matrices (PWMs), is an important step to understand many biological processes.
Recent studies have shown that knowledge-based potential functions can be applied on
protein-DNA co-crystallized structures to generate PWMs that are considerably
consistent with experimental data. However, this success has not been extended to
DNA-binding proteins lacking co-crystallized structures. This study aims at
investigating the possibility of predicting the DNA sequences bound by DNA-binding
proteins from the proteins’ unbound structures (structures of the unbound state). Given
an unbound structure of the query protein, the proposed method first aligns this
structure to all the template structures to generate synthetic protein-DNA complexes.
Then it builds a classifier using support vector machines (SVM) to select the most
appropriate complex for PWM prediction. The feature set incorporated in the
predicting model includes the similarities between the query and template proteins,
structural composition such as percentage of alpha-helix, and the number of residues
falling within specific distances between the protein and DNA in the synthetic
iv
protein-DNA complex. Once the appropriate complex is available, an atomic-level
knowledge-based potential function is employed to predict PWMs characterizing the
sequences to which the query protein can bind. The evaluation of the proposed method
is based on 19 DNA-binding proteins which have structures of both DNA-bound and
unbound forms for prediction as well as annotated PWMs for validation. Based on the
analyses conducted in this study, the conformational change of proteins upon binding
DNA was shown to be the key factor that influences the prediction accuracy the most.
Moreover, to facilitate the procedure of predicting PWMs based on protein-DNA
complexes or even structures of the unbound state, the web server, DBD2BS, is
presented. The DBD2BS server provides users with an easy-to-use interface for
visualizing the PWMs predicted based on different templates and the spatial
relationships of the query protein, the DBDs and the DNAs. This study sheds light on
the challenge of predicting the target DNA sequences of a protein lacking
co-crystallized structures, which encourages more efforts on the structure
alignment-based approaches in addition to docking- and homology modeling-based
approaches for generating synthetic complexes.
Key word: DNA-binding proteins, transcription factor, protein-DNA binding profiles,
knowledge-based potential function and support vector machines
v
Table of Contents
中文摘要 ...i
Abstract ... iii
Table of Contents ... v
List of Tables ... vi
List of Figures ... vii
Chapter 1. Introduction ... 1
1.1 Motivation ... 1
1.2 Framework of the study ... 3
1.3 Web server - DBD2BS ... 5
Chapter 2. Literature review ... 7
2.1 Protein structure ... 7
2.2 Binding specificity prediction ... 10
Chapter 3. Methods ... 14
3.1 Constructing templates ... 15
3.2 Constructing superimposed complexes ... 16
3.3 Building SVM model ... 17
3.4 The potential function for PWM prediction ... 19
3.5 Validation Set ... 22
3.6 Evaluating PWM prediction ... 24
Chapter 4. Results ... 25
4.1 Evaluating PWM prediction ... 25
4.2 Evaluating robustness of the proposed method ... 37
4.3 Using a SVM model and DBD2BS to improve PWM prediction ... 44
4.4 Comparison with predictions based on complexes generated by docking ... 48
4.5 Discussion ... 54
Chapter 5. Web server ... 62
5.1 Web interface ... 62
5.2 Case study - CRP_ECOLI ... 68
5.3 Case study - Foxk1 ... 72
Chapter 6. Conclusion and suggestion for future direction ... 79
6.1 Conclusion ... 79
6.2 Suggestion for future direction ... 80
References ... 82
vi
List of Tables
Table 1 13 complexes used for tuning the parameters of the all-atom model ... 22 Table 2 The validation set used in this study. ... 23 Table 3 The PDB entries used in this study. ... 29 Table 4 Predictions using unbound structures compared with those using native
complexes. ... 32 Table 5 Performance on identical protein using different native complexes. ... 38 Table 6 The three synthetic complexes employed in the analysis of structure variations ... 38 Table 7 Structure transitions upon DNA-binding. ... 43
vii
List of Figures
Figure 1 The procedure of TFmodeller ... 8
Figure 2 The workflow of the proposed method. ... 15
Figure 3 SVM Model Features ... 18
Figure 4 Predictions by the proposed method on the 14 test cases. ... 28
Figure 5 PWM Predictions on 19 Cases ... 36
Figure 6 Predictions using different complexes. ... 41
Figure 7 PWM Predictions on 19 Cases ... 47
Figure 8 Comparison with predictions of using docking to construct synthetic complexes. ... 52
Figure 9 An example where templates with low structure similarity were selected. ... 58
Figure 10 An example where DBD2BS decides the final PWM prediction. ... 59
Figure 11 Demonstration of base substitution. ... 61
Figure 12 Prediction procedure workflow incorporated in DBD2BS. ... 64
Figure 13 Screenshots of DBD2BS results. ... 66
Figure 14 Case study using the Catabolite gene activator of Escherichia coli. ... 71
Figure 15 Snapshot of the template select page. ... 74
Figure 16 Snapshot of the result page. ... 75
Figure 17 Snapshot of the comparison page. ... 78
Figure 18 Alignment of the annotated and predicted consensus by DBD2BS for the mouse Forkhead box protein K1 (Foxk1). ... 78
Figure 19 The workflow of PWM prediction from protein sequence ... 81
1
Chapter 1. Introduction
1.1 Motivation
DNA-binding proteins are important to many biological processes in organisms. For
example, transcription factors (TFs) activate or repress gene expression by using their
DNA-binding domains (DBDs) to recognize specific nucleotide sequences in the
genome. DNA sequences that can be recognized by the same DBD are usually
characterized by a probabilistic model, called position weight matrix (PWM), to
accommodate the variability of the TF-binding sequences. Specifically, with the profile
representation of TF binding sites (TFBSs), researchers can discover novel target genes
regulated by known TFs. Therefore, accurate prediction of such target DNA sequences
for DNA-binding proteins is an important step to understanding many biological
processes [1-3].
The most widely used technique for PWM inference of a TF is to collect a set of
promoter sequences that comprise of genes known to be regulated by a particular TF
and then detect frequently observed (over-represented) subsequences from the
collection [4-8]. Such a method requires a sufficient number of sequences for pattern
discovery and is currently available only for a small number of DNA-binding proteins.
2
Similarly, the most promising technique currently for discovering TF binding sites,
ChIP-seq [9], also has the potential limitation of requiring an antibody for the TF. An
alternative approach to predicting PWMs is based on analysis of protein-DNA complex
structures, which has been shown to perform well in determining which positions in a
PWM should be more conserved and not allowed to degenerate [10-12]. In this study
we focus on the structure-based approaches to complement predictions from
sequence-based approaches. The latter approaches provide relatively limited
information about how a DNA-binding protein binds to DNA. For example, when the
interaction involves multiple proteins, sequence-based approaches cannot tell how
many DBDs are required to interact with a binding site.
Though the knowledge-based potential functions [10, 12] (see Chapter 2) perform well
on native complexes in predicting target DNA sequences, this success has not been
extended to DNA-binding proteins lacking co-crystallized structures. In the 30 July
2011 release of Protein Data Bank (PDB) [13], only 403 out of about 1300
DNA-binding proteins have protein-DNA co-crystallized structures. This reveals an
immediate need to develop PWM predictors for unbound protein structures. Such a
predictor requires constructing a putative protein-DNA complex for the given unbound
protein structure before PWM prediction. For this purpose, protein-DNA docking is
3
one of the feasible ways to generate protein-DNA complexes but suffers high
computational cost [14, 15]. To overcome this disadvantage, Gao and Skolnick
recently employed an efficient way of generating protein-DNA complexes by structure
alignment [16]. This structure alignment-based technique is adopted in this study to
generate protein-DNA complexes which are then used to predict PWMs. Another
technique that can be considered for generating putative protein-DNA complexes is
homology modeling, which requires only the sequence of the query protein [11].
Inferring target DNA sequences directly from protein sequence is much more
challenging and beyond the scope of this work.
1.2 Framework of the study
This work proposes a framework of PWM prediction based on unbound protein
structures and investigates its feasibility and challenges. Given a query protein
structure and a template complex, the proposed method conducts structure alignment to
generate superimposed protein-DNA complexes. Based on the protein-DNA complex,
an atomic-level knowledge-based potential function is employed to predict PWMs to
which the query protein can bind. The work compiled a benchmark of seven
DNA-binding proteins which have annotated PWMs and structures of both
DNA-bound and unbound forms. Considering both forms is for the purpose of
4
comparing the performance of the potential function applied on the native and
synthetic complexes. The experimental results show that although the performance of
the synthetic complexes generated by the proposed framework is worse than native
complexes, it is better than those based on homologous complexes. Potential reasons
behind the performance difference between our synthetic complexes and the native
ones were further investigated by progressively adjusting the quality of synthetic
complexes toward conditions that mimic native complexes.
It was observed that for some instances, the best PWM prediction was generated by a
template protein structure with a low TM-score [17]. For example, the TM-score
between two alpha-helices are noticeably higher than for that between other protein
structural elements such as beta-sheets and coils. However, the superimposed
protein-DNA complex generated by this template did not perform well. For this reason,
other features were incorporated to build a model for selecting the most appropriate
structure template. The model is based on using a support vector machine (SVM) [18]
adapted to perform regression based on the following features: (i) similarity between
the query and template proteins; (ii) the proportion of different structural protein
elements of query and template proteins as calculated by DSSP [19]; and (iii) the
numbers of residues between proteins and DNA into superimposed complex within a
5
specified distance. The top four superimposed complexes suggested by SVM were
selected as candidate superimposed.
In this study, the synthetic complexes selected using the SVM approach are compared
with those based on protein-DNA docking. The results show that the proposed
framework was comparable to that based on docking and is much more efficient.
1.3 Web server - DBD2BS
By providing an automatic and integrated platform for these procedures, this web
server helps researchers analyze protein-DNA interactions. A list of 1,066 DBD-DNA
complexes (including 1,813 protein chains) is compiled for use as the template
database. For a given DBD-DNA complex, the DBD2BS employs an atom-level
knowledge-based potential function to infer PWMs. For protein structures without
existing co-crystallized complexes, the DBD2BS conducts structure alignment to
synthesize the bound state of the query structure and then performs PWM prediction
based on the synthetic DBD-DNA complexes. The DBD2BS also provides users with
an easy-to-use interface for visualizing the PWMs predicted based on different
templates and the spatial relationships of the query protein, the DBDs and the DNA.
The kernel of the proposed method, which makes predictions based on a given pair of
6
an unbound structures (query) and a user-specified complex (template), is released
along with this study as a Linux executable
(http://mbi.ee.ncku.edu.tw/res/Chen_2011/).
7
Chapter 2. Literature review
To generate a superimposed protein-DNA complex, it is required to first synthesize a
superimposed structure for the query protein and the template DNA. In previous
studies, there are three widely used approaches for this purpose: homology modeling
(section 2.1.1), structure alignment (section 2.1.2) and protein-DNA docking (section
2.1.3). Once a superimposed protein-DNA complex is available, a potential function is
required for PWM prediction. In this regard, existing potential functions for predicting
protein-DNA interactions, roughly categorized as physics-based and knowledge-based,
are reviewed in section 2.2.
2.1 Protein structure
2.1.1 Homology modeling
Homology modeling refers to the construction of an atomic-resolution model of a
"target" protein using “template” proteins with a similar amino acid sequence, where
template proteins have experimentally determined three-dimensional structures. This
approach relies on the identification of one or more known protein structures likely to
resemble the structure of the target sequence and on the production of an alignment
that maps residues in the target sequence to residues in the template sequence.
8
TFmodeller [20] is a web server based on the concept of homology modeling to
construct models of protein-DNA complexes. The inputs of this server are a protein
sequence and an optional protein structure, the server then scans its database and
generates protein-DNA complex models. The procedure for TFmodeller is shown in
Figure 1.
Figure 1 The procedure of TFmodeller
2.1.2 Structure Alignment
DBD-Hunter [16] uses structural alignment tool, TM-align, to fine the similar protein
structures. Given a target structure, DBD-Hunter first scans against a template library for similar protein structures. For templates with a TM-score>0.55, the target protein and the template DNA are used as a protein complex for PWM prediction.
The TM-score is a measure of similarity between two protein structures. Its range is in
the interval [0,1], where 1 indicates a perfect match between two structures. The
TM-score is designed to be independent of protein lengths and is defined as
9
] ) ) ( (
1
1 max[ 1
score -
TM
2
arg 0
arg
=
aligned+
L
i
et t et i
t
L d
L d
,where Ltarget and Laligned are the lengths of the target protein and the aligned region
respectively, di is the distance between the ith pair of residues. The term d0(Ltarget) is a
distance scale that normalizes distances and is defined as
8 . 1 15 24
. 1 )
(
arg 3 arg0
L
t et= L
t et− −
d
.If the TM-score between two structures is higher than 0.5 then they have roughly the
same fold [21]. One study [22] shows that a TM-score of 0.5 between two structures
has a posterior probability of 37% for being in the same CATH Topology family and
13% for being in the same SCOP Fold family. In addition, when the TM-score is 0.6,
the probability increases to 80% for being in the same CATH Topology family and
similarly, a TM-score of 0.7 increases the probability to 90% for being in the same
SCOP Fold family.
TM-align is a structure alignment tool that combines the TM-score rotation matrix with
dynamic programming. The inputs of TM-align are two protein structures files and its
output is a file containing the rotation matrix and structure alignment.
10
2.1.2 Protein-DNA docking
Macromolecular docking [23-25] is the computational modeling of the quaternary
structure complex formed by two or more interacting biological macromolecules.
Docking itself only produces plausible candidate structures. These candidates must
then be ranked using methods such as scoring functions to identify structures that are
most likely to occur in nature.
Z-DOCK [25] is a rigid-body docking algorithm. Its inputs consist of a protein
structure and a DNA structure. Z-DOCK then generates more than 1000 protein-DNA
complexes with scores based on the algorithm’s scoring functions. The scoring
function includes pairwise shape complementarity, desolvation and electrostatics.
2.2 Binding specificity prediction
Given a protein-DNA complex, the binding specificities of any DNA sequence to the
proteins of the complex can be estimated by threading DNA sequences with a potential
function. DNA sequences with high binding specificities are then summarized as a
PWM. Existing potential functions of protein-DNA interactions are roughly
categorized as physics-based [26, 27] and knowledge-based [12, 28-30].
Physics-based potential functions focus on empirical energy components from physics,
11
including electrostatics, hydrogen-bond, and van der Waals force [31-34]. These
potential functions have been applied to many important problems such as
protein-DNA threading, docking decoy discrimination, and PWM prediction.
Knowledge-based potential functions on the other hand, adopt statistical components,
such as the number of contacts and the distance distribution between the contacts,
derived from known protein-DNA complexes. For PWM inference, knowledge-based
potential functions have been shown to achieve similar prediction accuracy while
requiring much lower computational cost when compared to physics-based ones [12].
The contacts can be defined at the residue level [16, 28] or atomic level [12, 29].
Residue-level knowledge-based potential functions have the advantage of requiring
fewer protein-DNA structures to build the knowledgebase and processing less data
when making predictions. However, they lose prediction accuracy due to ignoring
atomic-level structure variations. As the number of protein-DNA complexes has
increased quickly in recent years, it is possible to construct atomic-level
knowledge-based potential functions with sufficient sampling records. In 2005, Chang
et al. proposed a potential function using 19 atom types [29], and in 2009, Xu et al.
extended the set of atom types to 167 atom types for amino acids and 82 atom types for
nucleotides [12] .
12
FIRE [12] is a succinct knowledge-based potential function that considers interactions
between all atom types. Different knowledge-based potential functions adopt different
reference states. Here, a reference point was used to calculate the potentials under
different conditions in the binding of different target sequences. The reference state
used in FIRE and in this proposal is an averaged reference state based on a collection
of protein-DNA complexes representing the knowledge base. Among the series of
all-atom scoring functions presented in [12], FIRE has the advantage of easy
implementation and has shown to be generally as good as two of its extended functions,
cFIRE and vcFIRE, in predicting PWMs.
A contact model [10, 11] uses the number of atomic contacts between protein side
chains and DNA bases to predict the binding probability. The probability of the base
pair type α in the PWM column i is calculated as follows:
( )
( )
=
>
≤ +
≠
>
≤
= −
) w.t.
( if
1 , if
/ 3 1
);
w.t.
( if
0 , if
/ 1
max max
4 max 1
max max
4 max 1
α
α N N N N N N α
N N N
N N
pi N ,
where N is the observed number of atomic contacts (a heavy atom pair from the protein
and DNA is defined to be in contact if they are closer than 4.5Å), ‘w.t.’ denotes the
base type observed in position i in the complex, and Nmax is a free parameter that was
set to 20. This model has been shown to be generally as good as a static model using a
physics-based potential function when a native protein-DNA complex is considered
13
and has the advantage of a much lower computational cost.
14
Chapter 3. Methods
This study proposes a framework of PWM prediction based on unbound protein
structures and investigates its feasibility and challenges. Given a query protein
structure and a template complex, the proposed method conducts structure alignment to
generate superimposed protein-DNA complexes. Based on the protein-DNA complex,
an atomic-level knowledge-based potential function is employed to predict PWMs to
which the query protein can bind.
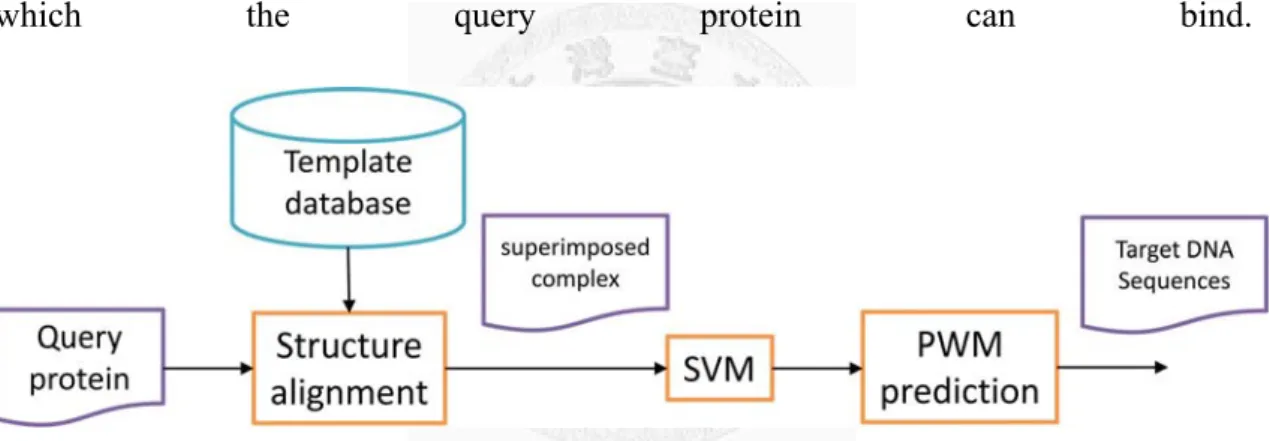
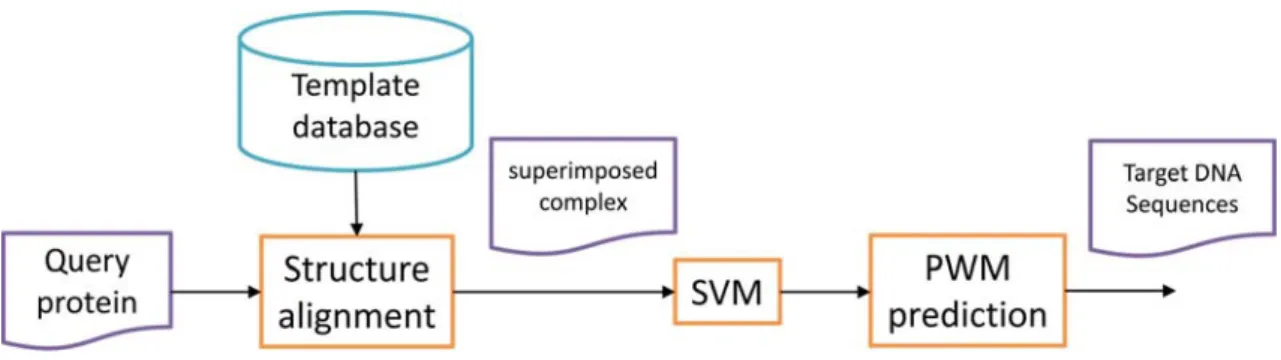
Figure 2 shows the workflow of the proposed method. Given an unbound query protein
and a template structure selected by the SVM model, the proposed method generates a
synthetic protein-DNA complex structure for PWM prediction using structure
alignment, where the query protein is superimposed onto the template structure
(‘Superimposed Complex’ in
15
Figure 2). This is achieved by applying the rotation matrix reported by the TM-align
[21]. PWM prediction is then performed on the superimposed protein-DNA complex
based on an all-atom model, which is a knowledge-based potential function
considering atomic contacts. See the section 3.2 for the details of constructing the
superimposed complex based on the given query and template structures and section
3.4 for the employed all-atom model.
Figure 2 The workflow of the proposed method.
The query protein is superimposed onto the specified template structure and then the PWM prediction is performed on the superimposed protein-DNA complex based on a knowledge-based potential function considering atomic contacts.
3.1 Constructing templates
The set of templates were collected from protein–DNA complex in the PDB [13]. A
complex is viable as a template if (i) the protein is a transcription factor, (ii) it is an
16
X-ray structure with resolution better than 3.0 Å, (iii) it contains exactly one
double-strand DNA, (iv) the DNA molecule has six or more paired bases and has
<30% non-paired bases, (v) at least one protein chain has five or more contact residues
(residues within 4.5 Å) to the DNA molecule and (vi) at least one protein chain has ≥
40 residues. Based on the PDB release on November 30, 2012, a template collection of
263 protein–DNA complexes containing 461 protein chains was constructed.
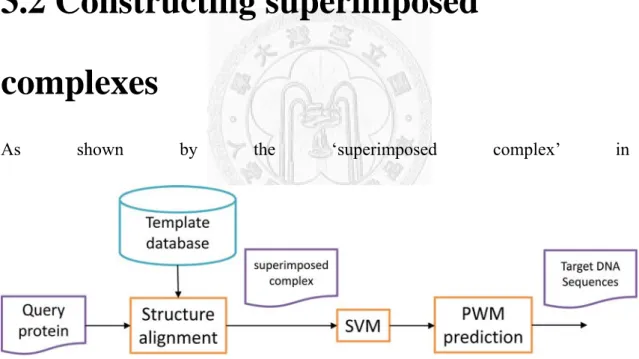
3.2 Constructing superimposed complexes
As shown by the ‘superimposed complex’ in
Figure 2, the query protein is superimposed onto the template structure. This is
achieved by applying the rotation matrix reported by TM-align. We removed the
original protein chains in the template and appended the transformed coordinates of the
query structure into the template structure to generate a superimposed complex for
PWM prediction
17
3.3 Building SVM model
For each query protein, a machine learning algorithm, SVM adapted to perform
regression, was utilized to select the appropriate superimposed structure for PWM
prediction requiring a target number and features for each instance. In this study, each
query-template pair was used as an instance of the SVM model. The p-value described
in ‘evaluation’ is the target number of this instance with the process as follows: (i) The
query protein is superimposed onto the template structure; (ii) the original protein
chain in the template is removed and the transformed coordinates of the query protein
are appended into the template structure to generate a synthetic complex for PWM
prediction; (iii) a potential function is used to predict the PWM from which we
calculate the Ψ-score and p-value (see section ’evaluation’).
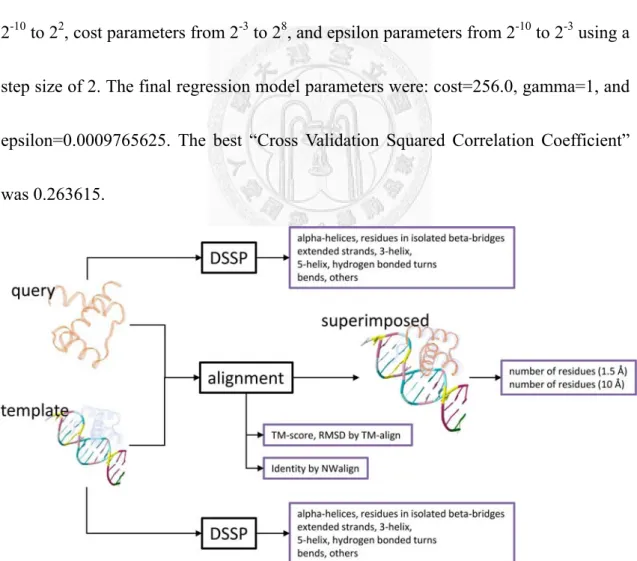
The features of this instance were separated into four parts: (i) similarities between
query protein and template protein, as described by TM-score and RMSD as well as
identity by NWalign [35]; (ii) the composition of the query/template protein structure
generated by DSSP, where composition describes alpha-helices, residues in isolated
beta-bridges, extended strands, 3-helix, 5-helix, hydrogen bonded turns, bends and
18
others (you should give the complete list); (iii) the number of conflicting residues,
defined as a protein residue with at least one heavy atom within 1.5 Å to any heavy
atom of the DNA; and (iv) the number of protein residues with at least one heavy atom
within 10 Å to any heavy atom of the DNA. According to the above criterion, there are
21 features in total (see Figure 3)
The SVM parameters were tuned with 5-fold cross validation, gamma parameters from
2-10 to 22, cost parameters from 2-3 to 28, and epsilon parameters from 2-10 to 2-3 using a
step size of 2. The final regression model parameters were: cost=256.0, gamma=1, and
epsilon=0.0009765625. The best “Cross Validation Squared Correlation Coefficient”
was 0.263615.
Figure 3 SVM Model Features
The 21 features incorporated in the SVM model consists of 2 structure alignment scores, 2 thresholds for contact residue counts, and multiple protein structure
19
composition descriptors for both the query and template protein.
3.4 The potential function for PWM prediction
The objective of this study is to replace the protein structure in native complex
structures with the query protein structure. A scoring function that takes the amino acid
types into consideration is desired. We implemented a variation of the FIRE potential
function, named as ‘all-atom model’ in the context, described by [12] for this purpose.
To construct the knowledgebase, we first denote the number of pairs of atom types i
and j with the distance falling within a specified range (r−Δr, r] as Nobs(i, j, r), where r
= 3, 4, 5, 6, 7, 8, 9, and 10 (Angstrom), and Δr is set as 3 for r = 3 and 1 for the rest of
the values of r. In this study, the number of pairs of atom types i and j with the distance
falling within a specified range, Nobs(i, j, r), are calculated based on the protein-DNA
complex structures collected from PDB. With Nobs(i, j, r) of all the combinations, the
potential between atom types i and j is represented as follows:
≥
<
= −
cut cut )
( ) , , (
, 0
, ) ln
, ,
( ref
r r
r r r RT
j i
u P r
r j i P
FIRE ,
20
where P(i, j, r) = Nobs(i, j, r)/ΣrNobs(i, j, r), Pref(r) = rαΔr/ΣrrαΔr, rcut = 10Å, and α is set
as 1.61 as suggested in [12]. In the proposed method, we further improve the
performance of the FIRE function by employing a distance-dependent weighting
scheme to emphasize the influence from long-distance contacts. That is, P(i, j,r)=
w(r)×Nobs(i, j, r)/ΣrNobs(i, j, r). For a given complex, the binding free energy, ΔG, is
defined as the sum of all the potentials of the observed atom pairs [10]:
= Δ
j i
FIRE i j r u
G
,
) , ,
( . (1)
Assume that influences on binding free energy from different positions are independent,
and thus ΔG can be represented as follows:
Δ
= Δ i
Gi
G α , (2)
where Δ is the binding free energy of a base Gαi α (A, T, C, or G) at position i. By
combining Eq. (1) and (2), we can estimate the probabilities in each column of PWMs
as follows:
21
( )
( )
= − Δ
Δ
= −
G or C, T, A,
exp exp
b
bi i i
G p G
β
β α
α ,
where β is a free parameter. The value of β was set as 15 in this study. It was chosen
according to the performance of the proposed method on the 13 cases in Table 1 that
were not included in the validation set.
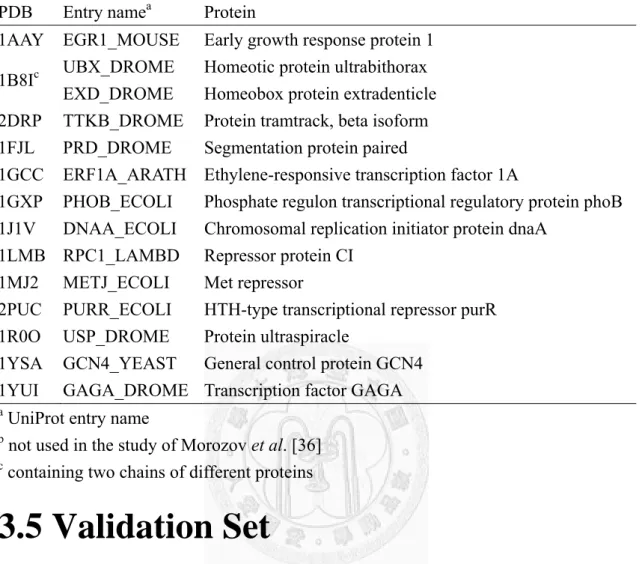
22
Table 1 13 complexes used for tuning the parameters of the all-atom model PDB Entry namea Protein
1AAY EGR1_MOUSE Early growth response protein 1 1B8Ic UBX_DROME
EXD_DROME
Homeotic protein ultrabithorax Homeobox protein extradenticle 2DRP TTKB_DROME Protein tramtrack, beta isoform 1FJL PRD_DROME Segmentation protein paired
1GCC ERF1A_ARATH Ethylene-responsive transcription factor 1A
1GXP PHOB_ECOLI Phosphate regulon transcriptional regulatory protein phoB 1J1V DNAA_ECOLI Chromosomal replication initiator protein dnaA
1LMB RPC1_LAMBD Repressor protein CI 1MJ2 METJ_ECOLI Met repressor
2PUC PURR_ECOLI HTH-type transcriptional repressor purR 1R0O USP_DROME Protein ultraspiracle
1YSA GCN4_YEAST General control protein GCN4 1YUI GAGA_DROME Transcription factor GAGA
a UniProt entry name
b not used in the study of Morozov et al. [36]
c containing two chains of different proteins
3.5 Validation Set
To evaluate the performance of the proposed framework, annotated PWMs were
collected from a study by Morozov et al. [10], TRANSFAC database [32], and
UniProbe database [37]. These databases contain 436 PWM profiles for transcription
factors as annotation profiles. From the 436 transcription factors, those which had an
unbound X-ray structure with resolution better than 3.0 Å in the PDB and contained at
least one protein chain with at least 40 residues were retained. The HomoClust [38]
hierarchical clustering algorithm applied to pair-wise structure similarities reported by
23
TM-align was used to remove redundant protein structures. The parameters for
HomoClust were min-score=0, Sim-up-th=0.9, Sim-down-th=0.8, Minimum cluster
size=5, with the remainder being default. This process resulted in 57 proteins, where
38 proteins were used as the training dataset and 19 proteins (14 proteins have bound
structures in PDB database) used as the testing dataset. (Table 2).
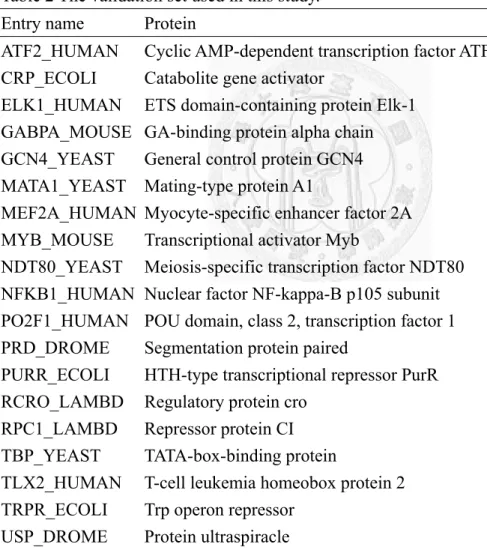
Table 2 The validation set used in this study.
Entry name Protein
ATF2_HUMAN Cyclic AMP-dependent transcription factor ATF-2 CRP_ECOLI Catabolite gene activator
ELK1_HUMAN ETS domain-containing protein Elk-1 GABPA_MOUSE GA-binding protein alpha chain GCN4_YEAST General control protein GCN4 MATA1_YEAST Mating-type protein A1
MEF2A_HUMAN Myocyte-specific enhancer factor 2A MYB_MOUSE Transcriptional activator Myb
NDT80_YEAST Meiosis-specific transcription factor NDT80 NFKB1_HUMAN Nuclear factor NF-kappa-B p105 subunit
PO2F1_HUMAN POU domain, class 2, transcription factor 1 PRD_DROME Segmentation protein paired PURR_ECOLI HTH-type transcriptional repressor PurR RCRO_LAMBD Regulatory protein cro
RPC1_LAMBD Repressor protein CI TBP_YEAST TATA-box-binding protein TLX2_HUMAN T-cell leukemia homeobox protein 2 TRPR_ECOLI Trp operon repressor
USP_DROME Protein ultraspiracle
24
3.6 Evaluating PWM prediction
In this study, the Ψ-score used in [10] and the similarity score was employed to
evaluate the performance of the proposed method. The definition of the Ψ-score is
provided as follows:
=
= = L
j i ACGT p
j q
i j
i ij
L q q p
1 { , , , }
1 ln ) ,
ψ( ,
where p and ij q are predicted and annotated weight scores, respectively, for base ij
type i at position j, and L is the length of the binding site in base pairs. A smaller
number on the Ψ-score implies a higher degree of consistency between two PWMs. To
measure the significance of a Ψ-score, 100,000 dummy PWMs with the same length as
the predicted PWM were randomly generated to estimate the null distribution of
Ψ-scores to the annotated PWM and the p-value of the Ψ-score of the predicted.
25
Chapter 4. Results
4.1 Evaluating PWM prediction
The detailed predictions on the 14 test proteins using their unbound structures are
provided in Figure 4 (denoted as ‘Unbound’) in comparison with the annotated PWMs
provided by [10] (denoted as ‘Annotated’) and the predicted PWMs based on their
native complexes (denoted as ‘Native’). The involved PDB entries are listed in Table 3.
In this study, the Ψ-score used in [10] was employed to evaluate the performance of
the proposed method. Ψ-score is the average of the Kullback-Leibler divergences
across all positions, and was adopted to evaluate the consistency between the predicted
and annotated weight scores for all base types. The ‘Unbound’ achieved 0.45 Ψ-score
in average, which was worse than that (0.33 Ψ-score) based on the native complexes.
Even though the average Ψ-score of using unbound structures is worse than that of
using native complexes, the difference is not significant (the p-value of paired
Wilcoxon signed-rank test [39] is 0.078).
26
27
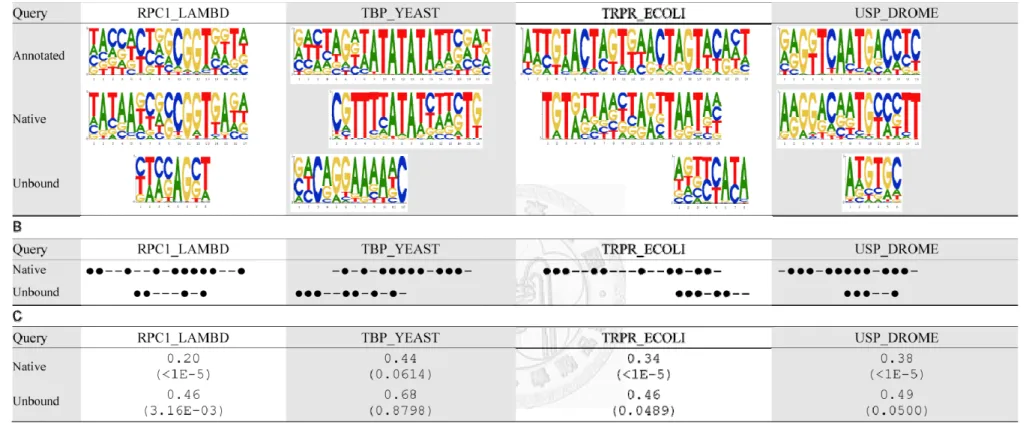
28
Figure 4 Predictions by the proposed method on the 14 test cases.
The predictions of the proposed method are denoted as ‘Unbound’, in comparison with the annotated PWMs (‘Annotated’) and the predicted PWMs based on native complexes (‘Native’). (A) PWMs. (B) A position is marked as ‘●’ if its most favorable base type was correctly predicted, or marked as ‘−’ otherwise. (C) Ψ-scores and the corresponding p-values. The value within the parentheses of the first column indicates the average Ψ-score.
29
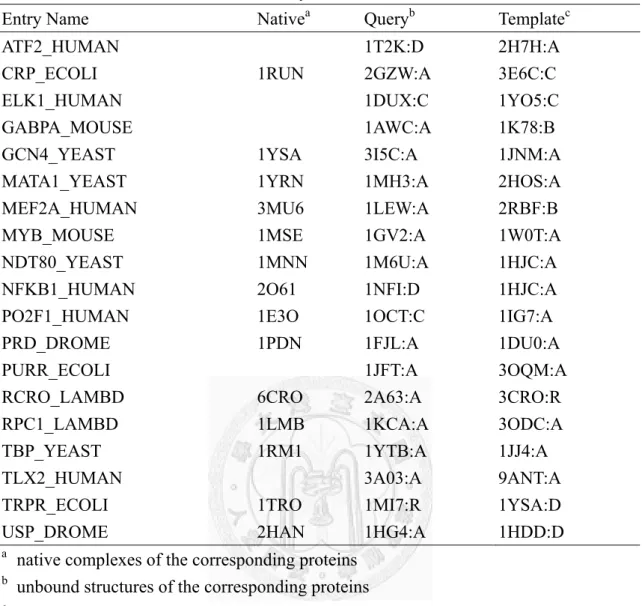
Table 3 The PDB entries used in this study.
Entry Name Nativea Queryb Templatec
ATF2_HUMAN 1T2K:D 2H7H:A
CRP_ECOLI 1RUN 2GZW:A 3E6C:C
ELK1_HUMAN 1DUX:C 1YO5:C
GABPA_MOUSE 1AWC:A 1K78:B
GCN4_YEAST 1YSA 3I5C:A 1JNM:A
MATA1_YEAST 1YRN 1MH3:A 2HOS:A
MEF2A_HUMAN 3MU6 1LEW:A 2RBF:B
MYB_MOUSE 1MSE 1GV2:A 1W0T:A
NDT80_YEAST 1MNN 1M6U:A 1HJC:A
NFKB1_HUMAN 2O61 1NFI:D 1HJC:A
PO2F1_HUMAN 1E3O 1OCT:C 1IG7:A
PRD_DROME 1PDN 1FJL:A 1DU0:A
PURR_ECOLI 1JFT:A 3OQM:A
RCRO_LAMBD 6CRO 2A63:A 3CRO:R
RPC1_LAMBD 1LMB 1KCA:A 3ODC:A
TBP_YEAST 1RM1 1YTB:A 1JJ4:A
TLX2_HUMAN 3A03:A 9ANT:A
TRPR_ECOLI 1TRO 1MI7:R 1YSA:D
USP_DROME 2HAN 1HG4:A 1HDD:D
a native complexes of the corresponding proteins
b unbound structures of the corresponding proteins
c native complexes of different proteins used as the templates
It is observed in Figure 4 that the widths of the predicted PWMs are usually shorter
than the annotated ones. This is because that the proposed method can only infer the
target DNA sequences physically contactable by the query protein in the superimposed
complexes. Protein-DNA interactions sometimes require multiple protein chains to
participate in. Since the query unbound structure is simply one of them, the predicted
PWM might be shorter than i) that based on native complexes which contain the
30
complete set of protein chains and ii) the annotated PWMs derived from experiments
or conserved promoter sequences.
We also compared the predictions on the six test cases from [10] to those of applying
different potential functions [10, 12] on native complexes (Table 4). Table 4 shows
that the predictions of using native complexes generally outperforms that of using
synthetic complexes constructed based on the unbound structures and the selected
templates. The results shown in Table 4 and Figure 4 both reveal the potential of
conducting PWM prediction for DNA-binding proteins based on unbound structures,
though the accuracy degrades when synthetic complexes were used instead of native
complexes. It is reasonably speculated that the performance difference was due to
structure variations between the native complexes and the synthetic complexes
generated by structure alignment followed by superposition. The next subsection lists
three types of structure variations that presumably influence the prediction accuracy
and provides further analyses to investigate these structure variations. The first
considers the variation on binding position or orientation caused by structure alignment.
In other words, the complexes generated by structure alignment might have structure
variations deviated from crystallized complexes. The second one is the structure
variation due to sequence difference. That is, the binding position or orientation might
31
have variations on two different protein sequences, even though their structures are
similar. The third structure variation we considered is the conformational change of
proteins from the unbound to bound form.
To evaluate the performance of the proposed potential function, it was compared to the
potential function from 3DTF [40]. 3DTF is a web server that uses a 3D
structure-based energy function to predict the PWM based on a bound structure.
Evaluation was conducted on 19 testing cases, among which include 7 cases from our
previous study (can you refer to previous studies in thesis?). Due to 3DTF needing a
bound structure to predict the PWM, superimposed structures generated by TM-score
selected templates were used as inputs for the 3DTF web server along with default
parameters. Detailed predictions for the 19 test proteins are provided in Figure 5 where
the two potential functions (denoted as ‘Proposed’ and ’3DTF’ respectively), the
annotated PWM (denoted as ‘Annotated’), and predicted PWMs based on the native
complex (denoted as ‘Proposed_N’ and ‘3DTF_N’) are shown. Because there is no
native complex in the PDB for “ATF2_HUMAN”, “ELK1_HUMAN”,
“GABPA_MOUSE”, “PURR_ECOLI”, and “TLX2_HUMAN”, the ‘Proposed_N’ and
‘3DTF_N’ fields for these are not available. It can be seen in Figure 5(C) that 3DTF
cannot perform a prediction on many proteins based on their native complexes as well
32
as the superimposed complex for “TRPR_ECOLI”, whereas the proposed potential
function can provide a prediction. It can be seen in Figure 5(B) shows that ‘Proposed’
correctly predicts more positions than 3DTF. Based on these results, it can be seen that
the proposed potential function is better than 3DTF on this testing dataset.
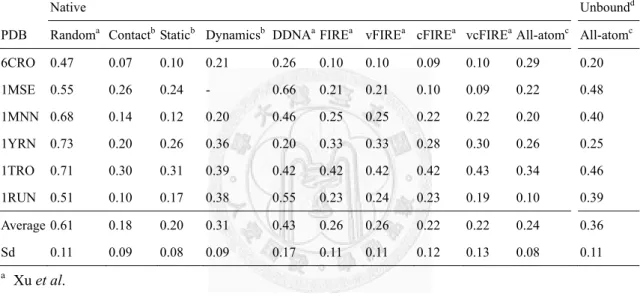
Table 4 Predictions using unbound structures compared with those using native complexes.
Native Unboundd
PDB Randoma Contactb Staticb Dynamicsb DDNAaFIREa vFIREa cFIREa vcFIREa All-atomc All-atomc 6CRO 0.47 0.07 0.10 0.21 0.26 0.10 0.10 0.09 0.10 0.29 0.20 1MSE 0.55 0.26 0.24 - 0.66 0.21 0.21 0.10 0.09 0.22 0.48 1MNN 0.68 0.14 0.12 0.20 0.46 0.25 0.25 0.22 0.22 0.20 0.40 1YRN 0.73 0.20 0.26 0.36 0.20 0.33 0.33 0.28 0.30 0.26 0.25 1TRO 0.71 0.30 0.31 0.39 0.42 0.42 0.42 0.42 0.43 0.34 0.46 1RUN 0.51 0.10 0.17 0.38 0.55 0.23 0.24 0.23 0.19 0.10 0.39 Average 0.61 0.18 0.20 0.31 0.43 0.26 0.26 0.22 0.22 0.24 0.36 Sd 0.11 0.09 0.08 0.09 0.17 0.11 0.11 0.12 0.13 0.08 0.11
a Xu et al.
b Morozov et al.
c our implementation, which is a variation of FIRE
d the unbound structures and the corresponding templates used were listed in Table 3
33
34
35
36
Figure 5 PWM Predictions on 19 Cases
The predictions using the method proposed in this study, denoted as ‘Proposed’, is compared with the annotated PWM (‘Annotated’), predicted PWMs based on the native complex with two potential functions (‘Proposed_N’, ‘3DTF_N’) and predicted PWMs based on superimposed complexes with the 3DTF potential function (‘3DTF’). (A) The predicted PWMs. (B) A position is marked as ‘‧’ if its most favorable base type was correctly predicted and is marked as ‘–’ otherwise. (C) Ψ-scores and the corresponding p-values.
37
4.2 Evaluating robustness of the proposed method
For the first structure variation from the alignment, we want to know if the proposed
method yields stable predictions when the protein structure in a native complex is
replaced by a protein structure from another native complex of the same protein using
structure alignment. Namely, the query protein, which is also a bound structure, is
superimposed to another complex of the same protein. This design aims to eliminate
the influence of the other two structure variations. For this purpose, we grouped
protein-DNA complexes in PDB by the UniProt entry names of the protein chains.
Protein chains in complexes with multiple protein chains were excluded. In the end, we
have 38 PDB chains and 74 query-template pairs over eight entry names, where each
entry name has 4–6 PDB chains. Table 5 shows the results of the analysis regarding the
first structure variation. All the values of Ψ-score are quite small. These results reveal
an important observation that the proposed method is robust to the structure variations
among native complexes of the same protein determined from different experiments as
well as the variations due to structure alignment.
To investigate the second structure variation due to sequence difference, we prepared
the second synthetic complex where the template is a complex of the query protein
38
itself—instead of a complex of a different protein—for each query in the validation set
(Table 6). Figure 6 shows that using this set achieved an average Ψ-score of 0.44,
which is close to that of using a different protein (0.45. The p-value of the paired
Wilcoxon signed-rank test on the Ψ-scores of these two sets (μ and U) is 1. Namely,
there was no apparent improvement observed when we eliminated this type of structure
variation in the prediction framework. This suggests that the all-atom model with the
proposed framework can tolerate the structural differences between different proteins
that share similar structures.
Table 5 Performance on identical protein using different native complexes.
Entry Name Number of chains Number of pairs Ψ-scorea
DN71_SULAC 4 6 0.02±0.01
EGR1_MOUSE 4 6 0.05±0.03
P84131_BACST 4 6 0.08±0.05
POL_MLVMO 4 6 0.01±0.01
DPO1_BACST 5 10 0.00±0.00
UNG_HUMAN 5 10 0.11±0.12
FPG_LACLC 6 15 0.00±0.00
MTH1_HAEHA 6 15 0.04±0.03
Overall 38 74 0.04±0.06
a Mean ± standard variation
Table 6 The three synthetic complexes employed in the analysis of structure variations
Synthetic complex Query protein Template protein Denoted as The first synthetic complex
(the proposed synthetic complex) Unbound Different to the query μ The second synthetic complex Unbound Identical to the query U The third synthetic complex Bound Identical to the query B
39
40
41
Figure 6 Predictions using different complexes.
μ: the proposed method. U: the second synthetic complex that eliminates the second type of structure variation. B: the third synthetic complex that eliminates the second and third types of structure variation. N: native complexes. (A) PWMs. (B) A position is marked as
‘●’ if its most favorable base type was correctly predicted, or marked as ‘−’ otherwise. (C) Ψ-scores and the corresponding p-values. The value within the parentheses of the first column indicates the average Ψ-score.
42
To investigate the third structure variation of the conformational change between
unbound and bound forms, we prepared the third synthetic complex by replacing the
query of the second synthetic complex with a bound structure for each query in the
validation set (Table 6). Using this set achieved Ψ-score of 0.39 (Figure 6). This
performance was better than those using unbound queries and close to those using
native complexes. The performance gap after eliminating this type of structure
variation indicates that the structure variation of the conformational change is the most
critical structure variation to the prediction accuracy. These results reveal that the
proposed framework is more sensitive to the structural changes between unbound and
bound conformations than those between two homologous structures. Hence, if we
want to construct PWMs directly from an unbound structure with higher accuracy, the
first priority of the next step is to overcome the unbound-to-bound conformational
change.
In Table 7, we provided with more details about the structural changes upon
DNA-binding of the seven test cases. Two special structural transitions, transitions of
secondary structures (SSE) and disorder-to-order (D2O) transitions discussed in a
recent study [41], were in particular examined here in addition to the root-mean-square
deviations (RMSDs) between a pair of structures. In this table, we observed that
43
structure variations are not necessarily accompanied with structure transitions. For
example, the used structures for MYB_MOUSE have the largest RMSD (2.88) but
have neither SSE nor D2O transitions. The structures used for NDT80_YEAST have
25 D2O transitions but a small RMSD (0.72). Furthermore, the Ψ-scores seem more
correlated to D2O transitions than RMSD in this table. But this speculation needs to be
confirmed with larger-scale experiments.
Table 7 Structure transitions upon DNA-binding.
Entry name Unbound Bound SSEa D2Ob RMSDc Ψ-score
CRP_ECOLI 2GZW:C 2CGP:A 0 0 0.73 0.30 MATA1_YEAST 1MH3:A 1YRN:A 0 0 0.90 0.33 MYB_MOUSE 1GV2:A 1H89:C 0 0 2.88 0.37 NDT80_YEAST 1MN4:A 2EUX:A 0 25 0.72 0.44 RCRO_LAMBD 2OVG:A 6CRO:A 0 0 0.83 0.43 TRPR_ECOLI 1JHG:A 1TRO:C 0 0 1.02 0.21 NFKB1_HUMAN 1NFI:D 2O6I:B 0 0 0.50 0.69
a SSE : transition of secondary structure
b D2O : disorder-to-order transition
c RMSD : root mean square deviation
44
4.3 Using a SVM model and DBD2BS to improve PWM prediction
To perform PWM prediction, selecting appropriate templates structures for each
unbound protein in the testing dataset to generate synthetic protein-DNA complexes is
required. For this purpose, a SVM model is first built for this protein. After regression,
the target numbers of each template by SVM are obtained and the best four templates
are selected (minimum target numbers) resulting in four predicted PWMs for each
protein. To decide which PWM is the best choice for a protein, DBD2BS (see Chapter
5) was used to compare the four predicted PWMs. This can help in deciding which
positions of a predicted PWM are important and how they are aligned. Using the
information provide by this tool, the PWM can be regenerate from a calculated average
of each aligned PWM to represent the final prediction for this protein. Unfortunately, a
comparison can’t be applied to all cases. For such cases, the best PWM selected by
SVM from among the top four is used as the final prediction for the protein. Detailed
predictions for the 19 test proteins are provided in Figure 7, denoted as ‘SVM’. In the
19 test cases, the precision of 15 cases were successfully improved with an average
Ψ-score of 0.42.
45
46
47
Figure 7 PWM Predictions on 19 Cases
The predictions using the method which incorporates SVM and DBD2BS, denoted as ‘SVM’, and the predictions using an alignment-based approach, denoted as ‘μ:’. (A) The predicted PWMs. (B) A position is marked as ‘‧’ if its most favorable base type was correctly predicted and is marked as ‘–’ otherwise. (C) Ψ-scores and the corresponding p-values.
48
4.4 Comparison with predictions based on complexes generated by docking
The above experiments were designed to evaluate the quality of the synthetic
complexes under the proposed framework. This section however, compares the
prediction performance of using the synthetic complexes obtained by the proposed
framework to that obtained by protein-DNA docking. For the performance comparison,
we use the ZDOCK package (version 2.3.1) to perform protein-DNA docking. The
protein structure was prepared using the query structures and the DNA was prepared
using the bound DNA structures of the best template suggested by the SVM model. In
the proposed framework, a template protein-DNA complex is employed to facilitate the
generation of synthetic complexes. In other words, the DNA-binding residues of the
protein were obtained from an existing protein-DNA complex. For a fair comparison,
the same information was exploited here to rank models generated by ZDOCK. We
assigned the highest score to the synthetic complex that reserved the largest set of
expected contact residues. Complexes reserving the same number of contact residues
retained the same order suggested by ZDOCK. Based on the new scoring strategy, the
top 20 complexes of 2000 (as recommended by the ZDOCK manuscript) ZDOCK
predictions were used to perform PWM prediction. Finally, the predicted PWM with
49
the best Ψ-score to the annotated PWM was reported here. The process of using the
Ψ-score to select PWM (note that it favors ZDOCK) was adopted because we observed
that the highest scoring complexes resulted in extremely bad PWMs, which were
difficult to align to the annotated PWMs in all tests (data not shown).
50
51
52
Figure 8 Comparison with predictions of using docking to construct synthetic complexes.
The predictions based on the proposed alignment-based approach to construct synthetic complexes are denoted as ‘Proposed’, while those of ZDOCK are denoted as ‘Docking’. (A) PWMs. (B) A position is marked as ‘●’ if its most favorable base type was correctly predicted, or marked as ‘−’ otherwise. (C) Ψ-scores and the corresponding p-values. The value within the parentheses of the first column indicates the average Ψ-score.
53
Figure 8 shows the comparison of using the proposed framework (denoted as
‘Proposed’ in Figure 8) and using protein-DNA docking to generate the protein-DNA
complex for PWM prediction. Using the docked complexes achieved an average
Ψ-score of 0.42. We observed that the PWMs generated by the proposed method and
docking have their own advantages in different positions even though the same queries
and templates were used. For example, for the center five positions (‘TGTGA’), which
are more conserved than the flanking positions in the annotated PWM of CRP_ECOLI,
our approach only missed the fourth position. On the other hand, docking predicted the
fourth position but missed the second and the third positions. In the best case for our
approach, RCRO_LAMBD, docking did not predict PWM. On the test case
ATF2_HUMAN, docking correctly predicted the five positions (1 and 5–8) on the right
part while our approach correctly predicted the five positions (2-4 and 7-8) on the left
part of the annotated PWM. In the two other test cases (MATA1_YEAST and
RCRO_LAMBD), the proposed method outperformed docking. In summary, docking
and our approach both made good predictions on four test cases (CRP_ECOLI,
ELK1_HUMAN, MATA1_YEAST and PURR_ECOLI though on different positions.
Both methods performed badly on test cases MYB_MOUSE, PO2F1_HUMAN and
TRPR_ECOLI. Our approach outperformed docking on 9 test cases. Regarding the
efficiency issue, ZDOCK takes more than an hour for the 19 test cases, which is much
54
longer than that of the proposed method based on structure alignment, which took
about 2 seconds.
The complementary phenomenon of docking’s and our approach’s predictions might be
due to the structure variations—mainly from unbound to bound—discussed previously.
The query structures must undergo some conformational change so that they can fit the
DNA molecules well. However, both the proposed framework and the adopted docking
strategy regard the query structures as rigid bodies. It might be that one end of the
binding site of the query structure perfectly fits the DNA but the other end was
‘seesawed’ out of its best position.
4.5 Discussion
It was discussed in the study of Dan et al. [42] that conformational changes were
commonly observed in DNA-binding proteins. To understand how common the
conformational changes are present in protein-DNA interactions and how large the
changes are usually observed, we further collected available structure pairs of unbound
and bound states for DNA-binding proteins from the PDB database. Since a protein
may have multiple unbound-bound structure pairs, we adopted a strict criterion that a
55
protein has transitions if at least one of the associated unbound-bound structure pair
has transitions. The definition of transitions between a structure pair is identical to that
of Dan et al.’s work (the DSSP program was used to assign secondary structures and
only segments in which the same transition was consistent for at least five consecutive
residues were considered). The results show 40.2% of the 132 proteins underwent SSE
transitions (changes on secondary structure) and 53.8% underwent D2O transitions.
The high ratios concur with the points of Dan et al.
On the other hand, it is observed that the RMSD values were not that large, i.e., all
structure pairs were less than 4Å (data not shown). If the criterion ‘RMSD ≤ 2Å’, a
rigorous threshold in general, is considered to indicate small structural variation,
93.2% proteins have at least one structure pair with small structural variation. In Table
7, we found that the ratio of proteins underwent SSE (0.0%) and D2O (14.3%, one
among the seven test cases) transitions were much lower than those of the overall
distribution (40.2% SSE and 53.8% D2O transitions). The most difference between