A Gesture System for Graph Visualization in Virtual Reality Environments
Yi-Jheng Huang1* Takanori Fujiwara2† Yun-Xuan Lin1‡ Wen-Chieh Lin1§ Kwan-Liu Ma2¶
1) National Chiao Tung University, Taiwan, 2) University of California, Davis
ABSTRACT
As virtual reality (VR) hardware technology becomes more mature and affordable, it is timely to develop visualization applications making use of such technology. How to interact with data in an immersive 3D space is both an interesting and challenging problem, demanding more research investigations. In this paper, we present a gesture input system for graph visualization in a stereoscopic 3D space. We compare desktop mouse input with gesture input with bare hands for performing a set of tasks on graphs. Our study results indicate that users are able to effortlessly manipulate and analyze graphs using gesture input. Furthermore, the results also show that using gestures is more efficient when exploring the complicated graph.
Index Terms: H.5.2 [Information Systems]: Information Interfaces and Presentation—User Interfaces;
1 INTRODUCTION
With the advance of VR technologies, the researchers of visualiza- tion have started to render data in a VR environment, including graph visualization. There are several advantages of rendering a graph in the VR environment. For example, stereoscopic displays provide additional depth information, which can assist users in pro- cessing graph visualization tasks [24, 42]. The VR environment also stimulates new demands and possibilities for the interaction design in visualization applications. However, few studies have addressed the interaction design for a graph in the VR environment. Conven- tionally, a mouse or a touch screen is commonly used as an input device on graph visualization. However, such devices do not have enough degrees of freedom (DoFs) for operations on a 3D graph, including selection, translation, and rotation in 3D vision provided through the VR environment. Additionally, unlike visualization on a 2D screen, users cannot see input devices in the VR environment with a head-mounted display (HMD). Hence, input devices that need users’ vision, such as a keyboard and a touch screen, are not appropriate [43].
On the other hand, one of common inputs in the VR environment is gestures, which are intuitive and convenient for interacting with data as people begin using their hands to interact with things since their birth. Also, virtual hands [32] could provide virtually visible input devices in the VR environment. Gestures are an appropriate input for the VR environment. In this study, we develop a gesture interface that allows users to interact with a visualization in the VR environment with bare hands. We focus on graph visualization. The VR-based graph visualization system was built based on Oculus Rift [29] and Leap Motion [22].
To design the gestures, we interviewed several users who have domain knowledge in graph visualization and considered a set of
*e-mail: jennyhuang914@gmail.com
†e-mail: tfujiwara@ucdavis.edu
‡e-mail: librechat2514@gmail.com
§e-mail: wclin@cs.nctu.edu.tw
¶e-mail: ma@cs.ucdavis.edu
operations that are commonly used in graph visualization. One chal- lenge of designing gestures for operations is that the gestures should be easy to learn and perform, and can be precisely recognized in the proposed system. We referred to gestures from previous work [30]
and explored several possible designs. In the end, eight gestures are made in this study. Another challenge of implementing the gesture interface is that detection of hand motion through Leap Motion is unstable from time to time [31]. This may cause discomfort or con- fusion for users. To provide a better user experience, our system processes captured motions to reduce such shakings. This enables us to achieve more stable and smoother motion.
Additionally, we evaluate our gesture input design through a user study, comparing with a mouse in a VR-based graph visualization environment. The results show that participants are able to complete tasks more efficiently for the complicated graph. Our work makes the following contributions: (1) Proposing a prototype of VR-based graph visualization system with gesture control; (2) Assessing the usability of gesture control and mouse control for a set of common operations on graphs.
2 RELATEDWORK
VR environments, such as HMDs and CAVE-style displays [14], provide 3D vision. This advantage has been utilized in visualiza- tions required to convey spatial information [11, 19, 27, 39]. As for information visualization, the VR environment has potential bene- fits derived from using an extra dimension and a (virtually) large screen space. Teyseyre and Campo [36] and Brath [9] provided nice overviews of 3D information visualizations. While most of these existing 3D information visualizations have been applied on 2D displays, several studies focused on evaluating the VR environ- ment [3, 17, 18, 40–42]. Furthermore, after consumer HMD products, such as Oculus Rift [29], became available, information visualiza- tion studies using HMD is being more popular. Kwon et al. [21]
applied a spherical layout, rendering methods including depth rout- ing and LineAO [15], and node highlighting interaction for graph visualization in the VR environment. Their user studies showed their method performs better than traditional 2D graph visualization in the VR environment. Cordeil et al. [13] compared an HMD and a CAVE- style display for collaborative analysis of network connectivity in the VR environment through the user studies. Although the HMD is much less expensive than the CAVE-style display, their conclusion suggested that the HMD can provide a comparable experience for collaborative analysis and users may complete the tasks faster. Even though these existing studies [13, 21] provided effective methods for information visualization with the HMD, they only supported highlighting interactions.
Regarding interactions for 3D objects in a general research area, traditionally a mouse is used for the interactions. However, the mouse has only two DoFs, and thus would not be suitable for inter- acting with objects in 3D environments. 3D interactions that require users to make some gestures in 3D space, e.g., virtual hand [32] and virtual pointing [26], could provide more DoFs. Various 3D interac- tions have been developed and surveyed in the past [4, 7, 20]. One widely spread method is the virtual hand with hand gesture recogni- tions [28, 34]. This method could utilize hand and finger positions, movements, and angles to provide interactions. Recently, Pium- somboon et al. [30] proposed user-defined gestures for augmented 2017 IEEE Pacific Visualization Symposium (PacificVis)
18-21 April, Seoul, Korea
978-1-5090-5738-2/17/$31.00 ©2017 IEEE
reality. These gestures could be applied to VR applications. Hence, we adopt some of them to form the gesture set of our interface. We propose and evaluate these interactions in this paper.
3 DESIGN ANDIMPLEMENTATION OFGESTUREINTERFACE
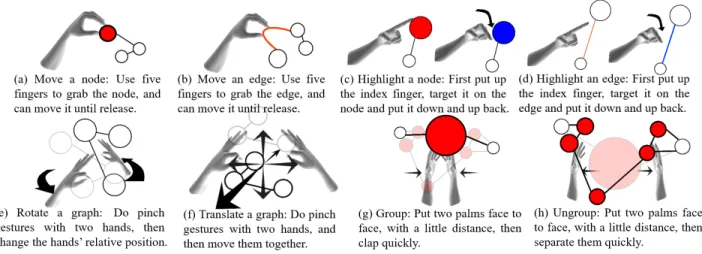
We provide eight operations as illustrated in Figure 1 to allow users to interact with a graph, which are (a) move a node, (b) move a link, (c) highlight a node, (d) highlight a link, (e) rotate a graph, (f) translate a graph, (g) group: merge a group of nodes into a large node, and (h) ungroup: separate the large node back to individual nodes.
The eight operations intend to cover most selection operations used in graph visualization. In this work, we do not cover operations requiring a text entry (e.g., searching and filtering). The designs of the operations are based on the studies by Lee et al. [23] and Roth [35]. Lee et al. [23] defined a list of tasks which are commonly performed in graph visualization. Roth [35] proposed a taxonomy of interaction primitives for visualization.
Our system applies Oculus Rift DK2 [29] as an HMD and Leap Motion [22] as a sensor device to provide an interface for gestures in the VR environment. The VR developer mount [22] is used to mount Leap Motion on Oculus Rift DK2. This mounting position can keep Leap Motion in front of the user’s viewpoint and avoids changes in gesture recognition accuracy that depends on the user’s position relative to Leap Motion.
We design the gestures in Figure 1 with two considerations:
intuitiveness and feasibility. About the intuitiveness, we refer to user-defined gestures proposed by Piumsomboon et al. [30]. They introduced a set of 44 user-defined gestures for selected tasks by summarizing 20 subjects’ opinions. However, some of these gestures require advanced implementations to work effectively. In particular, some gestures cannot be robustly captured by Leap Motion and causes low accuracy of recognition, such as a single select gesture suggested by them. In this paper, six out of eight gestures, (a, b, e-h), are from their work [30]. The design of (c-d) gestures, which aims to make gestures easy to be recognized with an infrared stereo camera, is inspired from the gesture design of Microsoft HoloLens [25].
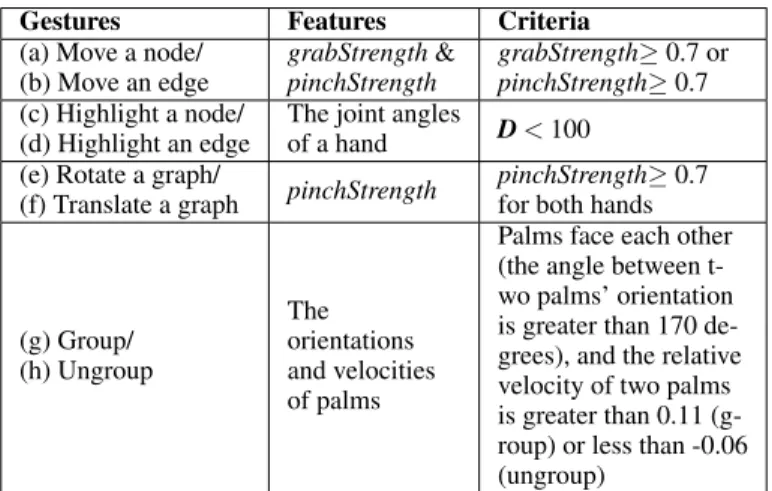
To recognize the gestures in Figure 1 with Leap Motion, we de- velop simple gesture recognition methods in our system for real-time interactions. Table 1 lists the features and criteria used in our gesture recognition methods. We extract these features from the informa- tion provided by Leap Motion Orion SDK and set corresponding thresholds to recognize different gestures. We use grabStrength and pinchStrength that are variables provided by Leap Motion for detecting the gestures of moving a node/link, translating a graph, and rotating a graph. grabStrength indicates how close a hand is to being a fist and pinchStrength represents the holding strength of the pinch pose. The orientations and velocities of palms are used to recognize the gestures of grouping and ungrouping.
To recognize the highlighting gestures, a template pose shown as the left hand in Figure 1(c) is predefined. At run-time, our system will calculate the distance D between the template pose and the current pose, where D = (Q − Qi)TW(Q − Qi) and Q and Qiare column vectors describing the joint angles of the template pose and the current pose, respectively; W is a diagonal matrix that weighs the influence of different joint angles. Weights will be lower if the joints are closer to finger tips. If D is less than a threshold, the system considers that a user is performing a highlighting gesture.
Furthermore, to provide visual feedback and better user experi- ences, the user’s hand motion is smoothed and displayed in the VR environment since the raw hand motion obtained from Leap Motion is inaccurate and sometimes shakes unnaturally [31]. We reduce the shaking by applying a virtual spring (P-controller [8]) at each joint and setting the rest pose as a template pose. We define a template pose for each gesture in the gesture set. Thus, when a user intends to perform a gesture and his/her current pose is close enough to a predefined template pose of a gesture, the displayed hand motion
Table 1: The features and criteria for recognizing each gesture.
Gestures Features Criteria
(a) Move a node/
(b) Move an edge
grabStrength&
pinchStrength
grabStrength≥ 0.7 or pinchStrength≥ 0.7 (c) Highlight a node/
(d) Highlight an edge
The joint angles
of a hand D < 100 (e) Rotate a graph/
(f) Translate a graph pinchStrength pinchStrength≥ 0.7 for both hands
(g) Group/
(h) Ungroup
The orientations and velocities of palms
Palms face each other (the angle between t- wo palms’ orientation is greater than 170 de- grees), and the relative velocity of two palms is greater than 0.11 (g- roup) or less than -0.06 (ungroup)
would be steadily locked to the template pose as the virtual spring will resume the current pose back to the template pose if the original hand motion from Leap Motion has any jerks.
Additionally, we visualize virtual hands [32] in the system by using Leap Motion Orion SDK. The virtual hands allow users to see their input devices (i.e. their hands) in the VR environment even when they use the HMD.
4 USER STUDY
To evaluate the usability of our system, a user study is conducted to compare the users’ performance and experiences about the inter- actions with a mouse and the proposed gestures to carry out vari- ous graph visualization tasks. We choose the comparison with the mouse because it is a selection device commonly used in the graph visualization. The design of the mouse operations is based on 3D vi- sualization systems or 3D commercial software, such as BioLayout Express3D [1], CGV [37], Maya [5], and Unity 3D [38]. Please see the supplemental material for details of the mouse operations.
Experimental Design. We adopted the between-subjects design.
Based on a pre-experiment survey, the participants were divided into two groups with roughly equal capability: a “gesture group”
uses gestures and a “mouse group” uses the mouse as an interface.
Each participant would perform nine tasks on three different graph layouts in the same order, including: (a) a brain graph, (b) a force- directed graph, and (c) a BioLayout graph as shown in Figure 2(a-c).
We chose these graphs with different complexity to observe how it affects the performance of gesture and mouse control. The brain graph, which has 136 nodes and 254 edges, was generated in the existing work [16]. Each node represents a region in the brain and each edge represents a correlation of the functional connectivity between each region. We set a threshold to obtain edges that have high correlations and applied 3D mean-shift edge bundling [6]. To convey anatomical positions of the nodes, each node is set in its 3D spatial position. The force-directed graph with 77 nodes and 254 edges presents character co-occurrence in Les Mis´erables. Related characters are closer while unrelated characters are farther apart. The data was downloaded from [2]. This graph is sparse. The BioLayout graph contains 312 nodes and 2198 edges. We downloaded the data from [1] and used BioLayout Express3D [1] to generate the layout.
The graph is relatively dense and the nodes of a group are gathered together.
We design the nine tasks based on the previous studies [23,33] and suggestions from experts. The tasks are listed in Table 2. Task 1.1 to 1.3 in the brain graph are the operations used by neuroscientists when they are exploring brain data. Task 2.1 to 3.3 are summarized tasks which are usually performed in graph visualization.
Participants. We recruited 14 participants (7 males and 7 fe- males) through the Internet. The age of participants ranged from
Figure 1: The gesture set used in our system.Please see also the accompanying video for an illustration of these gestures.
Table 2: The tasks used in user study.
1. Brain graph
(Task 1.1) Find the names of two marked nodes, and the value of the link connecting them.
(Task 1.2) Find all nodes connected with two marked nodes.
(Task 1.3) Following the previous task, what are the values of the edges between the found nodes and the marked nodes?
2. Force-directed graph
(Task 2.1) Find the nearest node to a marked node.
(Task 2.2) Find all nodes connected with two marked nodes.
(Task 2.3) Find the shortest path between two marked nodes.
3. BioLayout graph
(Task 3.1) Find all nodes connected with two marked nodes.
(Task 3.2) How many nodes in a group colored with yellow?
(Task 3.3) Following the previous task, what are the colors of each of the groups connecting to the yellow group?
19 to 32. Both the gesture and the mouse groups have seven partic- ipants. Eight of them have computer science background, equally distributed in the two groups. The others have backgrounds on en- vironmental engineering, civil engineering, biomedical, chemistry, economics, and early childhood education.
Procedure. The participants were invited to our laboratory, and given a pre-experiment survey concerning the questions about pre- vious knowledge of the VR platforms and computer games. We separated them into the mouse group and the gesture group accord- ing to this survey to make the capability of the two groups similar.
Next, we introduced the experiment and gave a tutorial of the system.
The tutorial began with a video illustrating each operation, and then the participant put on the VR headset and practiced each operation with a simple graph (Figure 2(d)) until s/he felt skilled enough. After practicing, each participant needed to take a test where we asked participants to perform the eight operations in a random order. The participant was required to pass this test to start the experimental tasks. The participant was required to finish the current task be- fore starting the next one. After finishing all tasks, we asked the participants to fill in a questionnaire about their using experiences.
5 RESULTS
We provide the experimental results in four aspects: accuracy, diffi- culty of each operation, completion time and user experience.
Difficulty of Operations. Figure 3 shows the difficulty level of each operation rated by the participants in the questionnaire with a five-point Likert scale (five means the most difficult). Since the variables are ordinal and the distribution of the difficulty level of each operation had heteroscedasticity of variance, we applied the Brunner-Munzel test [10]. Looking at each operation, the Brunner-
(a) Brain graph (b) Force-directed graph
(c) BioLayout graph (d) The graph for practice Figure 2: The graphs provided in the user study.
Munzel test revealed the significant differences in following oper- ations: move a node (p < .009), move an edge (p < .02), rotate a graph (p < .003), and group (p < .02). The gesture was easier to move a node, move an edge, and rotate a graph. Conversely, the mouse was easier for the grouping operation.
Accuracy. We define accuracy rate as the percentage that partic- ipants were able to give the correct answers on their first answer.
Figure 4 shows the result of accuracy rate through all tasks for each graph and of each task. Accuracy rate also did not follow a normal distribution and had heteroscedasticity of variance. Therefore, we used the Brunner-Munzel test. However, there was no significant differences in accuracy rate for each graph and each task.
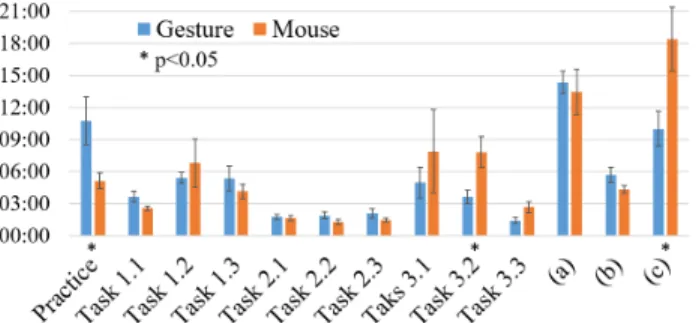
Completion Time. Figure 5 compares the average completion time for the practice, tasks in each graph, and each individual task.
The practice included a tutorial of the system, practice of the system, and a simple test. The completion time also did not follow a normal distribution and had heteroscedasticity of variance. The Brunner- Munzel test revealed significant differences in the completion time for the practice (p < .03), the tasks of the BioLayout graph (p < .02), and the task 3.2 (p < .05). The gesture group spent more time than the mouse group in the practice task. Conversely, the gesture group spent less time than the mouse group in the task 3.2 and the tasks of the BioLayout graph.
Figure 3: Participants rated the difficulty of performing each operation with gesture and mouse input. The average scores, standard errors, and the operations with significant difference are plotted.
Figure 4: Accuracy rates and their standard errors for each tasks. The label (a-c) indicate the accuracy rates on different graphs: (a) brain graph, (b) force-directed graph, and (c) BioLayout graph.
6 DISCUSSION
Gesture Design. As shown in section 5, the participants provided better evaluation for the gesture about move a node, move an edge, and rotate a graph. A possible reason is that the gestures for these operations are easy to learn and recall. The participants can use their hands to approach, grab, and move, just as they do in real life. As for the operation of rotating a graph, because the mouse has only two DoFs, it is not easy to precisely control the rotation in 3D space [12]. On the contrary, the gesture of rotating a graph has three rotational DoFs. Participants can rotate a graph more easily.
On the other hand, the participants evaluated that using a mouse is better for the grouping operation. A possible reason is that the grouping operation with a mouse is much simpler than the gesture.
The gesture need two stages: making the hands parallel, and then clapping the hands, while the participants in the mouse group needed only double clicking. Participants also gave the worst evaluation on highlighting gestures within the proposed gestures. It may be because we asked participants to straighten their fingers when they were practicing. We gave this instruction because it provides better
Figure 5: The completion time of completing tasks in different systems.
The average time and standard error is provided. The tasks with significant difference are marked. The label (a-c) indicate the total time spending on different graphs: (a) brain graph, (b) force-directed graph, and (c) BioLayout graph.
recognition with Leap Motion. However, the participants may feel uncomfortable and fatigue easily. We might be able to find better gestures for these. A good gesture design should consider all the issues of intuitiveness, feasibility, and ergonomics.
Influence of Graph Complexity on the Efficiency of Gestures In this paragraph, we discuss the potential effects of graph com- plexity on the efficiency of gestures. The force-directed graph was the simplest among the three graphs. As the nodes were sparsely distributed, the participants were able to complete the task with fewer operations. The completion time was short on both the mouse and gesture groups. On the other hand, the BioLayout graph was the most complicated graph in the user study, and the gesture group performed statistically significantly better in this graph. One pos- sible reason is that the BioLayout had many connections between each node and they were densely distributed. Thus, the participants needed to move many nodes and edges to figure out the relation- ship between nodes for completing the tasks. The gestures of move nodes/edges are easier to perform in the gesture system. This influ- ences the participants performance in task 3.2 significantly because, in both the mouse and gesture systems, most participants counted nodes by moving nodes. One noteworthy thing is in task 3.3, al- though the grouping operation using a mouse was rated as easier than using gestures, the mouse group was not able to complete the task 3.3 faster. As we observed that the participants often forgot to utilize the grouping operation, it can be inferred that the gesture group may perform better when completing task 3.3 without grouping.
Evaluation of Gesture System. The required time for learning the gestures were longer than using a mouse as shown in Figure 5. This is not surprising since the mouse is more familiar for the participants as an input device. Despite the longer learning time, the participants can still learn the gestures within 11 minutes on average.
As for the effectiveness of the gestures, the participants in the gesture group were able to complete the tasks with the similar/less time when compared with the mouse group. About the difficulty of using each gesture, there was no particularly difficult gesture. All gestures had a difficulty rating from 1 to 3 on average. The most difficult gestures were the highlighting operations with gestures. About the user experience of the system, according to the questionnaire, most participants agreed that our gesture system was intuitive, easy to learn, and interesting. They also thought that they were able to explore the data in the VR environment. We are also interested in the advantages and disadvantages of our system. Five participants mentioned that intuition was the best part of the system, and five participants thought the accuracy of recognizing gestures could be improved. We could refine the gesture system based on the results obtained in the user study to made it more effective and intuitive.
7 CONCLUSIONS ANDFUTUREWORK
In this paper, we designed a set of gestures and implemented a gesture interface that allows users to interact with graph visualization in the VR environment. The user study revealed that compared with mouse input, using gesture input is more efficient and effective for the complicated graph. There are some possible directions for future research. First, to obtain more confident results from a user study, we will apply a randomized order for the tasks. Second, the users may sometimes feel tired when using our system for a while. Besides solving the fatigue problem from the VR system, a better gesture design considering ergonomics is desirable.
ACKNOWLEDGMENTS
This research was sponsored in part by UC Davis RISE program, U.S. National Science Foundation under Grant No. DRL-1323214, and the Ministry of Science and Technology of Taiwan under Grant No. 104-2917-I-009-016, 104-2628-E-009-001-MY3 and 105-2221- E-009-095-MY3.
REFERENCES
[1] Biolayout express3D. http://www.biolayout.org/. Accessed:
2016-12-10.
[2] Force-directed graph - bl.ocks.org. https://bl.ocks.org/
mbostock/4062045. Accessed: 2016-12-10.
[3] B. Alper, T. Hollerer, J. Kuchera-Morin, and A. Forbes. Stereoscopic highlighting: 2D graph visualization on stereo displays. IEEE Trans- actions on Visualization and Computer Graphics, 17(12):2325–2333, 2011.
[4] F. Argelaguet and C. Andujar. A survey of 3D object selection tech- niques for virtual environments. Computers & Graphics, 37(3):121–
136, 2013.
[5] Autodesk Inc. Maya. http://www.autodesk.com/products/
maya/. Accessed: 2016-01-28.
[6] J. B¨ottger, A. Sch¨afer, G. Lohmann, A. Villringer, and D. S. Margulies.
Three-dimensional mean-shift edge bundling for the visualization of functional connectivity in the brain. IEEE transactions on visualization and computer graphics, 20(3):471–480, 2014.
[7] D. Bowman, E. Kruijff, J. J. LaViola Jr, and I. Poupyrev. 3D User Interfaces: Theory and Practice, CourseSmart eTextbook. Addison- Wesley, 2004.
[8] S. P. Boyd and C. H. Barratt. Linear controller design: limits of performance. Prentice Hall Englewood Cliffs, NJ, 1991.
[9] R. Brath. 3D infovis is here to stay: Deal with it. In 3DVis (3DVis), 2014 IEEE VIS International Workshop on, pp. 25–31. IEEE, 2014.
[10] E. Brunner and U. Munzel. The nonparametric behrens-fisher problem:
Asymptotic theory and a small-sample approximation. Biometrical Journal, 42(1):17–25, 2000.
[11] S. Bryson. Virtual reality in scientific visualization. Communications of the ACM, 39(5):62–71, 1996.
[12] M. Chen, S. J. Mountford, and A. Sellen. A study in interactive 3-d rotation using 2-d control devices. In Proceedings of the 15th Annual Conference on Computer Graphics and Interactive Techniques, SIGGRAPH ’88, pp. 121–129. ACM, New York, NY, USA, 1988. doi:
10.1145/54852.378497
[13] M. Cordeil, T. Dwyer, K. Klein, B. Laha, K. Marriot, and B. H. Thomas.
Immersive collaborative analysis of network connectivity: CAVE-style or head-mounted display? IEEE Transactions on Visualization and Computer Graphics, pp. 1–1, 2016.
[14] C. Cruz-Neira, D. J. Sandin, T. A. DeFanti, R. V. Kenyon, and J. C. Hart.
The CAVE: audio visual experience automatic virtual environment.
Communications of the ACM, 35(6):64–73, 1992.
[15] S. Eichelbaum, M. Hlawitschka, and G. Scheuermann. LineAO&#
x2014; improved three-dimensional line rendering. IEEE Transactions on Visualization and Computer Graphics, 19(3):433–445, 2013.
[16] T. Fujiwara, J.-K. Chou, A. M. McCullough, C. Ranganath, and K.- L. Ma. A visual analytics system for brain functional connectivity comparison across individuals, groups, and time points. In IEEE Pacific Visualization Symposium (PacificVis), forthcoming 2017.
[17] N. Greffard, F. Picarougne, and P. Kuntz. Beyond the classical mono- scopic 3D in graph analytics: an experimental study of the impact of stereoscopy. In 3DVis (3DVis), 2014 IEEE VIS International Workshop on, pp. 19–24. IEEE, 2014.
[18] H. Halpin, D. J. Zielinski, R. Brady, and G. Kelly. Exploring semantic social networks using virtual reality. In International Semantic Web Conference, pp. 599–614. Springer, 2008.
[19] C. H¨anel, B. Weyers, B. Hentschel, and T. W. Kuhlen. Interactive volume rendering for immersive virtual environments. In 3DVis (3DVis), 2014 IEEE VIS International Workshop on, pp. 73–74. IEEE, 2014.
[20] A. Kulik. Building on realism and magic for designing 3D interaction techniques. IEEE Computer Graphics and Applications, 29(6):22–33, 2009.
[21] O.-H. Kwon, C. Muelder, K. Lee, and K.-L. Ma. A study of layout, rendering, and interaction methods for immersive graph visualization.
IEEE transactions on visualization and computer graphics, 22(7):1802–
1815, 2016.
[22] Leap Motion, Inc. Leap Motion. https://www.leapmotion.com/.
Accessed: 2016-12-10.
[23] B. Lee, C. Plaisant, C. S. Parr, J.-D. Fekete, and N. Henry. Task
taxonomy for graph visualization. In Proceedings of the 2006 AVI workshop on BEyond time and errors: novel evaluation methods for information visualization, pp. 1–5. ACM, 2006.
[24] J. P. McIntire and K. K. Liggett. The (possible) utility of stereoscopic 3D displays for information visualization: The good, the bad, and the ugly. In 3DVis (3DVis), 2014 IEEE VIS International Workshop on, pp.
1–9. IEEE, 2014.
[25] Microsoft Corporation. HoloLens. https://www.microsoft.com/
microsoft-hololens. Accessed: 2017-01-28.
[26] M. Mine et al. Virtual environment interaction techniques. UNC Chapel Hill computer science technical report TR95-018, pp. 507248–2, 1995.
[27] K. Mirhosseini, Q. Sun, K. C. Gurijala, B. Laha, and A. E. Kaufman.
Benefits of 3D immersion for virtual colonoscopy. In 3DVis (3DVis), 2014 IEEE VIS International Workshop on, pp. 75–79. IEEE, 2014.
[28] S. Mitra and T. Acharya. Gesture recognition: A survey. IEEE Trans- actions on Systems, Man, and Cybernetics, Part C (Applications and Reviews), 37(3):311–324, 2007.
[29] Oculus VR, LLC. Rift. https://www.oculus.com/rift. Accessed:
2016-12-10.
[30] T. Piumsomboon, A. Clark, M. Billinghurst, and A. Cockburn. User- defined gestures for augmented reality. In IFIP Conference on Human- Computer Interaction, pp. 282–299. Springer, 2013.
[31] L. E. Potter, J. Araullo, and L. Carter. The leap motion controller: a view on sign language. In Proceedings of the 25th Australian computer- human interaction conference: augmentation, application, innovation, collaboration, pp. 175–178. ACM, 2013.
[32] I. Poupyrev, T. Ichikawa, S. Weghorst, and M. Billinghurst. Egocentric object manipulation in virtual environments: empirical evaluation of interaction techniques. In Computer graphics forum, vol. 17, pp. 41–52.
Wiley Online Library, 1998.
[33] A. J. Pretorius, H. C. Purchase, and J. T. Stasko. Tasks for multivariate network analysis. In Multivariate Network Visualization, pp. 77–95.
Springer, 2014.
[34] S. S. Rautaray and A. Agrawal. Vision based hand gesture recogni- tion for human computer interaction: a survey. Artificial Intelligence Review, 43(1):1–54, 2015.
[35] R. E. Roth. An empirically-derived taxonomy of interaction primitives for interactive cartography and geovisualization. IEEE transactions on visualization and computer graphics, 19(12):2356–2365, 2013.
[36] A. R. Teyseyre and M. R. Campo. An overview of 3D software visu- alization. IEEE transactions on visualization and computer graphics, 15(1):87–105, 2009.
[37] C. Tominski, J. Abello, and H. Schumann. CGV - an interactive graph visualization system. Computers & Graphics, 33(6):660–678, 2009.
[38] Unity Technologies. Unity 3D. https://unity3d.com/. Accessed:
2016-01-28.
[39] A. Van Dam, A. S. Forsberg, D. H. Laidlaw, J. J. LaViola, and R. M.
Simpson. Immersive VR for scientific visualization: A progress report.
IEEE Computer Graphics and Applications, 20(6):26–52, 2000.
[40] C. Ware and G. Franck. Evaluating stereo and motion cues for visu- alizing information nets in three dimensions. ACM Transactions on Graphics (TOG), 15(2):121–140, 1996.
[41] C. Ware and P. Mitchell. Reevaluating stereo and motion cues for visualizing graphs in three dimensions. In Proceedings of the 2nd symposium on Applied perception in graphics and visualization, pp.
51–58. ACM, 2005.
[42] C. Ware and P. Mitchell. Visualizing graphs in three dimensions. ACM Transactions on Applied Perception (TAP), 5(1):2, 2008.
[43] Z. Zhang, Y. Wu, Y. Shan, and S. Shafer. Visual panel: Virtual mouse, keyboard and 3D controller with an ordinary piece of paper. In Pro- ceedings of the 2001 Workshop on Perceptive User Interfaces, PUI
’01, pp. 1–8. ACM, New York, NY, USA, 2001. doi: 10.1145/971478.
971522