FTIR study of adsorption, thermal reactions and photochemistry of
benzene on powdered TiO2
Wen-Chun Wu, Li-Fen Liao, Chen-Fu Lien and Jong-Liang Lin*
Department of Chemistry, National Cheng Kung University, 1 T a Hsueh Road, T ainan, T aiwan 701, Republic of China. E-mail : jonglin=mail.ncku.edu.tw ;
Fax :]886 6-2740552; T el: ]886 6-2757575 ext. 65326 Received 5th June 2001, Accepted 26th July 2001
First published as an Advance Article on the web 4th September 2001
The adsorption, thermal reactions, and photochemistry of benzene on powderedTiO have been investigated 2
using Fourier-transform infrared spectroscopy. Benzene is adsorbed with its p electrons interacting with the surface Ti4` ions, and is stable even when theTiO temperature is increased to 400 ¡C. However, it is subject
2
to thermal decomposition toH CO(g) and in the presence of and the dissociation occurs
2O(g), CO2(g) O2
below D225 ¡C. With the aid of an adsorption study of phenol and iodobenzene, it is found that phenoxy groups are generated on the surface in the photooxidation of benzene onTiO and the amount greatly
2
increases in the presence ofH or Other surface products containing carbonyl or carboxylate groups are 2O O2.
produced as well for benzene photoreaction inO The present in situ study shows that the products extracted 2.
using solvents fromTiO catalysts after photooxidation of benzene in previous investigations may not reveal 2
the real products formed on the surface during photoillumination processes.
Introduction
The use of TiO as a photocatalyst has been widely investi-2
gated for the degradation of a large number of organic mol-ecules.1,2 AsTiO absorbs photons with energy larger than its
2
band gap (D3.2 eV), the electrons in the valence band can be excited to the conduction band, leaving holes behind in the valence band. The photogenerated electronÈhole pairs may di†use to the surface where they can initiate oxidation and/or reduction reactions of organic molecules.
Benzene is one of the most widely used solvents and may be carcinogenic. Its breakdown to environmentally innocuous compounds by a photochemical process usingTiO has been
2
extensively studied. These studies were performed with the catalyst in benzene-containing solutions or in contact with benzene vapor. Fujihira et al.3 conducted, after photoirradia-tion of aqueous benzene soluphotoirradia-tions under air, GC (gas chromatography) analysis of the products obtained by acid-ifying the photoilluminated solutions, then extracting with ether, and Ðnally concentrating under a reduced pressure. They observed phenol and biphenyl.3 However in a GC/MS (mass spectrometry) analysis of the products obtained from acidiÐcation and extraction with CH of photoirradiated
2Cl2
aqueous benzene solution in the presence ofO Turchi et al.4 2,
observed the formation of phenol and benzoquinone. In the photooxidation of a deaerated aqueous solution of benzene in the presence of Ag` ion as an electron acceptor, Hashimoto et al.5 observed the products phenol, biphenyl, hydroquinone, catechol and muconic acid in the gas phase and liquid phase by MS and GC/LC after consuming 1 mmol of Ag`.
On the other hand, after photooxidation catalyzed by TiO 2 in contact with a gaseous mixture of benzene, oxygen and water, Jacoby et al.6 observed, using high performance liquid chromatography (HPLC), phenol, malonic acid and hydroquinone/benzoquinone in the water extract solution of the catalyst. In a similar extraction procedure using HPLC as well, dÏHennezel et al.7 observed phenol, hydroquinone and benzoquinone. Meanwhile they suspected the formation of a
polymer product having chains of several aromatic rings, similar to the suggestion in Sitkiewitz et al.Ïs study of benzene photodegradation.8
In addition to the exploration of reaction products and intermediates in benzene photodegradation, parameters including the e†ects of photon Ñux, temperature and concen-trations of benzene, water andO on the benzene conversion
2
and reaction rate have been investigated.9,10 In the present paper, we study the adsorption, thermal reaction, and pho-tooxidation of benzene onTiO by Fourier-transform infrared
2
spectroscopy (FTIR). Since, in the previous studies of the photo-oxidation of benzene vapor over TiO the reaction
inter-2,
mediates or products on the surface were characterized through solvent extraction after the photoprocess,6,7 it may not reveal the real adsorbates formed on the surface during-the photoreactions. Therefore in during-the present study of during-the photo-oxidation of benzene on TiO we focus on the
identiÐca-2,
tion of reaction intermediates or products adsorbed on the surface and on the e†ect of the addition ofO or by
2 H2O using ““ in situ ÏÏ measurements of infrared spectroscopy.
Experimental
The sample preparation ofTiO powder supported on a tung-2
sten Ðne mesh (D6 cm2) has been described previously.11,12 In brief,TiO powder (Degussa P25, D50 m2 g~1, anatase 70%,
2
rutile 30%) was dispersed in water/acetone solution to form a uniform mixture which was then sprayed onto a tungsten mesh. After that, theTiO sample was mounted inside the IR
2
cell for simultaneous photochemistry and FTIR spectroscopy. The IR cell with twoCaF windows for IR transmission down
2
to 1000 cm~1 was connected to a gas manifold which was pumped by a 60 L s~1 turbomolecular pump with a base pres-sure of D1] 10~7 Torr. The TiO sample in the cell was
2
heated to 450 ¡C under vacuum for 24 h by resistive heating. The temperature of the TiO sample was measured by a
2
K-type thermocouple spotwelded on the tungsten mesh. Before each run of the experiment, the TiO sample was
2
heated to 450 ¡C in vacuum for 2 h. After the heating, 10 Torr was introduced into the cell as the sample was cooled to O
2
70 ¡C. When theTiO temperature reached 35 ¡C, the cell was 2
evacuated for gas dosing.O (99.998%) was purchased from 2
Matheson. Benzene (99.8%, Merck), iodobenzene (99%, TCI) and phenol (98%, Osaka) were puriÐed by several freezeÈ pumpÈthaw cycles before introduction into the cell. Pressure was monitored with a Baratron capacitance manometer and an ion gauge. In the photochemistry study, both the UV and IR beams were set 45¡ to the normal of theTiO sample. The
2
UV light source used was a combination of a 350 W Hg arc lamp (Oriel Corp.), a water Ðlter, and a bandpass Ðlter with a band width of D100 nm centered at D320 nm (Oriel 51650). The photon power at the position of the TiO sample was
2
D0.24 W cm~2 measured in air by a power meter (Molectron, PM10V1). Infrared spectra were obtained with 4 cm~1 resolution by a Bruker FTIR spectrometer with a MCT detec-tor. The entire optical path was purged withCO dry air.
2-free The spectra presented here have been ratioed against a clean
spectrum providing the metal oxide background. In the TiO
2
study of photooxidation, the photoirradiation time count was started as the UV lamp was turned on. It took 40È50 s to reach full power.
Results and discussion
Adsorption of benzene on TiO
2
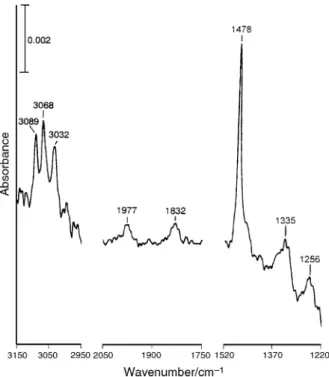
Fig. 1 shows the infrared spectrum of aTiO surface exposed 2
to 5 Torr of benzene and then evacuated at 35 ¡C. Absorption bands appear at 1256, 1335, 1478, 1832, 1977, 3032, 3068 and 3089 cm~1. Among them, the three high-frequency peaks are assigned to CÈH stretching of adsorbed benzene. The 1478 cm~1 band is related to CÈC stretching and CÈH rocking; 1335 cm~1 to CÈH rocking; and 1256 cm~1 to CÈCÈC bending and CÈH rocking. The 1832 and 1977 cm~1 bands are due to c and respectively in WilsonÏs
10] c17 c5] c17
numbering ;c and are related to the torsion mode 5, c17 c10
about the CÈC bonds and CÈH out-of-plane bending.13 The sharp band at 1478 cm~1 is the same as the previous obser-vation of benzene on rutileTiO and is D5 cm~1 lower than
2
Fig. 1 Infrared spectrum of a TiO surface exposed to 5 Torr of 2
benzene and then evacuated at 35 ¡C. The spectrum was recorded with 50 scans. TheTiO powder used was D84 mg.
2
the corresponding vibrational mode of gaseous benzene.14 Suda attributed this red-shift to the interaction of a surface Ti4` ion with the benzene ring through the p system.14 This argument was supported by the NMR study of C
6D6 adsorbed at monolayer coverage on rutileTiO The values
2.15
of the e†ective quadrupole coupling constants suggested that the benzene molecules were adsorbed Ñat on the surface.13 In addition to the 1478 cm~1 band revealing the interaction and adsorption conÐguration of benzene on the surface, the fre-quencies ofc and can serve a similar role. In
5] c17 c10] c17
the study of benzene adsorption on zeolites, it was found that the c and of adsorbed benzene had
fre-5] c17 c10] c17
quencies D20È40 cm~1 higher than those of liquid benzene at 1960 and 1816 cm~1 (ref. 16È18) The blue-shift is attributed to the interaction of benzene with metal cations through the p-electron cloud. In the present study the c and
5] c17 c10 of benzene on have frequencies D17 cm~1 higher
] c17 TiO
2
than those of liquid benzene, further supporting the type of interaction between the benzene p system and the surface Ti4` ions. Similar blue-shifts for l and of
5] l17 l10] l17 benzene onTiO were also observed by Ramis et al.19 After
2
brief annealing at 500 ¡C under vacuum for 1 min, it is found that D10% of benzene still remained on the surface (not shown). The surface hydroxy stretching range between 3400 and 3800 cm~1 was also checked but the change is small after exposure of benzene to TiO followed by evacuation.
2
However, prior to evacuation, i.e. the TiO was in contact 2
with benzene vapor (more adsorbed benzene in this case), the OH(a) stretching peak intensities decreased noticeably, sug-gesting that, at higher benzene concentration on the surface, benzene does interact with surface hydroxy groups.
Thermal reaction of benzene on TiO
2
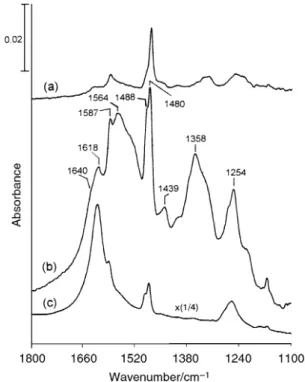
Figs. 2(a)È(c) show the infrared spectra taken in the course of heatingTiO initially in contact with a mixture of D30 Torr
2
benzene and D60 TorrO in a closed cell. Comparing Fig. 2
2(a) with the gaseous benzene spectrum of Fig. 2(e) obtained by using the same optical conditions of the infrared spectro-meter in a separate measurement, it is found that adsorbed benzene contributes signiÐcant absorption for the 1479 cm~1 band. All the infrared bands in Fig. 2(a) can be attributed to adsorbed and gaseous benzene in the cell. The amount of surface benzene decreases with temperature, leading to a change of the spectral features. As shown in Fig. 2(b) at 300 ¡C, the peak at 1479 cm~1 due to adsorbed benzene is no longer observed ; instead, gaseous benzene absorption features at 1474, 1482, 1495, 3047 and 3056 cm~1 become more obvious. Furthermore, absorptions at 1574 and 2349 cm~1 grow. Increasing the temperature to 400 ¡C for 3 min, the 2349 cm~1 band increases signiÐcantly in intensity, accompanied by new bands at 2143 and 1413 cm~1 and narrow peaks rep-resented by the 1558 cm~1 band in the region of 1400È1750 cm~1. The 1558, 2143 and 2349 cm~1 bands are identiÐed as CO(g) and formed in the gas phase respec-H
2O(g), CO2(g)
tively. As the temperature is cooled down to D35 ¡C after surface annealing, residual gaseous benzene is adsorbed back on the surface as indicated by the 1479 cm~1 band in Fig. 2(d). Likewise, gaseous water also disappears and is adsorbed on the surface with its characteristic absorption at 1605 cm~1. There are two unidentiÐed absorption bands located at 1413 and 1567 cm~1 in Fig. 2(d) which do not belong to adsorbed water and benzene and are tentatively assigned to carbox-ylates. Figs. 3(a) and (b) show the relative concentrations of CO(g) and as a function of surface tem-H
2O(g), CO2(g)
perature up to 400 ¡C and as a function of annealing time at 400 ¡C, respectively.CO starts to evolve at D225 ¡C,
indi-2(g)
cating that benzene must decompose below this temperature in the presence of oxygen. Meanwhile thisCO evolution
tem-2
Fig. 2 (a)È(c) Infrared spectra taken at the indicated temperature during the course of heatingTiO initially in contact with a mixture
2
of D30 Torr benzene and D60 TorrO in a closed cell. The
2 TiO2
temperature was linearly increased from D35 to 400 ¡C at 1 ¡C s~1 and then maintained at 400 ¡C for 3 min. (d) Infrared spectrum taken as the temperature was cooled down to D35 ¡C after the surface annealing. Spectra (a)È(d) were recorded with Ðve scans. The TiO
2 powder used was D94 mg. (e) Gaseous benzene spectrum obtained by using the same optical condition of the infrared spectrometer in a separate measurement. The curve has been multiplied by a factor of 15 and was recorded with 50 scans.
carboxylic acid, implying that benzene may decompose, through carboxylic acid or carboxylate groups, to CO
2(g).20 Fig. 4 shows the infrared spectra taken at 35 ¡C before and after annealing at 400 ¡C for 3 min for aTiO surface initially
2
in contact with D30 Torr of benzene. The two spectra in Fig. 4 are almost the same, showing that benzene remains intact withoutO at 400 ¡C.
2
Photoreaction of benzene on TiO
2
Fig. 5(a) is the infrared spectrum taken after photoillumina-tion of a TiO surface initially in contact with 2 Torr of
2
benzene, followed by evacuation to show the adsorbed species
Fig. 3 Relative concentrations ofH CO(g) and as
func-2O(g), CO2(g)
tions of (a) surface temperature up to 400 ¡C and (b) annealing time at 400 ¡C. The maximum amounts ofH CO(g) and are all
2O(g), CO2(g)
scaled to 1.
Fig. 4 Infrared spectra taken at 35 ¡C before (upper trace) and after (lower trace) annealing at 400 ¡C for 3 min for aTiO surface initially
2
in contact with D30 Torr of benzene. The spectra were obtained with 50 scans. TheTiO powder used was D94 mg.
2
on the surface. Fig. 5(b) and (c) are infrared spectra taken after the same photoirradiation procedure, but with theTiO
ini-2 tially in contact with a mixture of 2 Torr benzene and D10 Torr O and a mixture of 2 Torr benzene and D0.2 Torr
2,
Fig. 5 (a) Infrared spectrum taken after 180 min photoillumination of aTiO surface initially in contact with 2 Torr of benzene, followed
2
by evacuation to show the adsorbed species on the surface. (b) Infra-red spectrum taken after the same photoirradiation procedure as (a), but with the TiO initially in contact with a mixture of 2 Torr
2
benzene and 10 TorrO (c) Infrared spectrum taken after the same 2.
photoirradiation procedure as (a), but with the TiO initially in 2
contact with a mixture of 2 Torr benzene and D0.2 TorrH This 2O. spectrum has been multiplied by a factor of 0.25. TheTiO powder
2 used was D94 mg. All the spectra were recorded with 50 scans at D35 ¡C.
respectively. The characteristic benzene peak at 1480 H
2O,
cm~1 is present in the three spectra of Fig. 5. In addition, another three common bands appear at 1254, 1488 and 1587 cm~1, of which the 1254 cm~1 band falls in the CÈO stretch-ing frequency range.21 We thus follow this clue to identify the species responsible for these three bands by investigation of the adsorption of phenol.
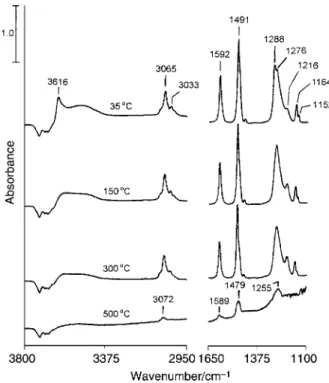
The reason to study the adsorption of phenol is that this compound contains a CÈO bond and is one of the photo-products in previous benzene photoreaction studies. Fig. 6 shows the infrared spectra taken after phenol adsorption at 35 ¡C followed by evacuation at the indicated temperatures for 1 min. Peaks appear at 1152, 1164, 1216, 1276, 1288, 1491, 1592, 3033, 3065 and 3616 cm~1 in the 35 ¡C spectrum. The 3616 cm~1 band is assigned to the OÈH stretching of adsorbed phenol molecules.22,23 The 3033 and 3065 cm~1 bands are assigned to CÈH stretching. All the peaks in the range 1100È1650 cm~1 are related to CÈC stretching and CÈH rocking, but with di†erent extents of contribution of these two modes. Particularly among them, the bands at 1216 and 1288 cm~1 also have an OÈH rocking component and the band at 1276 cm~1 has a CÈO stretching contribution.22,23 The band at 1491 cm~1 is 6È13 cm~1 lower than the corre-sponding mode of gas-phase phenol molecules, suggesting the type of interaction of the benzene ring with surface Ti4` ions as in the case of adsorbed benzene. However, the broad feature in the range D3400È3600 cm~1 due to the absorption of associated hydroxy groups shows another type of inter-action, namely hydrogen bonding. The negative bands between D3600 and 3800 cm~1 indicate that the surface hydroxy groups are involved in the hydrogen bonding to adsorbed phenol. In Fig. 6, the bands at 1288 and 3616 cm~1 assigned to absorbed phenol decrease in intensity with increasing temperature. After further heating to 500 ¡C, absorption bands show their positions at 1255, 1479, 1589 and 3072 cm~1. Adsorbed phenol is not present on the surface at this high temperature, as shown by the disappearance of the 3616 cm~1 band due to the OÈH stretching of phenol. The bands in the 500 ¡C spectrum are assigned to the modes of surface phenoxy : 1255 cm~1 to CÈO stretching, 1479 and
Fig. 6 Infrared spectra ofTiO at D35 ¡C after being in contact with 2
the vapor of phenol for 15 min (top) followed by evacuation at the indicated temperatures for 1 min. All the spectra were obtained with 50 scans. TheTiO powder used was D108 mg.
2
1589 cm~1 to CÈC stretching and CÈH rocking, and 3072 cm~1 to CÈH stretching. Phenol is adsorbed similar to the case of aliphatic alcohols on the surface.
Previous aliphatic alcohol adsorption studies have shown two adsorption forms of molecular alcohol and dissociative alkoxy groups on TiO at 35 ¡C and only alkoxy groups
2
remain on the surface at temperature above 200 ¡C.20,24 There is a common feature in the infrared absorptions of aliphatic alkoxy and phenoxy groups onTiO i.e., the peak width of
2,
CÈO stretching is much larger than those of other vibrational modes, probably due to the two forms of monodentate and bidentate adsorption conÐgurations.24 However, phenoxy is more stable than aliphatic alkoxy, which is completely removed fromTiO surface by 350 ¡C.20,24 To further support
2
that phenoxy is present on the surface in the photooxidation of benzene, we continue by investigating the adsorption of iodobenzene, because in previous studies, alkyl iodides are dis-sociatively adsorbed, forming alkoxy groups on a TiO
2 surface.25,26
Fig. 7 shows the infrared spectra taken after iodobenzene adsorption on aTiO surface at 35 ¡C followed by evacuation
2
and annealing at 425 ¡C for 1 min. All the bands in the 35 ¡C spectrum involve excitation of vibrational modes of CÈC stretching and CÈH rocking.27 After heating to 425 ¡C, these bands decrease in intensity, but enhanced absorptions grow at 1249, 1490 and 1588 cm~1. Further experiments to study the dissociation of iodobenzene to form phenoxy onTiO in
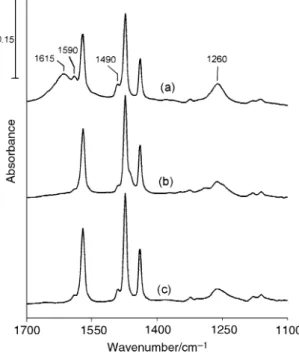
dif-2 ferent conditions were carried out. Fig. 8 shows the infrared spectra taken after iodobenzene adsorption followed by annealing at 150 ¡C for 2 h in the presence of water as indi-cated by the 1615 cm~1 band (a), in 10 Torr ofO (b), and
2
with neither both water norO (c). In all these cases, three 2
new bands appear at 1260, 1490 and 1590 cm~1. These three bands are attributed to the formation of phenoxy groups on the surface based on two reasons. First, their positions are very close to those bands in the 500 ¡C spectrum in Fig. 6, which is assigned to adsorbed phenoxy. Second, previous studies of alkyl iodide adsorption onTiO have shown alkoxy
2
formation on the surface as the CÈI bond breaks. Iodobenzene
Fig. 7 Infrared spectra taken after iodobenzene adsorption on a surface at 35 ¡C followed by evacuation and annealing at 425 ¡C TiO
2
for 1 min. The 425 ¡C spectrum has been multiplied by a factor of 2. The spectra were obtained with 50 scans at D35 ¡C. TheTiO powder
2 used was D83 mg.
Fig. 8 Infrared spectra taken at D35 ¡C in vacuum after iodoben-zene adsorption followed by annealing at 150 ¡C for 120 min in the presence of water (a), in 10 Torr ofO (b) and with neither water nor
2
(c). All the spectra were obtained with 50 scans. The powder O
2 TiO2
used was D80 mg.
is expected to behave in the same way. It is found that oxygen is not important for the growth of the adsorbed phenoxy groups by comparison of Figs. 8(b) and (c). However, phenoxy is enhanced in the presence of adsorbed water. Similar enhancement in the CÈI bond scission of alkyl iodides to form alkoxy groups onTiO has been observed in the presence of
2
and is attributed to the surface OH groups attacking the H
2O
carbon atom bonding to the iodine in the alkyl iodide mol-ecule.26,27
The three common peaks observed in the photoirradiation of benzene on TiO in the di†erent conditions in Fig. 5 are
2
therefore attributed to the phenoxy group according to the similar peak positions and broad peak features of the CÈO stretching bands obtained in the adsorption of phenol and iodobenzene. In Fig. 5, it is found that the amount of phenoxy formed on the surface is much less in the case withoutO or
2 and only phenoxy groups are observed in the presence H
2O,
of H However, other surface species are generated in the 2O.
presence ofO For example, the strong, broad bands at 1358, 2.
1439 and 1564 cm~1 suggest the formation of carboxylates; the 1618 cm~1 band suggests the formation of water; and the 1640 cm~1 band suggests carbonyl-containing adsorbates. However, we are not able to identify exactly the molecules that contain these three functional groups. Recently, Einaga et al.28 have taken an ex situ di†use reÑectance IR spectrum of a sample after benzene photooxidation in dry air. Based TiO
2
on the IR absorptions, they suggested the formation of water, benzene derivatives, and carbonyl-containing species.28
The generation of phenoxy in the photoirradiation of benzene onTiO in the absence of water or oxygen indicates
2
that the photoreaction can be initiated by the hole capture of absorbed benzene, forming benzene radical cation (~C
6H5`). This species may then interact with surface lattice oxygen ions or surface hydroxy groups to produce phenoxy. In the photo-oxidation of benzene in the presence ofH phenoxy is the
2O,
only surface product observed and its amount is greatly increased, compared to the case without water. The possible roles of adsorbed water in the semiconductor photochemical processes include : (1) a reagent which reacts, with benzene radical cations to form phenoxy ; (2) generation of ~OH
radicals29,30 which may add to the benzene ring and then turn into phenoxy ; and (3) solvation for benzene radical cations after hole capture of benzene. The latter e†ect may increase the efficiency of hole capture energetically and/or may cause misalignment of the orbital energy levels involved in the charge transfer between theTiO hole levels and the benzene
2
Ðlled levels after the hole capture, and thus reduces the possi-bility of reverse charge transfer.31,32 In the photooxidation of benzene in the presence of oxygen,O can accept
photoelec-2
trons and therefore increase the lifetime of holes and photoef-Ðciency. Oxygen in the form ofO or anionic oxygen species
2
may also take part in benzene photooxidation, which leads to the formation of carboxylates and carbonyl-containing species.
Conclusion
As a brief conclusion in the present study, the most important Ðnding in the photoirradiation of benzene onTiO is the in
2
situ detection of the photoproduct, phenoxy, on the surface. This Ðnding shows that, in the previous photoreaction studies of benzene vapor overTiO the photoproducts extracted
2,6,7
from the TiO catalyst after the photoprocesses may not 2
reÑect the actual species that are formed on the surface during the photoillumination. For example, the phenol identiÐed from the extract solutions of benzene photoreaction on TiO
2, especially in an acidic condition, may very likely be derived from surface phenoxy groups instead of adsorbed phenol, as suggested by our experiments. Likewise, solvents functioning in this respect cannot be ignored for photoreactions occurring in solution phase.
References
1 M. R. Ho†mann, S. T. Martin, W. Choi and D. W. Bahnemann, Chem. Rev., 1995, 95, 69.
2 M. A. Fax and M. T. Dulay, Chem. Rev., 1993, 93, 341. 3 M. Fujihira, Y. Satoh and T. Osa, Nature, 1981, 293, 206. 4 C. S. Turchi and D. F. Ollis, J. Catal., 1989, 119, 483.
5 K. Hashimoto, T. Kawai and T. Sakata, J. Phys., 1984, 88, 4083. 6 W. A. Jacoby, D. M. Blake, T. A. Fennell, J. E. Boulter, L. M.
Vargo, M. C. George and S. K. Dolberg, J. Air W aste Manage. Assoc., 1996, 46, 891.
7 O. dÏHennezel, P. Pichat and D. F. Ollis, J. Photochem. Photo-biol. A : Chem., 1998, 118, 197.
8 S. Sitkiewitz and A. Heller, New J. Chem., 1996, 20, 233.
9 X. Fu, W. A. Zeltner and M. A. Anderson, Appl. Catal. B : Environ., 1995, 6, 209.
10 N. N. Lichtin and M. Sadeghi, J. Photochem. Photobiol. A : Chem., 1998, 113, 81.
11 J. C. S. Wong, A. Linsebigler, G. Lu, J. Fan and J. T. Yates, Jr., J. Phys. Chem., 1995, 99, 335.
12 P. Basu, T. H. Ballinger and J. T. Yates, Jr., Rev. Sci. Instrum., 1998, 59, 1321.
13 Y. Miwa, N. Mimura, K. Machida, T. Nakagawa, J. Umemura and S. Hayashi, Spectrochim. Acta A, 1994, 50, 1629.
14 Y. Suda, L angmuir, 1988, 4, 147.
15 B. Boddenberg and K. Eltzner, L angmuir, 1991, 7, 1498.
16 J.-P. Shen, J. Ma, T. Sun and D.-Z. Jiang, J. Chem. Soc., Faraday T rans., 1994, 90, 1351.
17 B.-L. Su, J. Chem. Soc., Faraday T rans., 1997, 93, 1449. 18 B.-L. Su and V. Norberg, L angmuir, 1998, 14, 7410.
19 G. Ramis, G. Busca and V. Lorenzelli, J. Electron. Spectrosc. Relat. Phenom., 1993, 64/65, 297.
20 C.-C. Chuang, W.-C. Wu, M.-C. Huang, I.-C. Huang and J.-L. Lin, J. Catal., 1999, 185, 423.
21 G. Herzberg, Molecular Spectra and Molecular Structure, Vol. I, Spectra of Diatomic Molecules, Van Nostrand Reinhold, New York, 2nd edn., 1950.
22 H. Lampert, W. Mikenda and A. Karpfen, J. Phys. Chem. A, 1997, 101, 2254.
23 G. Keresztury, J. Phys. Chem. A, 1998, 102, 1371.
24 W.-C. Wu, C.-C. Chuang and J.-L. Lin, J. Phys. Chem. B, 2000, 104, 8719.
25 C. Su, J.-C. Yeh, C.-C. Chen, J.-C. Lin and J.-L. Lin, J. Catal., 2000, 194, 45.
26 W.-C. Wu, L.-F. Liao, J.-S. Shiu and J.-L. Lin, Phys. Chem. Chem. Phys., 2000, 2, 4441.
27 D. H. Whi†en, J. Chem. Soc., 1956, 1350.
28 H. Einaga, S. Futamura and T. Ibusuki, Phys. Chem. Chem. Phys., 1991, 1, 4903.
29 K. Okamoto, H. Tanaka, M. Tanaka and A. Itaya, Bull. Chem. Soc. Jpn., 1985, 58, 2015.
30 Y. Ohko, K. Hashimoto and A. Fujishima, J. Phys. Chem. A, 1997, 101, 8057.
31 F. Williams and A. J. Nozik, Nature, 1978, 271, 137.
32 A. J. Nozik, D. S. Boudreaux, R. R. Chance and F. Williams, Interfacial Photoprocess : Energy Conversion and Synthesis, Amer-ican Chemical Society, Washington, DC, 1980.