Relative risks of CKD for mortality and ESRD across Asians, whites and blacks: An examination of 45 cohorts with one million subjects
Chi-Pang Wen, MD, MPH, DrPH1,2, Kunihiro Matsushita, MD, PhD3, Josef Coresh, MD, PhD3, Kunitoshi Iseki, MD4, Muhammad Islam, MSc5, Ronit Katz, DPhil6, William
McClellan7, Carmen A Peralta, MD, MAS8, HaiYan Wang, MD9, Dick de Zeeuw, MD, PhD10, Brad C Astor, PhD11,12, Ron T Gansevoort, MD, PhD13, Andrew S Levey, MD14, Adeera Levin, MD15, for the Chronic Kidney Disease Prognosis Consortium
1 Institute of Population Science, National Health Research Institutes, Zhunan, Taiwan; 2 China Medical University Hospital, Taichung, Taiwan; 3 Department of Epidemiology, Johns Hopkins Bloomberg School of Public Health, Baltimore, Maryland, USA; 4 Dialysis Unit, University Hospital of The Ryukyus, Nishihara, Okinawa, Japan; 5 Department of Community Health Sciences, The Aga Khan University, Karachi, Pakistan; 6 Department of Biostatistics, University of Washington, Seattle, Washington, USA; 7 Department of Medicine, Emory University School of Medicine, Atlanta, Georgia, USA; 8 Division of Nephrology, University of California, San Francisco, California, USA; 9 Renal Division, Department of Medicine, Peking University First Hospital, Institute of Nephrology, Peking University, Key Laboratory of Renal Disease, Ministry of Health of China, Beijing, China; 10 Department of Clinical Pharmacology, University of Groningen, University Medical Center Groningen, Groningen, the Netherlands; 11 Department of Medicine, University of Wisconsin School of Medicine and Public Health, Madison, Wisconsin, USA; 12 Department of Population Health Sciences, University of Wisconsin School of Medicine and Public Health, Madison, Wisconsin, USA; 13 Department of Nephrology, University Medical Center Groningen, University of Groningen, Groningen, the Netherlands; 14 Division of Nephrology, Tufts Medical Center, Boston, Massachusetts, USA; 15 Division of Nephrology UBC, St. Pauls Hospital, Vancouver, British Columbia, Canada
Correspondence to: Chronic Kidney Disease Prognosis Consortium Data Coordinating Center (Principal Investigator, Josef Coresh, MD, PhD), 615 N Wolfe Street, Baltimore, MD 21205 ckdpc@jhmi.edu
Funding/Support: The CKD-PC Data Coordinating Center is funded in part by a program grant from the US National Kidney Foundation (NKF funding sources include Abbott) and an investigator initiated research grant from Amgen. A variety of sources have supported
enrollment and data collection including laboratory measurements, and follow-up in the collaborating cohorts of the CKD-PC. These funding sources include government agencies such as national institutes of health and medical research councils as well as foundations and
industry sponsors listed in Appendix 3. The funders had no role in the design, analysis, interpretation of this study, and did not contribute to the writing of this report and the decision to submit the article for publication.
Role of the Sponsor: The sponsors had no role in the design and conduct of the study; in the collection, analysis, and interpretation of the data; or in the preparation, review, or approval of the manuscript.
Running Head: CKD and clinical risk across races
Word count: Text 3309 words including abstract (216 words) Number of Tables: 1
Number of Figures: 4
Abstract
Some suggest race-specific cutpoints for kidney measures to define and stage chronic kidney disease (CKD), but evidence for race-specific clinical impact is limited. In 1.1 million adults (75% Asians, 21% whites, and 4% blacks) from 45 cohorts, we compared hazard ratios (HRs) of estimated glomerular filtration rate (eGFR) and albuminuria across races using meta- regression. Results came mainly from 25 general population cohorts (n=.9 million). The associations of lower eGFR and higher albuminuria with mortality and end-stage renal disease (ESRD) were largely similarly across races. For example, in Asians, whites, and, blacks, the adjusted HR (95% CI) for eGFR 45-59 (vs. 90-104) ml/min/1.73m2 was 1.3 (1.2-1.3), 1.1 (1.0-1.2) and 1.3 (1.1-1.7) for all-cause mortality, 1.6 (1.5-1.8), 1.4 (1.2-1.7), and 1.4 (0.7-2.9) for cardiovascular mortality, and 27.6 (11.1-68.7), 11.2 (6.0-20.9), and 4.1 (2.2-7.5) for ESRD, respectively. The corresponding HRs for urine albumin-to-creatinine ratio (ACR) 30- 299 mg/g or dipstick 1+ (vs. <10 or dipstick -) were 1.6 (1.4-1.8), 1.7 (1.5-1.9) and 1.8 (1.7- 2.1) for all-cause mortality, 1.7 (1.4-2.0), 1.8 (1.5-2.1), and 2.8 (2.2-3.6) for cardiovascular mortality, and 7.4 (2.0-27.6), 4.0 (2.8-5.9), and 5.6 (3.4-9.2) for ESRD, respectively. In conclusion, the relative mortality or ESRD risks of lower eGFR and higher albuminuria were largely similar among three major races, supporting similar clinical approach to CKD
definition and staging, across races.
Introduction
Chronic kidney disease (CKD) is a global public health problem,1-3 affecting 10 to 16% of the adult population in several continents4-7 and increasing the risk of adverse outcomes.8-12 The definition and staging of CKD is based on the level of glomerular filtration rate (GFR) and the presence of kidney damage, usually ascertained as albuminuria. However, the comparability of GFR and albuminuria measures across racial groups and their relationship with risk has not been fully explored,14 although some have suggested race-specific thresholds for GFR and albuminuria to define and stage CKD.15 The primary objective of this study was to evaluate whetherquantify the associations of GFR and albuminuria with risk for all-cause and
cardiovascular mortality, and ESRD differ among Asians, whites, and blacks, three major races in the world, and assess whether there are any substantial differences across these races.
Results
Study populations
A total of 1,102,581 individuals were studied, including 75% Asians (mostly Eastern Asians), 21% whites and 4% blacks. Majority of the study population, 85% or 933,720
individuals, were from 25 general population cohorts, with remaining 12% or 132,566 individuals from 7 high-risk cohorts, and 3% or 36,295 individuals from 13 CKD cohorts (Table 1). Thus, our primary analyses were conducted in the general population cohorts, and results for the high-risk cohorts and CKD cohorts were shown in supplemental materials
separately. Asians comprised the majority of the general population cohorts (87%), but not
the high-risk (6%) or CKD (12%) cohorts, and mainly came from cohorts based on data from comprehensive health screening programs for the healthy population. Accordingly, Asians tended to have a lower risk profile (younger age and lower prevalence of comorbid
conditions) as compared to whites and blacks. While most Asians were from Asian cohorts, most blacks were from US cohorts. There were differences in the methods for ascertainment of albuminuria among the general population cohorts: only 1% of Asians had ACR data, while ACR data were available in 73% of whites and 100% of blacks included in the meta- analysis, reflecting different medical and research settings.
eGFR and albuminuria distributions by race
In the general population cohorts, the crude prevalence of reduced eGFR (<60 ml/min/1.73 m2) in Asians, whites and blacks was 5.1%, 15.8%, and 9.4% respectively (Figure 1A). The prevalence of elevated albuminuria (≥30 mg/g by ACR or ≥1+ by urine dipstick) in the three races was 2.8%, 9.7% and 16.8%, respectively (Figure 1B). The
difference in prevalence of reduced eGFR and elevated albuminuria across racial groups was attenuated after age standardization, particularly for reduced eGFR (Figure 1C-D). In the high-risk cohorts, the crude prevalence of decreased eGFR and high albuminuria were 11.1%
and 23.9% in Asians, 17.8% and 20.4% in whites, and 10.2% and 13.3% in blacks, respectively (Figure S1).
Incidence rates of mortality and ESRD by race
We observed xx all-cause deaths and xx CVD deaths in Asians (mean follow-up of x.x years), xx and xx cases in whites (mean follow-up of x.x years), and xx and xx cases in whites (mean follow-up of x.x years) (Table S1). Crude rates for all-cause and CVD mortality in the
general population cohorts were 5.9 and 1.4 per 1,000 person-years in Asians, 24.1 and 10.4 in whites, and 18.7 and 5.5 in blacks, respectively (Figure S2). After age-standardization, mortality rates were higher in blacks compared to whites, while the lower rates in Asians persisted. The variation in mortality rates was as great among studies within races as among races within studies. Among the studies with data on ESRD, crude incidence rates of ESRD per 1,000 person-years were 0.3 in Asians, 0.8 in whites, and 2.8 in blacks.
Independent relationships of eGFR and albuminuria to clinical risk by race
Figure 2 shows HRs for all-cause mortality, CVD mortality, and ESRD in the general population cohorts by race for eGFR from 15 to 120 ml/min/1.73 m2 compared to the
reference point at eGFR 95 ml/min/1.73 m2. The patterns for each outcome were qualitatively similar among three races across most of the range of eGFR, with higher risk at lower eGFR.
eGFR thresholds below which the HRs were significantly greater than the reference point, partially due to difference in the precision of estimates across races, the HR reached
significance at eGFR between 60 and 75 ml/min/1.73 m2 in most analyses and did not differ significantly for a given eGFR among races, except for small ranges noted at the bottom of Figure 2. For ESRD, the threshold eGFR varied from 65 to 83 ml/min/1.73 m2 for all three
races, although the pattern was least steep in blacks for eGFR <30 ml/min/1.73 m2.
Figure 3 shows HRs for all three outcomes by races according to albuminuria categories (ACR 10-29, 30-299 and ≥300 mg/g or urine dipstick levels negative, trace, 1+ and ≥2+, respectively) (Figure S3 shows the association for ACR as a continuous variable). Again, the patterns for each outcome were similar among races, with higher HRs for higher albuminuria.
The only significant difference was higher CVD mortality in blacks with ACR 30-299 mg/g.
In all races, the threshold category above which the HRs for mortality outcomes was significantly greater than the reference category was ACR ≥10 mg/g or dipstick ≥trace.
Although data were limited, the independent associations of low eGFR and high albuminuria with three outcomes were largely similar across three races in both high-risk and CKD cohorts (Figures S4-S7).
Combined relationships of eGFR and albuminuria to clinical risk by race
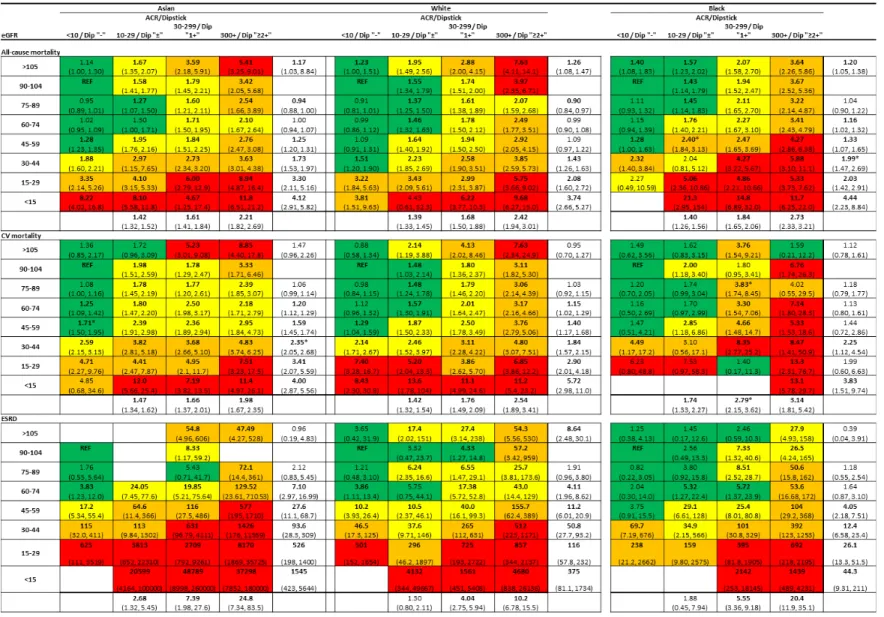
Figure 4 shows the adjusted HRs for all-cause mortality, CVD mortality, and ESRD in the general population cohorts by eGFR and albuminuria categories compared to the reference
categories of eGFR 90-104 ml/min/1.73 m2 and ACR <10 mg/g or dipstick negative.
Consistent with the results in Figures 2-3, all-cause mortality risks for eGFR categories and albuminuria categories (marginal rows and columns in Figure 4) were similar for Asians, whites, and blacks. For example, in Asians, whites, and blacks, compared to eGFR 90-104 ml/min/1.73 m2, the HR [95% CI] for eGFR 45-59 ml/min/1.73 m2 was 1.25 (1.20-1.31), 1.09 (0.97-1.22) and 1.33 (1.07-1.65) for all-cause mortality, 1.59 (1.46-1.75), 1.40 (1.17-1.68), and 1.44 (0.72-2.86) for cardiovascular mortality, and 27.6 (11.1-68.7), 11.2 (6.01-20.9), and 4.05 (2.18-7.51) for ESRD, respectively. The corresponding HRs for ACR 30-299 mg/g or dipstick (1+) compared to ACR <10 mg/g or dipstick (-),were 1.61 (1.41-1.84), 1.68 (1.50- 1.88) and 1.84 (1.65- 2.06) for all-cause mortality, 1.66 (1.37-2.02), 1.76 (1.49-2.09), and 2.79 (2.15-3.62) for cardiovascular mortality, and 7.39 (1.98-27.6), 4.04 (2.75-5.94), and 5.55 (3.36-9.18) for ESRD, respectively. The HRs were quantitatively consistent across most of the studies for three outcomes (Figures Sx8-S10).
The pattern for categories based on eGFR and albuminuria (cells in Figure 4) was also qualitatively similar among the three races, showing a multiplicatively higher risk for lower eGFR and higher albuminuria, with limited interactions. Of note, the category of eGFR 45-59 with lowest albuminuria was associated with a point estimate for the HR >1.0 compared to the reference groups for all three outcomes for all three races (statistically significant in 7 of 9 comparisons). The category of elevated albuminuria (ACR 30-299 mg/g or urine dipstick 1+)
with eGFR 90-104 was associated with a point estimate for the HR >1.0 compared to the reference groups for all 9 comparisons (statistically significant in 8). Similar results were observed for cardiovascular mortality and ESRD. Largely similar results were also observed across three races in both high-risk and CKD cohorts (Figures S8 S11 and S9S12).
Discussion
Low eGFR and high albuminuria were both independently associated with an increased risk of mortality and ESRD. In this unique and large meta-analysis, we observed qualitatively similar adjusted HR for all-cause and cardiovascular mortality and ESRD according to eGFR or albuminuria across three major races, Asian, white and black, in general population
cohorts, despite differences in demographic and clinical characteristics (Table 1) and absolute risk (Figure S2) among racial groups and cohorts. The consistency in eGFR and albuminuria risk relationships across races has important implications for clinical practice, research and
public health.
The best known racial disparities in kidney disease are the widely different ESRD rates among countries reported by USRDS.16 Our results describing highest ESRD rates in blacks are consistent with other studies.17-20 It is more difficult to study racial differences in earlier stages of CKD. There have not been large studies of multi-racial populations that have simultaneously assessed eGFR and albuminuria regarding their associations with mortality and ESRD. In addition, methods to estimate GFR and ascertain albuminuria have varied, and
many studies reported only eGFR or albuminuria. While our study has a wide variation in demographic and clinical characteristics among cohorts, the availability of both eGFR and
albuminuria measurements permits a more robust analyses.
Prior reports from the CKD-PC, using comparable methods across cohorts, showed similar impact of eGFR and albuminuria categories on relative risks of all-cause and cardiovascular mortality and ESRD across subgroups defined by demographic and clinical characteristics (age,21 sex,22 hypertension,23 and diabetes24). The current analysis expands our prior observations to race groups, and establishes a consistency of the relationship of eGFR and albuminuria to important outcomes irrespective of race. Given the increasing interest in variability of incidence rates of ESRD across countries and races and the major resource implications associated with high ESRD rates, it will be important to pursue the causes for the differences in distribution of cardiovascular risk factors, eGFR and albuminuria that we observed among the racial groups. Specifically, it will be important to determine the extent to which social, environmental and genetic differences result in variation in disease expression and outcomes (such as the higher prevalence of IgA nephropathy in Asiaand the contribution of economic aspects to variation in dialysis care).2526 Better understanding of the similarities
and differences across races should direct research to identify modifiable factors.
The GFR thresholds for the definition and staging of CKD were first proposed in 2002, using data derived predominantly from a general US population.1 In the last decade, these
eGFR thresholds have been incorporated into clinical guidelines in other countries. The recognition of albuminuria as an independent risk factor for adverse outcomes has now led to the incorporation of albuminuria categories into CKD staging, and this analysis has utilized the new recommendations for categories of albuminuria and eGFR.29 The robust relationship of eGFR and albuminuria to outcomes irrespective of race gives additional credence to their use in clinical arenas and beyond. Given the complexity of using race-specific thresholds of kidney measures in clinical practice, there would need to be strong evidence for justification
to support their adoption.
Standardization of methods for ascertainment of GFR and albuminuria remains a challenge. Specification of race improves the accuracy of creatinine-based GFR estimating equations by adjusting for differences in creatinine generation due to variation in muscle mass and diet. Current guidelines recommend the CKD-EPI creatinine equation for use in North American, Europe and Australia, which estimates GFR ~16% higher for blacks compared to other races at a given age, gender and level of serum creatinine.30 In our study, the CKD-EPI creatinine equation demonstrates similar eGFR-risk association in Asians, whites, and blacks, providing further support for its usefulness across racial groups and encouraging more
widespread reporting of eGFR around the world. Other equations have been developed in Japanese, Taiwanese, and Chinese, but their generalizability has not been evaluated in large studies.31-34 In our consortium, the selection of ACR vs. dipstick for assessment of albuminuria
varies across regions/cohorts and is largely based on study objectives and resources (with ACR being used most commonly in North America, Europe and Australia and dipsticks being most used commonly in Asia). Therefore, we could not assess the influence of urinary
creatinine per se, which may vary substantially across races, on the association between ACR and clinical risk.35 Nevertheless, this study confirms the usefulness of both methods in relating
albuminuria with outcomes, thus supporting the use of either method in clinical practice.
Strengths of our study include an international consortium with a wide range of cohorts in various settings, comprehensive data on eGFR and albuminuria, a large study population, and the assessment of both mortality and ESRD. Also, tThese cohorts were not selected for previous publication regarding the study question, thereby minimizing the possibility of publication bias. The analysis was centrally coordinated, and adjustment for important
variables was uniformly carried out in all cohorts. Our continuous analysis using splines allowed inspection of the pattern of association across the entire range of eGFR, irrespective of the reference point used. The categorical analysis allowed combining across cohorts that
assessed albuminuria using ACR and dipstick and provided clinically useful information.
There are several limitations in our study. Measurements of creatinine and urine albumin were not standardized in all studies, and we did not have data on measured GFR, cystatin C or 24-h albumin excretion rate to confirm eGFR, urine ACR or dipstick.36 Only a few Asian cohorts had ACR measurements, and none of them ascertained ESRD as an
outcome. Most of the blacks in our study were from cohorts in the US and not from the blacks in Africa. Most Asians were in East Asian cohorts, and we could not compare East and South Asians. Few cohorts included multiple racial groups. Further analyses will be required for Hispanics and other racial/ethnic groups not represented in this study. We cannot rule out the possibility of residual confounding due to unevaluated variables in this study such as lifestyle
(e.g., diet or physical activity) or socioeconomic status including access to health care.
Despite wide variability in clinical characteristics among cohorts and lower risk profile in Asian cohorts, there were no substantial differences among Asians, whites and blacks in the independent and joint associations of reduced eGFR, based on the CKD-EPI creatinine equation, and albuminuria, based on ACR or dipstick, with all-cause and CVD mortality and ESRD. These results support the use of existing eGFR equations for risk categorization, and thresholds of eGFR and albuminuria for CKD definition and staging across these racial groups.
Methods Study design
Details of the Chronic Kidney Disease Prognosis Consortium (CKD-PC) were described previously.8-12 To be included in the consortium, a study had to have at least 1,000 participants (not applied to studies predominantly enrolling CKD patients [CKD cohorts]9), information at baseline on eGFR and albuminuria, and a minimum of 50 events for any of the outcomes of
interest. This analysis consists of data from 45 cohorts (25 general population cohorts, 7 high- risk cohorts with high-risk participants selected for cardiovascular or kidney disease risk factors, and 13 CKD cohorts) (Table 1, Table S1, and Appendix 1). This study is based on secondary data analysis of pre-existing, de-identified/de-linked dataset, and was approved by the Institutional Review Board at the Johns Hopkins Bloomberg School of Public Health.
Study variables
GFR was estimated using the CKD-EPI creatinine equation: 141 × (minimum of
standardized serum creatinine [mg/dL]/κ or 1)α × (maximum of standardized serum creatinine [mg/dL]/κ or 1)-1.209 × 0.993age × (1.018 if female) × (1.159 if black), where κ is 0.7 if female and 0.9 if male and α is -0.329 if female and -0.411 if male. For studies in which creatinine measurement was not standardized to isotope dilution mass spectrometry (IDMS), we reduced the creatinine levels by 5%, the calibration factor used to adjust non-standardized MDRD Study samples to IDMS.39 While urine albumin-to-creatinine ratio (ACR) is the preferred measure of albuminuria in the clinical settings, the semi-quantitative measurement using urine dipstick in mass screening the healthy population has also been reported to be highly
valuable.40 A few studies that reported urine albumin excretion or urine protein-to-creatinine ratio (PCR) were also included.1 Race/ethnicity was categorized as white, Asian, black, Hispanic, and others. Due to sparse data, we could not reliably investigate Hispanics and other
racial/ethnic groups (Table S1) and thus their results were not shown. Diabetes mellitus was defined as fasting glucose ≥7.0 mmol/L, non-fasting glucose ≥11.1 mmol/L, hemoglobin A1c
≥6.5%, use of glucose lowering drugs, or self-reported diabetes. Hypertension was defined as systolic blood pressure ≥140 mmHg or diastolic blood pressure ≥90 mmHg, use of
antihypertensive medication or self-reported hypertension. Hypercholesterolemia was defined as total cholesterol ≥5.0 mmol/L in people with prior CVD and as ≥6.0 mmol/L otherwise or use of lipid lowering drugs. CVD history was defined as a history of myocardial infarction, coronary revascularization, heart failure or stroke. Body mass index (BMI) was calculated as weight (kg) divided by square height (m). Smoking was dichotomized as current versus former/non-smokers. All of these study variables were assessed at baseline in every cohort.
Outcomes
The three outcomes of interest were all-cause mortality, cardiovascular mortality, and ESRD. Cardiovascular mortality was defined as death due to myocardial infarction, heart failure, sudden cardiac death, or stroke. ESRD was defined as start of renal replacement therapy or death due to kidney disease. However, given its unique pathophysiology, death due to other than acute kidney injury was not included.
Statistical analyses
Analyses were restricted to subjects aged 18 years or older. Any subject with missing values for eGFR, albuminuria, and race/ethnicity was excluded. Missing values for all other covariates were imputed by the cohort mean. Age adjustment for distribution of kidney measures and incidence rate of three outcomes was performed by direct standardization using US NHANES III as reference population, the only cohort in the consortium representing national data by design. The analysis overview and analytic notes for individual studies are
described in Appendix 2.
We subsequently conducted a series of analyses stratified by racial/ethnic groups. We used a two-stage approach, in which statistics were first obtained in each study and then were meta-analyzed estimates of each racial/ethnic group across studies by a random-effects model.
General population, high-risk and CKD cohorts were meta-analyzed separately. Heterogeneity was quantified using the χ2 test for heterogeneity and the I2 statistic. All analyses were conducted using Stata/MP 11.2 software (www.stata.com) and a P-value of less than 0.05 was
considered statistically significant.
Cox proportional hazards models were used to estimate the hazard ratios (HRs) of clinical outcomes associated with eGFR and albuminuria, adjusted for age, sex, history of CVD, smoking, systolic blood pressure (continuous), diabetes, serum total cholesterol concentration (continuous), BMI (continuous), and either eGFR or albuminuria as appropriate. Death was censored for ESRD analysis. Since few studies have multiple
racial/ethnic groups, incorporating interaction terms between kidney measures and race in models was not practical. Therefore, meta-regression analysis with a random-effects model was used to formally compare HRs according to eGFR and albuminuria across racial/ethnic groups.41 We modeled eGFR and ACR using linear splines with knots at 30, 45, 60, 75, 90, and 105 ml/min/1.73 m2 (105 is not implemented for CKD cohorts) and 10, 30, and 300 mg/g (30, 300, and 1000 mg/g was implemented for CKD cohorts but not 10) (to convert to
mg/mmol multiply by 0.113), respectively. eGFR 95 ml/min/1.73 m2 (50 for CKD cohorts)
and ACR 5 mg/g (100 for CKD cohorts) were treated as reference points.
We also compared the risk in categories of eGFR (<15, 15-29, 30-44, 45-59, 60-74, 75-89, 90-104, ≥105 ml/min/1.73 m2) and albuminuria (ACR: <10, 10-29, 30-299, ≥300 mg/g; PCR:
<20, 20-49, 50-499, ≥500 mg/g; dipstick: negative [-], trace [±], +, ≥++) and their
combination. For CKD cohorts, the following categories were used for eGFR (<15, 15-29, 30- 44, 45-74, 75-89, ≥90 ml/min/1.73 m2) and albuminuria (ACR: <30, 30-299, 300-999, ≥1000 mg/g; PCR: <50, 50-499, 500-1999, ≥2000 mg/g; dipstick: negative/trace, +, ++, ≥+++). The category with eGFR 90-104 ml/min/1.73 m2 (45-74 for CKD cohorts) and the lowest
albuminuria was used as the reference group. Given that few Asian cohorts had ACR data, results for albuminuria were primarily shown for categories.
Disclosure
All authors have completed the Unified Competing Interest form at
www.icmje.org/coi_disclosure.pdf (available on request from the corresponding author)
References
1. Eknoyan G, Levin NW. K/DOQI clinical practice guidelines for chronic kidney disease: Evaluation, classification, and stratification - Foreword. Am J Kidney Dis 2002; 39: S14-S266.
2. Levey AS, Atkins R, Coresh J, et al. Chronic kidney disease as a global public health problem:
Approaches and initiatives - A position statement from Kidney Disease Improving Global Outcomes.
Kidney Int 2007; 72: 247-259.
3. Crowe E, Halpin D, Stevens P. Guidelines: Early Identification and Management of Chronic Kidney Disease: Summary of NICE Guidance. BMJ 2008; 337: 812-815.
4. Chadban SJ, Briganti EM, Kerr PG, et al. Prevalence of kidney damage in Australian adults: The AusDiab kidney study. J Am Soc Nephrol 2003; 14: S131-S138.
5. Hallan SI, Coresh J, Astor BC, et al. International comparison of the relationship of chronic kidney disease prevalence and ESRD risk. J Am Soc Nephrol 2006; 17: 2275-2284.
6. Coresh J, Selvin E, Stevens LA, et al. Prevalence of chronic kidney disease in the United States. JAMA 2007; 298: 2038-2047.
7. Wen CP, Cheng TY, Tsai MK, et al. All-cause mortality attributable to chronic kidney disease: a prospective cohort study based on 462 293 adults in Taiwan. Lancet 2008; 371: 2173-2182.
8. Matsushita K, van der Velde M, Astor BC, et al. Association of estimated glomerular filtration rate and albuminuria with all-cause and cardiovascular mortality in general population cohorts: a collaborative meta-analysis. Lancet 2010; 375: 2073-2081.
9. Astor BC, Matsushita K, Gansevoort RT, et al. Lower estimated glomerular filtration rate and higher albuminuria are associated with mortality and end-stage renal disease. A collaborative meta-analysis of kidney disease population cohorts. Kidney Int 2011; 79: 1331-1340.
10. Gansevoort RT, Matsushita K, van der Velde M, et al. Lower estimated GFR and higher albuminuria are associated with adverse kidney outcomes in both general and high-risk populations. A collaborative meta-analysis of general and high-risk population cohorts. Kidney Int 2011; 80: 93-104.
11. Levey AS, de Jong PE, Coresh J, et al. The definition, classification, and prognosis of chronic kidney disease: a KDIGO Controversies Conference report. Kidney Int 2011; 80: 17-28.
12. van der Velde M, Matsushita K, Coresh J, et al. Lower estimated glomerular filtration rate and higher albuminuria are associated with all-cause and cardiovascular mortality. A collaborative meta-analysis of high-risk population cohorts. Kidney Int 2011; 79: 1341-1352.
13. Tonelli M, Muntner P, Lloyd A, et al. Using proteinuria and estimated glomerular filtration rate to classify risk in patients with chronic kidney disease: a cohort study. Ann Intern Med 2011; 154: 12-21.
14. de Zeeuw D, Ramjit D, Zhang Z, et al. Renal risk and renoprotection among ethnic groups with type 2 diabetic nephropathy: a post hoc analysis of RENAAL. Kidney Int 2006; 69: 1675-1682.
15. Winearls CG, Glassock RJ. Dissecting and refining the staging of chronic kidney disease. Kidney Int 2009; 75: 1009-1014.
16. US Renal Data System. USRDS 2012 Annual Data Report: Atlas of Chronic Kidney Disease and End- Stage Renal Disease in the United States. National Institutes of Health, National Institute of Diabetes and Digestive and Kidney Diseases: Bethesda, MD, 2012.
17. Conley J, Tonelli M, Quan H, et al. Association Between GFR, Proteinuria, and Adverse Outcomes Among White, Chinese, and South Asian Individuals in Canada. Am J Kidney Dis 2012; 59: 390-399.
18. Jolly SE, Burrows NR, Chen SC, et al. Racial and ethnic differences in mortality among individuals with chronic kidney disease: results from the Kidney Early Evaluation Program (KEEP). Clin J Am Soc Nephrol 2011; 6: 1858-1865.
19. Barbour SJ, Er L, Djurdjev O, et al. Differences in progression of CKD and mortality amongst Caucasian, Oriental Asian and South Asian CKD patients. Nephrol Dial Transplant 2010; 25: 3663- 3672.
20. Mehrotra R, Kermah D, Fried L, et al. Racial Differences in Mortality Among Those with CKD. J Am Soc Nephrol 2008; 19: 1403-1410.
21. Hallan SI, Matsushita K, Sang Y, et al. Age and Association of Kidney Measures With Mortality and End-stage Renal Disease. JAMA 2012; 308: 2349-2360.
22. Nitsch D, Grams ME, Sang Y, et al. Associations of estimated glomerular filtration rate and albuminuria with mortality and renal failure by sex: a meta-analysis. BMJ 2013; 346: f324.
23. Mahmoodi BK, Matsushita K, Woodward M, et al. Associations of kidney disease measures with mortality and end-stage renal disease in individuals with and without hypertension: a meta-analysis.
Lancet 2012; 380: 1649-1661.
24. Fox CS, Matsushita K, Woodward M, et al. Associations of kidney disease measures with mortality and end-stage renal disease in individuals with and without diabetes: a meta-analysis. Lancet 2012; 380:
1662-1673.
25. Yamagata K, Iseki K, Nitta K, et al. Chronic kidney disease perspectives in Japan and the importance of urinalysis screening. Clin Exp Nephrol 2008; 12: 1-8.
26. Devereaux PJ, Schunemann HJ, Ravindran N, et al. Comparison of mortality between private for-profit and private not-for-profit hemodialysis centers: a systematic review and meta-analysis. JAMA 2002;
288: 2449-2457.
27. Japanese Society of Nephrology. Evidence-based Practice Guideline for the Treatment of CKD. Clin Exp Nephrol 2009; 13: 537-566.
28. Levin A, Hemmelgarn B, Culleton B, et al. Guidelines for the management of chronic kidney disease.
Can Med Assoc J 2008; 179: 1154-1162.
29. Kidney Disease: Improving Global Outcomes (KDIGO) CKD Work Group. KDIGO 2012 Clinical Practice Guideline for the Evaluation and Management of Chronic Kidney Disease. Kidney Int 2013;
Suppl. 3: 1-150.
30. Earley A, Miskulin D, Lamb EJ, et al. Estimating Equations for Glomerular Filtration Rate in the Era of Creatinine Standardization: A Systematic Review. Ann Intern Med 2012; 156: 785-795.
31. Horio M, Imai E, Yasuda Y, et al. Modification of the CKD Epidemiology Collaboration (CKD-EPI) Equation for Japanese: Accuracy and Use for Population Estimates. Am J Kidney Dis 2010; 56: 32-38.
32. Teo BW, Xu H, Wang DH, et al. GFR Estimating Equations in a Multiethnic Asian Population. Am J Kidney Dis 2011; 58: 56-63.
33. Du X, Hu B, Jiang L, et al. Implication of CKD-EPI Equation to Estimate Glomerular Filtration Rate in Chinese Patients with Chronic Kidney Disease. Ren Fail 2011; 33: 859-865.
34. Stevens LA, Claybon MA, Schmid CH, et al. Evaluation of the Chronic Kidney Disease Epidemiology Collaboration equation for estimating the glomerular filtration rate in multiple ethnicities. Kidney Int 2011; 79: 555-562.
35. Carter CE, Gansevoort RT, Scheven L, et al. Influence of urine creatinine on the relationship between the albumin-to-creatinine ratio and cardiovascular events. Clin J Am Soc Nephrol 2012; 7: 595-603.
36. Inker LA, Schmid CH, Tighiouart H, et al. Estimating glomerular filtration rate from serum creatinine and cystatin C. N Engl J Med 2012; 367: 20-29.
37. Levey AS, Stevens LA, Schmid CH, et al. A new equation to estimate glomerular filtration rate. Ann Intern Med 2009; 150: 604-612.
38. Matsushita K, Mahmoodi BK, Woodward M, et al. Comparison of risk prediction using the CKD-EPI equation and the MDRD study equation for estimated glomerular filtration rate. JAMA 2012; 307:
1941-1951.
39. Levey AS, Coresh J, Greene T, et al. Expressing the Modification of Diet in Renal Disease Study Equation for Estimating Glomerular Filtration Rate with Standardized Serum Creatinine Values. Clin Chem 2007; 53: 766-772.
40. Wen CP, Yang YC, Tsai MK, et al. Urine Dipstick to Detect Trace Proteinuria: An Underused Tool for an Underappreciated Risk Marker. Am J Kidney Dis 2011; 58: 1-3.
41. Thompson S, Kaptoge S, White I, et al. Statistical methods for the time-to-event analysis of individual participant data from multiple epidemiological studies. Int J Epidemiol 2010; 39: 1345-1359.
Titles and legends
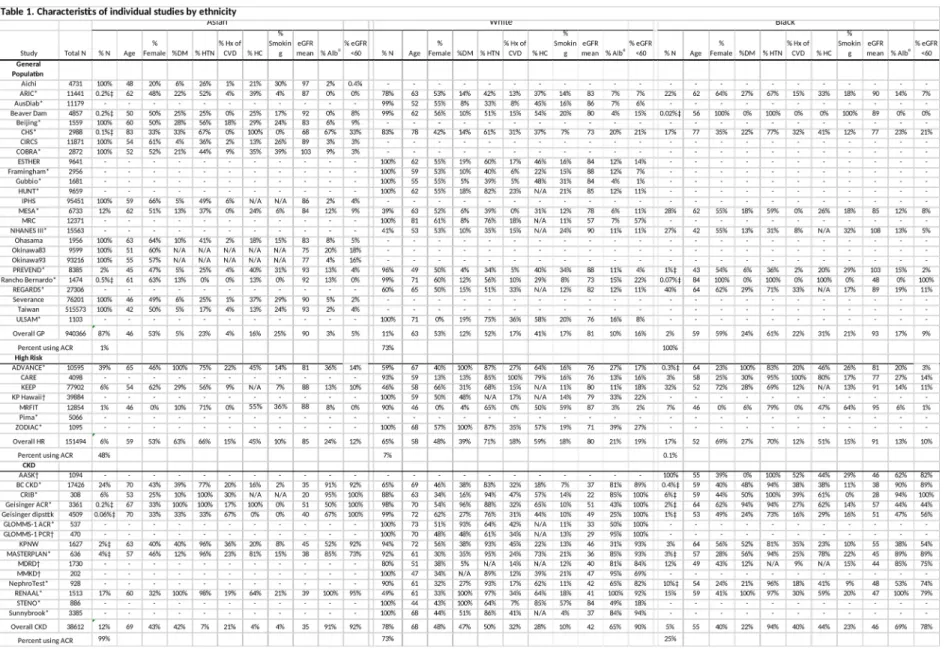
Table 1. Characteristics of individual studies by ethnicity (Asian, white, and black)
Figure 1. Crude and age-standardized distribution of eGFR and albuminuria across races in general population cohorts. Panels A (eGFR) and B (albuminuria) show crude distribution, while panels C (eGFR) and D (albuminuria) are adjusted for age by direct standardization using US NHANES III as a reference population. Green, black, and red bars denote the proportions of Asian, white, and black populations, respectively.
Figure 2. Association of eGFR with all-cause mortality (A), cardiovascular mortality (B), and ESRD (C) across three racial groups in general population cohorts. The shaded area or
whiskers represent 95% CIs. The reference (diamond) is eGFR 95 mL/min/1.73m2. Dots represent statistically significant points. Difference in HR among racial groups were tested using meta-regression with whites as a reference, and stars along the bottom of each panel indicate a significant interaction at P<0.05. HRs were adjusted for age, sex, smoking, systolic blood pressure, history of cardiovascular disease, diabetes, serum total cholesterol
concentration, body mass index, and albuminuria.
Figure 3. Association of albuminuria with all-cause mortality (A), cardiovascular mortality (B), and ESRD (C) across three racial groups in general population cohorts. The whiskers represent 95% CIs. The reference category is ACR <10 mg/g or dipstick negative. Dots represent statistically significant points. Difference in hazard ratios (HR) among racial groups
were tested using meta-regression with whites as a reference. HRs were adjusted for age, sex, smoking, systolic blood pressure, history of cardiovascular disease, diabetes, serum total cholesterol concentration, body mass index, and eGFR categories.
Figure 4. Hazard ratios (HRs) of clinical outcomes according to eGFR and albuminuria categories across three racial groups in general population cohorts. Each number represents a pooled HR from meta-analysis adjusted for covariates and compared with the reference cell (REF) within each race. Bold numbers indicate statistical significance at P<0.05. Color shading indicates the strength of association (approximately one quarter of all cells across racial groups are shaded in each color; Green: low; yellow: mild; orange: moderate; red:
high). Difference in HR among racial groups were tested using meta-regression with whites as a reference, and stars (*) indicate a significant interaction at P<0.05.
Acknowledgements
A variation of this analysis was presented at the American Society of Nephrology Kidney Week 2012 (San Diego, CA, November 3, 2012).
CKD-PC investigators/collaborators (Appendix 1 lists the study acronyms):
AASK: Jackson T Wright, Jr, Lawrence Appel, Tom Greene, Brad C Astor; ADVANCE:
John Chalmers, Stephen MacMahon, Mark Woodward, Hisatomi Arima; Aichi: Hiroshi Yatsuya, Kentaro Yamashita, Hideaki Toyoshima, Koji Tamakoshi; ARIC: Josef Coresh, Brad C Astor, Kunihiro Matsushita, Yingying Sang; AusDiab: Robert C Atkins, Kevan R Polkinghorne, Steven Chadban; Beaver Dam CKD: Anoop Shankar, Ronald Klein, Barbara EK Klein, Kristine E Lee; Beijing Cohort: Haiyan Wang, Fang Wang, Luxia Zhang, Li Zuo, Lisheng Liu; British Columbia CKD: Adeera Levin, Ognjenka Djurdjev; CARE: Marcello Tonelli, Frank Sacks, Gary Curhan; CHS: Michael Shlipak, Carmen Peralta, Ronit Katz, Linda Fried; CIRCS: Hiroyasu Iso, Akihiko Kitamura, Tetsuya Ohira, Kazumasa Yamagishi;
COBRA: Tazeen H Jafar, Muhammad Islam, Juanita Hatcher, Neil Poulter, Nish Chaturvedi;
CRIB: Martin J Landray, Jonathan Emberson, Jonathan Townend, David C Wheeler;
ESTHER: Dietrich Rothenbacher, Hermann Brenner, Heiko Müller, Ben Schöttker;
Framingham: Caroline S Fox; Shih-Jen Hwang, James B Meigs; Geisinger: Robert M Perkins; GLOMMS-1 Study: Nick Fluck, Laura Clark, Gordon J Prescott, Angharad Marks,
Corri Black; Gubbio: Massimo Cirillo; HUNT: Stein Hallan, Knut Aasarød, Cecilia M Øien, Marie Radtke; IPHS: Fujiko Irie, Hiroyasu Iso, Toshimi Sairenchi, Kazumasa Yamagishi;
Kaiser Permanente NW: David H Smith, Jessica Weiss, Eric S Johnson, Micah L Thorp;
KEEP: Allan J Collins, Joseph A Vassalotti, Suying Li, Shu-Cheng Chen; KP Hawaii: Brian J Lee; MASTERPLAN: Jack F. Wetzels, Peter J Blankestijn, Arjan D van Zuilen; MDRD:
Mark Sarnak, Andrew S Levey, Lesley Inker, Vandana Menon; MESA: Michael Shlipak, Mark Sarnak, Carmen Peralta, Ronit Katz, Linda F Fried, Holly Kramer, Ian de Boer;
MMKD: Florian Kronenberg, Barbara Kollerits, Eberhard Ritz; MRC Older People: Paul Roderick, Dorothea Nitsch, Astrid Fletcher, Christopher Bulpitt; MRFIT: Areef Ishani, James Neaton; NephroTest: Marc Froissart, Benedicte Stengel, Marie Metzger, Jean-Philippe Haymann, Pascal Houillier, Martin Flamant; NHANES III: Brad C Astor, Josef Coresh, Kunihiro Matsushita; Ohasama: Takayoshi Ohkubo, Hirohito Metoki, Masaaki Nakayama, Masahiro Kikuya, Yutaka Imai; Okinawa 83/93: Kunitoshi Iseki; Pima Indian: Robert G Nelson, William C Knowler; PREVEND: Ron T Gansevoort, Paul E de Jong, Bakhtawar Khan Mahmoodi, Stephan JL Bakker; Rancho Bernardo: Simerjot Kaur Jassal, Elizabeth Barrett-Connor, Jaclyn Bergstrom; RENAAL: Hiddo J Lambers Heerspink, Barry Brenner, Dick de Zeeuw; Renal REGARDS: David G Warnock, Paul Muntner, Suzanne Judd, William McClellan; Severance: Sun Ha Jee, Heejin Kimm, Jaeseong Jo, Yejin Mok, Eunmi Choi; STENO: Peter Rossing, Hans-Henrik Parving; Sunnybrook: Navdeep Tangri, David
Naimark; Taiwan GP: Chi-Pang Wen, Sung-Feng Wen, Chwen-Keng Tsao, Min-Kuang Tsai; ULSAM: Johan Ärnlöv, Lars Lannfelt, Anders Larsson; ZODIAC: Henk J Bilo, Hanneke Joosten, Nanne Kleefstra, Klaas H Groenier, Iefke Drion
CKD-PC Steering Committee: Brad C Astor, Josef Coresh (Chair), Ron T Gansevoort, Brenda R Hemmelgarn, Paul E de Jong, Andrew S Levey, Adeera Levin, Kunihiro Matsushita, Chi-Pang Wen, Mark Woodward
CKD-PC Data Coordinating Center: Shoshana H Ballew (Coordinator), Josef Coresh (Principal investigator), Morgan Grams, Bakhtawar Khan Mahmoodi, Kunihiro Matsushita (Director), Yingying Sang (Lead programmer), Mark Woodward (Senior statistician);
administrative support: Laura Camarata, Xuan Hui, Jennifer Seltzer, Heather Winegrad.
Author Contributions
All authors had full access to the analysis reports and tables and take responsibility for the
integrity of the data and the accuracy of the data analysis
Conception and design: CP Wen, K Matsushita, J Coresh, BC Astor, RT Gansevoort, AS Levey, A Levin, CKD Prognosis Consortium
Analysis and interpretation of the data: CP Wen, K Matsushita, J Coresh, K Iseki, M Islam, R Katz, W McClellan, CA Peralta, H Wang, D de Zeeuw, BC Astor, RT Gansevoort, AS Levey,
A Levin, CKD Prognosis Consortium
Critical revision of the article for important intellectual content: CP Wen, K Matsushita, J Coresh, K Iseki, M Islam, R Katz, W McClellan, CA Peralta, H Wang, D de Zeeuw, BC
Astor, RT Gansevoort, AS Levey, A Levin, CKD Prognosis Consortium
Final approval of the article: CP Wen, K Matsushita, J Coresh, K Iseki, M Islam, R Katz, W McClellan, CA Peralta, H Wang, D de Zeeuw, BC Astor, RT Gansevoort, AS Levey, A
Levin, CKD Prognosis Consortium
Statistical expertise: K Matsushita, J Coresh, CKD Prognosis Consortium
Obtaining of funding: K Matsushita, J Coresh for the CKD Prognosis Consortium Administrative, technical, or logistic support: K Matsushita, J Coresh, CKD Prognosis Consortium
Collection and assembly of data: K Matsushita, J Coresh, CKD Prognosis Consortium
Table 1. Characteristics of individual studies by ethnicity (Asian, white, and black)
Abbreviations: eGFR, estimated glomerular filtration rate; CKD, chronic kidney disease; ACR, urine albumin-to-creatinine ratio; PCR, urine protein-to-creatinine ratio.
*Studies with ACR, †Studies with PCR.
‡Not included in meta-analysis due to small number of events (<10) in this racial group.
ɑProportion of participants with ACR ≥30 mg/g or PCR ≥50 mg/g or dipstick protein ≥1+.
Figure 1. Distribution of eGFR and albuminuria across races in general population cohorts
20
9 33 30
26 24 29 29
21
15 20
13
4.2 11
6
0.7 4.02.2 0.1 0.7 0.8
0.1 0.1 0.4 0
10 20 30 40 50
Proportion, %
<15 15-29 30-44 45-59 60-74 75-89 90-104 105
eGFR, ml/min/1.73m2 Asian
Whites Blacks
Crude eGFR Distribution
92
74
64
5 16 19
1.8 8
13
1.0 1.73.8 0
20 40 60 80 100
Proportion, %
<10/- 10-29/trace 30-299/+ 300/++
ACR/Dipstick
Asian Whites Blacks
Crude Albuminuria Distribution
20 35
27
12
4.2 0.3 1.3
0.0
51
23
15
7 1.1 3.0
0.2 0.5
22 30
28
14
4.7 0.2 0.9
0.1 10 20 30 40 50
Proportion, %
Asian Whites Blacks
Age-Standardized eGFR Distribution
78
15
6
1.1 70
17
10
2.7 92
5 1.9 1.0
20 40 60 80 100
Proportion, %
Asian Whites Blacks
Age-Standardized Albuminuria Distribution 33
B
D
Figure 3. Association of albuminuria by ethnicity with all-cause mortality (A), cardiovascular mortality (B), and ESRD (C) across three racial groups in general population cohorts
11.524Adjusted HR
<10/- 10-29/trace 30-299/+ 300/++
ACR(mg/g) or Dipstick Asian
Whites Blacks
Adjusted for traditional risk factors and eGFR categories Reference at ACR<10/Dipstick-
All-cause Mortality in General Population Cohorts
11.524Adjusted HR
<10/- 10-29/trace 30-299/+ 300/++
ACR(mg/g) or Dipstick Asian
Whites Blacks
Adjusted for traditional risk factors and eGFR categories Reference at ACR<10/Dipstick-
Cardiovascular Mortality in General Population Cohorts
1241664Adjusted HR
<10/- 10-29/trace 30-299/+ 300/++
ACR(mg/g) or Dipstick Asian
Whites Blacks
Adjusted for traditional risk factors and eGFR categories Reference at ACR<10/Dipstick-
End Stage Renal Disease in General Population Cohorts
A
B
C
Figure 4. Hazard ratios of clinical outcomes according to eGFR and albuminuria categories across three racial groups in general population cohorts.