行政院國家科學委員會專題研究計畫 成果報告
嵌入式無線多媒體健康照護整合系統之研製 研究成果報告(精簡版)
計 畫 類 別 : 個別型
計 畫 編 號 : NSC 98-2218-E-011-007-
執 行 期 間 : 98 年 08 月 01 日至 99 年 10 月 31 日 執 行 單 位 : 國立臺灣科技大學電子工程系
計 畫 主 持 人 : 林淵翔
計畫參與人員: 碩士班研究生-兼任助理人員:羅元隆 碩士班研究生-兼任助理人員:張堯舜 碩士班研究生-兼任助理人員:林志豐 碩士班研究生-兼任助理人員:游賀中 碩士班研究生-兼任助理人員:李文晉 碩士班研究生-兼任助理人員:詹前晊
報 告 附 件 : 出席國際會議研究心得報告及發表論文
處 理 方 式 : 本計畫涉及專利或其他智慧財產權,2 年後可公開查詢
中 華 民 國 100 年 01 月 14 日
0
行政院國家科學委員會補助專題研究計畫 ■成果報告
□期中進度報告 嵌入式無線多媒體健康照護整合系統之研製
計畫類別:■個別型計畫 □整合型計畫 計畫編號:NSC 98-2218-E-011-007 執行期間:98 年 8 月 1 日至 99 年 10 月 31 日 執行機構及系所:國立台灣科技大學 電子工程系
計畫主持人:林淵翔 國立台灣科技大學電子工程系 共同主持人:
計畫參與人員:李文晉 國立台灣科技大學電子工程研究所 羅元隆 國立台灣科技大學電子工程研究所 張堯舜 國立台灣科技大學醫學工程研究所 林志豐 國立台灣科技大學電子工程研究所 詹前晊 國立台灣科技大學電子工程研究所 游賀中 國立台灣科技大學醫學工程研究所
成果報告類型(依經費核定清單規定繳交):■精簡報告 □完整報告
本計畫除繳交成果報告外,另須繳交以下出國心得報告:
□赴國外出差或研習心得報告
□赴大陸地區出差或研習心得報告
■出席國際學術會議心得報告
□國際合作研究計畫國外研究報告
處理方式:除列管計畫及下列情形者外,得立即公開查詢
■涉及專利或其他智慧財產權,□一年■二年後可公開查詢 中 華 民 國 100 年 1 月 7 日
附件一
I
摘要
由於老人照護和個人健康管理越來越被重視,本計劃將結合具潛力及前瞻性的嵌入式多媒體系統 平台、生理訊號量測模組、無線網路(WLAN)和無線感測器網路(ZigBee)等技術,應用在現在未來都是 重要課題的居家健康照護上,提供整合多媒體娛樂及居家照護的解決方案。希望以銀髮族此廣大族群 的需求為目標,設計基於使用者為中心的健康照護裝置,提供更貼切的健康照護服務。我們的系統的 具體功能將包括:(1)適合銀髮族的人機操作介面設計(2)用藥時間提醒(3)血壓管理(4)即時生理信號監控 (5)多媒體(照片、MP3)播放等。
關鍵字:嵌入式系統、ZigBee、數位相框、健康照護、居家照護、健康管理、生理信號監測、遠距醫療
、無線病患監測
Abstract
Because of elderly care and individual wellness management to be taken more and more seriously, this plan will design and implement an embedded wireless multimedia healthcare integration system including the forward-looking embedded multimedia system platform, the physiological signal measuring module, wireless local area network (WLAN) and technologies, and wireless sensor network (ZigBee). The system will be applied to the important homecare topic in the present and in the future, that provides solution for the multimedia entertainment and the home health care. The goal of this proposal is based on the demand of silver-haired race, which designs the system providing a more appropriate health care service. Our system's concrete functions include: (1) the design of the man-machine operation interface to suit the silver-haired race, (2) the reminder of medication time, (3) the management of blood pressure, (4) real-time physiology signal monitoring, and (5) multimedia (picture, MP3) playing and so on.
Keywords: embedded system, ZigBee, digital photo frame, healthcare, home care, wellness management, physiological monitoring, telemedicine, wireless patient monitoring
1
前言:
「人口高齡化」問題已是全世界共有的現象。根據聯合國衛生組織訂定的標準,一個國家人民年 齡超過六十五歲的人口佔全國總人口的7%以上即稱為「老年化國家」。2005年美國65歲以上人口為3680 萬,占總人口的12.4%,在2010年後的二十年中,老年人口數將達最高峰。民國97年底我國戶籍登記人 口為2,304萬人,總增加率僅3.4%,就長期而言,我國人口總增加率續呈遞減趨勢,97年再創新低,已 不及十年前之半數。但是我國老化指數為61.51%,雖遠較已開發國家之94.12%低,但是在行政院統計 處提供的資料可以看出我國人口老化現象從民國90年開始有逐漸攀升的趨勢,人口結構的老化已經變 成全球性的趨勢而不單單是某個國家的問題[1]。根據統計2030年台灣老年人口將佔據總人口數的20%
,台灣人口金字塔模型逐漸轉變成倒金字塔,廣大銀髮族的生活起居將成為社會的一大問題。
由於生活品質與醫療技術的發展進步,使得人類的十大死因,由早期的急性病演變成慢性疾病,至2005 年前三大死因已演變為惡性腫瘤、心臟疾病及腦血管疾病[2]。根據行政院衛生署衛生統計資訊顯示,
國人的十大死因也都是以慢性疾病為主,尤其是老年人更容易罹患慢性疾病。一般養護機構的老人平 均有4.5種慢性病,多數老人平均用藥都超過五種,還有老人用藥超過十種,更有人用到15種藥品。由 於老年人口的比例增加,因此許多關於老年人的社會問題便衍生出來,其中老年人的居家照護便是一 個重要的課題。
隨著科技與健康意識的進步,近年來諸多學者利用感測與網路技術進行居家健康監測系統的相關 研究。居家環境下的生理健康監測系統不但可以分擔高成本的醫療人力與資源,長期持續性的健康監 測資料更進一步察覺健康異常的徵兆,在可預見的未來,居家環境將會是健康與醫療的第一道防線。
美國學者Lewis [3]指出,未來醫學發展的方向,將會採用各式遠端監測感測技術,如視訊、血壓、智 慧型服藥系統等,逐漸取代高成本、費時的臨床問診模式。Dixie [4]則指出,居家環境下的健康醫療系 統,在安全無風險的前提下,由患者進行有能力自理的醫療測試(如血糖、心電圖、血壓等),不但 能整合社會資源,節省往返問診時間與昂貴醫療費用。
研究目的:
基於以上原因,本計畫擬開發一套嵌入式無線多媒體健康照護整合系統,結合嵌入式多媒體系統 平台、生理訊號量測模組、無線網路(WLAN)和無線感測器網路(ZigBee)等技術,開發照片撥放、MP3 撥放、無線血壓計、電子聽診器、用藥提醒和生理信號量測等功能,發展一套應用於居家照護、遠距 醫療和健康管理的多媒體健康照護平台。
文獻探討:
近年來已有許多學者投入研發有關遠距醫療、生理訊號監控和健康照護等課題。遠距醫療是將電 子通訊技術當成工具使用在醫療上。將其定義為“使用進階電子醫療技術跨越地點、時間、社會和文化 的障礙做交換健康資料和提供健康照護及健康照護服務”。J. Bai [5]等人設計了一套具成本效益的居家 照護系統,可以將心電圖及血壓資料透過電話網路傳到醫院端。A. I. Hernandez [6]等人則使用Internet 提出一套即時心電圖擷取、傳送和視覺化的系統應用在非臨床的環境。S. Guillen [7]等人提出了一套遠 距照護的多媒體平台,可以透過視訊和病患互動並監控心電圖和心音。在居家生理訊號監控方面不論 是心電圖、血壓、體溫…等量測,也都有不同的應用[8][9],透過手機當作平台傳送生理參數資料給醫
2
護人員[10-12];監控嬰兒的體溫可得知是否有發燒[13];在睡眠時量測呼吸頻率及心跳頻率分析出睡眠 品質[14],而預防高血壓和高血壓的管理也是不可忽略的,透過簡單的生活方式和血壓的量測紀錄可以 明顯的改善血壓問題[15],因此也發展出網路血壓量測系統[16],透過網路監控可以不必到醫院量測血 壓。除了生理訊號量測,健康照護也是相當重要的一環,隨著年齡的增長,罹患的慢性病可能不止一 種,當身上伴隨著許多不同疾病時,需要服用的藥品種類就會越來越多,使用上的限制與使用時間是 不容忽略的。用藥管理的基本概念,如警告使用者現在該吃藥,或者持續觀察未來幾天的用藥效果...
等[17-20],透過RFID裝置辨識藥品[21],利用增加重量量測來猜測是否有用藥,如果有吃藥則重量會 減輕,反之則不會有變化。
為了提升病患照護的品質,越來越多的醫院和健康照護中心使用行動監控和無線網路技術來提升 行動性和便利性[22-24]。例如Lin等人[25]開發了一套無線PDA的生理監視系統用在病患運輸上,利用 無線區域網路(WLAN)可以及時監控病患的生理資訊,不受導線限制。另外,也有國內學者利用RFID 的技術使用在癡呆病患的安全監控上[26]。隨著無線傳輸技術與家庭網路技術的蓬勃發展,也帶動網路 化家庭的應用與日俱增。無線感測器網路 (Wireless Sensor Networks, WSN),是由一到數個無線資料收 集器以及為數眾多的感測器(sensors)所構成的網路系統,而元件之間的溝通則是採用無線的通訊方式。
為了達到大量佈建的目的,無線感測網路必須具備低成本、低耗電、體積小、容易佈建,並具有感應 環境裝置,可程式化、可動態組成等特性。無線感測器網路應用在生理信號的通訊傳輸上有許多技術
,例如紅外線、藍芽和ZigBee等等。由於紅外線的傳輸角度限制問題,較少使用在傳輸生理信號。雖 然在傳輸效率上藍芽比ZigBee好,但是ZigBee有較低的耗電量。可以對病人和對設施進行監測,並可 應用在追蹤、辨識及定位,這些技術除了可用在臨床病人外,也可對在家的居家老人進行照護。ZigBee 應用領域主要有家庭自動化、家庭安全、工業與環境控制與個人醫療照護[27-29]等,可搭配之應用產 品則有家電產品、消費性電子、PC 週邊產品與感測器等,供家電感測、無線PC 周邊控制、家電遙控 等功能。這些新技術與居家環境的結合,讓住戶能夠擁有更多的資訊擷取管道與更便利的居家管理及 照護方式。為了打造更優質的生活環境,許多國外著名的研究機構,已從理論與實作等方向,進行多 樣化智慧型家庭應用系統建置的研究計畫,如:美國麻省理工學院(MIT)電腦實驗室所建置的「
Intelligent Room」、美國喬治亞科技大學所發展的「Aware Home」等都是這方面的研究實例。IBM公 司也於IBM中國研究中心建立智慧型家庭的應用雛形系統,主要的功能包含:資訊娛樂應用、能源控 制應用與家庭保全應用等。
另一方面,由於IC 設計技術的進步,讓我們可以發展出多樣具多媒體播放功能的嵌入式系統,例 如數位相機和數位相框的發展。讓我們的照片、影片可以更方便的拍攝、儲存、播放、保存和分享。
現今數位相框螢幕尺寸從過去的3 吋進化到現在的7、8 吋、可以瀏覽與存放照片外,還有MP3 播放
、連結網路分享照片、使用觸控式面板降低使用難度等豐富實用的功能。國內許多業者紛紛在數位相 框這個領域下作進一步投資,可以看出數位相框是具有潛力和發展性的多媒體整合平台和數位家庭的 媒體中心[30]。
3
參考文獻:
[1] 內政部內政部統計處http://www.moi.gov.tw/stat/index.asp
[2] 行政院衛生署衛生統計資訊網http://www.doh.gov.tw/statistic/index.htm
[3] D. C Lewis, “Predicting the future of health care”, The Brown University Digest of Addiction Theory
& Application, vol. 18, Issue 4, pp.12-16, 1999.
[4] F. Dixie, “In-home tests make health care easier” , FDA Consumer., vol. 28, pp. 25-28, 1994.
[5] J. Bai, Y. Zhang, D. Shen, L. Wen, C. Ding, Z. Cui, F. Tian, B. Yu, B. Dai, and J. Zhang, “A portable ECG and blood pressure telemonitoring system,” IEEE Engineering in Medicine & Biology Magazine, vol. 18, no. 4, pp.63-70, Jul-Aug., 1999.
[6] A. I. Hernandez, F. Mora, G. Villegas, G. Passariello, and G. Carrault, “Real-time ECG transmission via Internet for nonclinical applications,” IEEE Transactions on Information Technology in
Biomedicine, vol. 5, no. 3, pp.253-7, Sep., 2001.
[7] S. Guillen, M T. Arredondo, V. Traver, J. M. Garcia, and C. Fernandez, “Multimedia telehomecare system using standard TV set,” IEEE Transactions on Biomedical Engineering, vol. 49, no. 12, pp.1431-7, Dec., 2002.
[8] M. Johanson, M. Gustafsson, and L. A. Johansson, “A remote auscultation tool for advanced home health-care,” Journal of Telemedicine & Telecare, vol. 8, suppl. 2, pp.45-47, 2002.
[9] P. E. Ross, “Managing Care through the Air”, IEEE Spectrum, vol. 41, Issue 12, pp. 26 – 31, Dec.
2004.
[10] B. Woodward, R. S. Istepanian, and C. I. Richards, “Design of a telemedicine system using a mobile telephone,” IEEE Transactions on Information Technology in Biomedicine, vol. 5, no. 1, pp.13-15, Mar., 2001.
[11] Y. Xiao, D. Gagliano, M. LaMonte, P. Hu, W. Gaasch, R. Gunawadane, and C. Mackenzie, “Design and Evaluation of a Real-Time Telemedicine System for Ambulance Transport”, Journal of High Speed Networks, vol. 9, no. 1, pp. 47-56, 2000.
[12] E. Kyriacou, S. Pavlopoulos, A. Berler, M. Neophytou, A. Bourka, A. Georgoulas, A. Anagnostaki, D.
Karayiannis, C. Schizas, C. Pattichis, A. Andreou, and D. Koutsouris, “Multi-purpose HealthCare Telemedicine Systems with mobile communication link support,” Biomedical Engineering Online, vol.
2, no. 7, Mar. 24, 2003 [Online]. Available:
http://www.biomedical-engineering-online.com/content/2/1/7
[13] J. R. Chang Chien, “Design of a Home Care Instrument Based on Embedded System”, IEEE International Conference on Industrial Technology, pp.1-6, April. 2008.
[14] X. Zhu, W. Chen, Z. Tang, T. Nemoto, and D. Wei, “Automatic Home Care System for Monitoring HR/RR during Sleep”, 30th Annual International Conference of the IEEE EMBS, pp.522-525, Aug.
2008.
[15] A. V. Chobanian, et al., “Seventh report of the Joint National Committee on Prevention, Detection, Evaluation, and Treatment of High Blood Pressure” Hypertension, vol. 42, no. 6, pp.1206-52, Dec.
2003.
[16] D. A. Tong, “Development of a Networked Blood Pressure Monitoring System”, Proceedings of the 1st Distributed Diagnosis and Home Healthcare (D2H2) Conference, pp.129-132, Arlington, Virginia, USA, April 2-4, 2006.
4
[17] N. Bricon-Souf and C. R. Newman, “Context awareness in health care: A review”, International Journal of Medical Informatics, vol. 76, no. 1, pp. 2–12, 2007.
[18] C. Floerkemeier and F. Siegemund, “Improving the effectiveness of medical treatment with pervasive computing technologies”, Proceeding of Ubicomp Workshops, Seattle, USA, Oct., 2003.
[19] L. Ho, M. Moh, Z. Walker, T. Hamada, and C.-F. Su. “A prototype on RFID and sensor networks for elder healthcare”, Proceeding of SIGCOMM Workshops, Philadelphia, USA, Aug., 2005.
[20] D. Wan, “Magic Medicine Cabinet: A situated portal for consumer healthcare”, Proceeding of 1st International Symp. on Handheld and Ubiquitous Computing, Karlsruhe, Germany, Sep., 1999.
[21] L. N. Martin, J. P. A. Jose, G. D. Jorge and B. F. Yolanda, “Monitoring Medicine Intake in the Networked Home: The CabiNET Solution” 2nd International Conference on Pervasive Computing Technologies for Healthcare, pp.116-117, 2008.
[22] Anonymous, “Working with wireless: more than a matter of convenience,” Health Management Technology, vol. 20, no. 2, pp. 24-25, Mar., 1999.
[23] J. Goubeaux, “Wireless LAN fixes double documentation dilemma,” Health Management Technology, vol. 19, no. 6, pp. 48, May, 1998.
[24] K. A. Banitsas, R. S. H. Istepanian, and S. Tachakra, “Modeling issues of wireless LANs for accident and emergency departments,” Proceedings of the 23rd Annual EMBS International Conference, pp.
3540-3543, Oct. 25-28, Istanbul, Turkey, 2001.
[25] Y. H. Lin, I. C. Jan, P. C. I. Ko, Y. Y. Chen, J. M.Wong, and G. J. Jan, “A wireless PDA-based physiological monitoring system for patient transport,” IEEE Trans. Inf. Technol. Biomed., vol. 8, no.
4, pp. 439–447, Dec. 2004.
[26] C. C. Lin, P. Y. Lin, P. K. Lu, G. Y. Hsieh, W. L. Lee, and R. G. Lee, “A Health Integration System for Disease Assessment and Safty Monitoring of Dementia Patients”, IEEE Trans. Inf. Technol.
Biomed., vol. 12, no. 5, pp. 579–586, Sep. 2008.
[27] S. Safaric, K. Malaric, “ZigBee wireless standard”, 48th International Symposium ELMAR-2006 focused on Multimedia Signal Processing and Communications, pp. 259-262, June, 2006.
[28] M. C. Huang, J. C. Huang, J. C. You, G. J. Jong, “The Wireless Sensor Network for Home-Care System Using ZigBee”, 3rd International Conference on Intelligent Information Hiding and Multimedia Signal Processing, pp. 643-646, Nov. 2007.
[29] S. J. Hsu, H. H. Wu, S. W. Chen, T. C. Liu, W. T. Huang, Y. J. Chang, C. H. Chen, Y. Y. Chen, “ Development of Telemedicine and Telecare over Wireless Sensor Network”, International Conference on Multimedia and Ubiquitous Engineering, pp.597-604, April, 2008.
[30] S.V. Anand, K. S.P Suman, “Design and Implementation of DLNA Enable NEXT GEN Digital Picture Frame(NGDPF)”, 2nd International Conference on Internet Multimedia Services Architecture and Applications, pp. 1-6, Dec., 2008.
5
研究方法:
在本計劃中,我們結合具潛力及前瞻性的嵌入式多媒體系統平台(包含ARM、手機)、生理訊號量 測模組和無線傳輸模組(ZigBee、Bluetooth),設計基於使用者為中心的健康照護裝置,提供更貼切的健 康照護和娛樂服務。系統的具體功能包括多媒體(照片、MP3)播放、數位聽診器、血壓管理、用藥 時間提醒和即時生理信號監控等功能。將分成以下幾個部分介紹:
1. ARM based 嵌入式無線多媒體健康照護整合系統
採用ARM-based嵌入式平台來開發我們的嵌入式無線多媒體健康照護整合系統,並搭配周邊的IO 設備,像是LCD display, touch panel及zigbee無線傳輸網路等,,透過LCD display及touchpanel,使用者可 以利人機介面與本系統互動,可以撥放照片和音樂。在家中透過zigbee或藍牙無線傳輸技術,提醒病人 用藥,透過生理信號擷取模組,使用者也可以直接量測如ECG、血氧、心跳和血壓等參數。透過此系 統可以提醒使用者量血壓,並做定期的數據管理。系統方塊圖如圖1所示。
嵌入式系統平台(Embedded System Platform):我們採用DMA6410作為我們的嵌入式系統開發平 台,平台採用ARM11列-S3C6410為核心,有128MB SDRAM/ 2MB NOR/ 128MB NAND Flash,支 援 3.5~10.4 吋 TFT LCD,周邊I/O介面支援 SD、CF、RS232、USB、RJ45、IRDA、IDE、Audio
、VGA、CCD、GPS等。其CPU速度最高可達667 MHz,足以支援播放系統播放多媒體資訊所需 處理速度。使用者操作介面我們採用7吋的螢幕,以圖形化使用者介面(GUI)觸控式操作讓使用 者可以更方便和清楚地操作整個系統,人性化的使用者介面設計,讓老年人也能夠輕鬆的操作系 統。
軟體部份:採用Windows CE為作業系統並使用C#開發應用軟體。
無線血壓計(Wireless blood pressure meter):可以量測血壓和心跳,並具有ZigBee傳輸介面,可以將 血壓量測資料送入平台做管理和記錄。如無線血壓管理系統部分介紹。
數位聽診器(Digital auscultation device):如數位聽診部分介紹。
用藥提醒(Medicine reminding):如健康照護小幫手部分介紹。
生理信號擷取模組(Physiological signal acquisition module) :如生理信號擷取模組部分介紹。
遠端管理單元(Remote management unit):可以架設在醫院端或健康管理中心,監控使用者用藥及 生理資訊。
2. 數位聽診系統
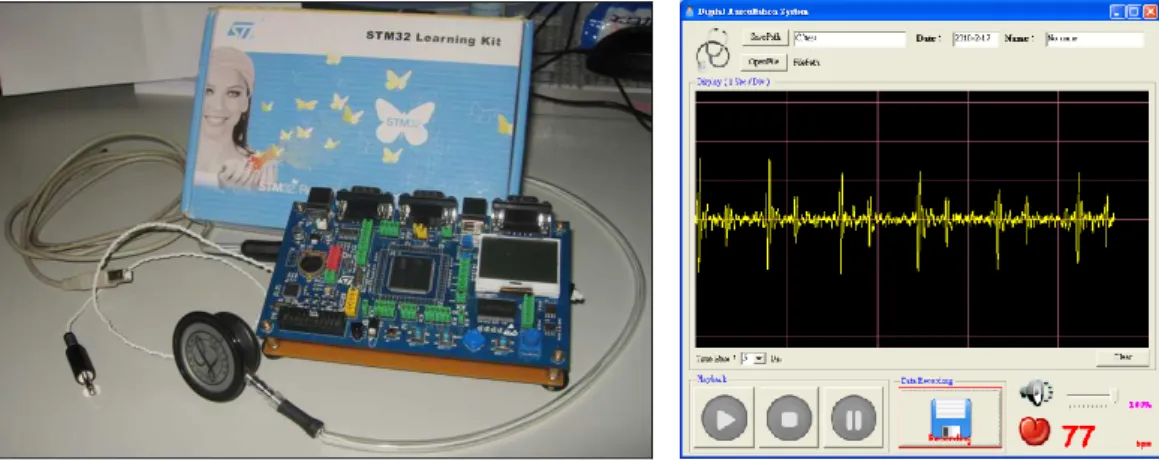
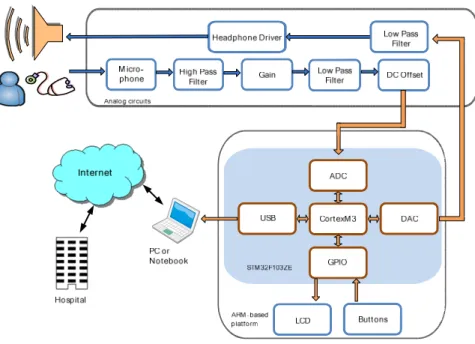
我們自行研製數位聽診器硬體模組,藉由USB介面傳輸資料,使傳輸更為方便簡易,能夠在個人 電腦、PDA、或是其他擁有USB接收端的裝置來回傳輸。電腦端介面的主要功能為將聲音、波形能夠 即時顯示出來,方便醫生作診斷。播放出來的聲音亦能即時的存檔,以便未來建立資料庫,整合出更 完善之醫療系統。系統架構如圖2所示,圖3為軟體介面和數位聽診器實體照片。
3. 無線血壓管理系統
本系統包含了一基於ARM平台與ZigBee無線傳輸的血壓計模組,以及含有人機介面與資料庫的PC 端管理程式。無線血壓計可以量測血壓與心跳,並且顯示在LCD與LED上,量測結果與相關資訊也會 透過ZigBee無線傳輸模組傳送至管理單元。在管理單元方面,使用者可以很簡單地透過折線圖觀看血 壓的變化。血壓值的精準度已透過血壓模擬器校正,收縮壓誤差值小於1mmHg,而舒張壓誤差值小於 1.4mmHg。系統架構如圖4所示,圖5為軟體介面和吳線血壓計實體照片。
6
4. 健康照護小幫手
我們開發一個隨身攜帶的「健康照護小幫手」,提供一個具有心跳量測、計算卡路里、健走步數及 用藥提醒等功能的動能儀。「健康照護小幫手」包含了動能儀及電腦端使用者介面兩個部分。動能儀部 分,我們以EPSON的C17平台開發,並具備藍芽傳輸功能方便與電腦端溝通。使用者介面部分,使用 者可透過藥單設定每日用藥提醒時間、更新資料庫之每日健走步數及卡路里消耗並統計分析顯示折線 圖。「健康照護小幫手」功能包括利用陀螺儀計算步數、卡路里消耗分析、用藥資訊提醒及個人健康資 訊傳輸。此外,「健康照護小幫手」所測量到的健走步數、卡路里消耗,可以透過藍芽傳輸至電腦端的 使用者介面。在電腦上,使用者可以很容易地管理個人健康資訊及用藥資訊提醒。系統架構如圖6所示
,圖7為軟體介面和健康照護小幫手實體照片。
5. 生理信號擷取量測模組
開發完成一低功耗、體積小且具有藍牙傳輸介面的ECG量測模組和血氧量測模組。圖8為此生理信 號擷取模組的實體照片(血氧和ECG)。
ARM Platform
PC, Netbook Cellphone
GUI MP3 / Photo player Personal health
management
Internet
WinCE, Android DMA6410XP
Remote Management Unit
WLAN
Wireless blood pressure meter Digital auscultation
device
Medicine reminding And Heart rate detector Bluetooth
Module USB
ZigBee Module COM
Embedded System Platform
Wi-Fi AP
ZigBee Module
Applications
Physiological Signal Acquisition Module (ECG and SpO2) Bluetooth
Module
Bluetooth Module
圖1. ARM based 嵌入式無線多媒體健康照護整合系統
圖 2. 數位聽診系統架構
7
圖 3. 數位聽診系統軟體和實體
Sensor Amplifier HPF LPF
CPU Cortex M3
ADC
Cuff Pump
GPIO
ZigBee
UART Valve
ZigBee
STM32F103ZE GPIO
LEDs
Button LCD
ARM-based platform Analog circuits
Management unit Wireless blood pressure monitor
圖 4. 無線血壓管理系統系統架構
圖 5. 無線血壓管理系統軟體和實體
8
BlueTooth Module
S5U1C17705T1100(SVT17705)
GPIO Offset ADC
Amplifier
S1C17705 Gyro
Analog Circuits
LCD UART OSC3
32KHz OSC1
8MHz
BlueTooth Module
PC
Button
Internet
圖 6. 健康照護小幫手系統架構
圖 7. 健康照護小幫手軟體和實體
圖 8. 生理信號擷取模組實體(血氧和 ECG)
結果與討論:
本計畫已經開發完成以下幾個模組和系統:
1. ARM based 嵌入式無線多媒體健康照護整合系統:具有照片撥放、MP3撥放、血壓管理等功能。
目前也將功能移植到Android手機平台上,準備進行論文撰寫中。
2. 數位聽診系統:相關的論文已發表於2010 ICMB國際會議(The 2010 International Conference on Medical Biometrics)。
3. 無線血壓管理系統:相關的論文已發表於2010 IEEE EMBS國際會議(32nd Annual International
9
Conference of the IEEE Engineering in Medicine and Biology Society)。另外,也以“無線血壓管理系 統”榮獲教育部2010年嵌入式系統設計競賽-創意應用組佳作。
4. 健康照護小幫手:榮獲第一屆全國生醫電子與資訊專題實務競賽第二名(EPSON特別獎),準備進 行論文撰寫中。
5. 生理信號量測模組:開發完成一低功耗、體積小且具有藍牙傳輸介面的ECG量測模組和血氧量測 模組,準備進行論文撰寫中。
論文發表:
1. Yuan-Hsiang Lin, Chih-Fong Lin, Chien-Chih Chan, and He-Zhong You, 2010, June 28-30, “Design and Implementation of a Digital Auscultation System,” Medical Biometrics, Proceedings of 2nd International Conference- ICMB 2010, Vol. 6155, 231-240, Hong Kong, China. (EI)
2. Wun-Jin Li, Yuan-Long Luo, Yao-Shun Chang, and Yuan-Hsiang Lin, 2010, Aug.31-Sept. 4, “A Wireless Blood Pressure monitoring System for Personal Health Management,” Proceedings of 32nd Annual Conference-IEEE/EMBS, 2196-2199, Buenos Aires, Argentina. (EI)
D. Zhang and M. Sonka (Eds.): ICMB 2010, LNCS 6165, pp. 231–240, 2010.
© Springer-Verlag Berlin Heidelberg 2010
Design and Implementation of a Digital Auscultation System
Yuan-Hsiang Lin1,*, Chih-Fong Lin1, Chien-Chih Chan1, and He-Zhong You2
1 Department of Electronic Engineering,
National Taiwan University of Science and Technology, Taipei, Taiwan
2 Graduate Institute of Biomedical Engineering,
National Taiwan University of Science and Technology, Taipei, Taiwan {linyh,M9802132,M9802131,M9823013}@mail.ntust.edu.tw
Abstract. In this paper, we developed a digital auscultation system which pro- vides a useful tool for users to measure the heart sounds and to see the wave- form of sounds such as phonocardiogram. This system includes an ARM-based digital stethoscope with a USB port for data transmission and a PC-based graphic user interface for waveform and heart rate display and data recording.
The functions of this digital stethoscope include play back, filtering, volume ad- justment of sounds, and data transmission. Besides, the digital stethoscope can measure the sounds and then forward the data to the PC via the USB interface.
On the PC, user can easy to see the waveform of sounds on the graphic user in- terface. For heart sounds measurement, we also implemented a heart rate detec- tion algorithm so that heart rate can also be shown on the graphic user interface.
This system would be useful for aiding the auscultation diagnosis and telemedi- cine applications.
Keywords: auscultation, stethoscope, ARM-based, USB, telemedicine.
1 Introduction
Telemedicine is a rapidly developing application of clinical medicine where medical information is transferred through the Internet or other networks for the purpose of consulting, and sometimes remote medical procedures or examinations. Remote monitoring enables medical professionals to monitor a patient remotely using various technological devices. This method is primarily used for managing chronic diseases or specific conditions, such as heart disease, diabetes mellitus, or asthma. Stethoscope is one of important devices for examinations, which is used as a fundamental device for auscultation [1]. However, traditional stethoscope cannot satisfy telemedicine applications due to the sounds cannot be transmitted. Therefore, digital stethoscopes are used for the telemedicine applications [2].
* Corresponding author. He is also an IEEE member.
232 Y.-H. Lin et al.
Digital stethoscopes have some advantages, which include data recording, signal processing, and data transmission. Lukkarinen S. and others [3] presented a system for recording, processing, and analyzing the heart sounds. This equipment consists of a separate handheld electronic stethoscope, headphones connected to the stethoscope, personal computer with sounds handling capabilities, and special software for re- cording and analyzing the heart sounds. Brusco M. and Nazeran H. [4] developed a PDA-based biomedical instrument which is capable of acquisition, processing, and analysis of heart sounds. Johnson J. and others [5] also presented a low power, port- able electronic stethoscope system, which can allow more convenient health care at different time and place.
In the past, there are many researchers working on analysis of heart and lung sounds using different digital signal processing (DSP) methods. Forkheim K. E. and others [6] presented the analysis of the use of neural networks to process lung sounds and identify wheezes. Hung K. and others [7] developed a multifunction stethoscope for telemedicine. Providing functions such as video-conferencing, heart sounds and lung sounds separation for tele-consultation. Bai Y. W. and Lu C. L. [8] used a 10- order band-pass IIR filter, in order to obtain a clearer heart and lung sounds. Bai Y.
W. and Yeh C. H. [9] designed an embedded DSP stethoscope with the functions of network transmission and the judging of heart murmur by using a diagram which includes both the time domain and the frequency domain.
The aims of this research are providing a useful auscultation system for telemedi- cine applications and aiding diagnosis of heart diseases. Therefore, we designed a digital stethoscope, which can amplify, filter and convert the weak heart sounds to digital signal. To provide a distinct sound signals and heart rate information for users.
Medical staffs can use this digital stethoscope to hear heart sounds clearer. This digi- tal stethoscope also has a USB transmission function, let patient’s sound signals can be sent to the other devices such as a PC for data recording and analysis. The fre- quency range of heart and lung sound signals is generally located from 20 Hz to 1K Hz. The first and second heard sounds are located between 20 Hz to 120 Hz. There- fore, we provide four kinds of 11-tap FIR band-pass filters with different cut-off fre- quency ranges for users to select for different auscultation of sounds. Besides, we also implemented a graphic user interface (GUI) on the PC for displaying the waveform of sounds and heart rate, and perform data recording.
2 Methods
2.1 System Architecture
The system architecture of this auscultation system is shown in Fig. 1.The system is consisted of the ARM-based digital stethoscope and a PC-based GUI. The ARM- based digital stethoscope integrates with the microphone sensor, analog circuits in- cluding amplifiers, filters, level shift circuits and headphone driver, and the USB interface. Measuring results can be transmitted to the PC via USB. On the GUI, wave- form of sounds and heart rate can be displayed and recorded. The data can also be transmitted to a remote server such as a server on the hospital.
Design and Implementation of a Digital Auscultation System 233
Fig. 1. System architecture of the digital auscultation system
1) Analog circuits: Microphone sensor receives the sound signals from the probe.
A buffer is used to take this signal and then the output signal of buffer goes through a 2-order high-pass filter, gain amplifier and a 2-order low-pass filter. Finally, the sound signals are sent to ARM platform and transformed into digital signal by the built-in ADC of STM32F103ZE, sampling rate is 8K Hz. The cut-off frequency of the high-pass filter is 20 Hz, and the cut-off frequency of the low-pass filter is 2K Hz.
Total gain is 30. After digital signal processing, the sound signals will be outputted by the built-in DAC of STM32F103ZE. The DAC output signal is sent to a 2-order low- pass filter with 2K Hz cut-off frequency and then through a driver to drive a head- phone or a speaker.
2) ARM-based platform: We used the STM3210E-LK ARM-based platform, which is made by STMicroelectronics Company. It integrates a microcontroller STM32F103ZET6, one 128 64 dot-matrix LCD, one joy stick, buttons, UARTs, and USB peripherals. The STM32F103ZET6 is a high density ARM 32-bit microcontrol- ler based on the Cortex-M3 core, with 512 Kbytes of embedded Flash memory, 64 Kbytes of embedded SRAM and a rich set of on-chip peripherals, including 12-bit ADCs and DACs, GPIOs, UARTs and USB, et al..
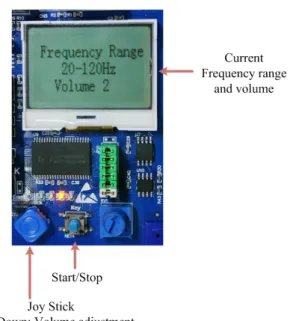
Fig. 2 shows the user’s operating interfaces on the ARM platform, including LCD display, joy stick, start/stop button and four different color LEDs which are used for display the status of frequency range selection. From left to right, the LED colors are blue, red, yellow and green separately. The initial screen is shown on this display, including current frequency range and volume.
234 Y.-H. Lin et al.
On this platform, we use C language to implement a digital stethoscope program.
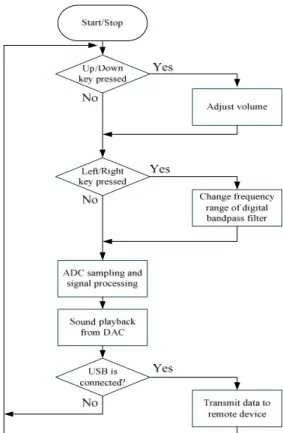
The software flow chart is shown in Fig. 3. User can select the frequency range and volume by the joy stick and then press a start/stop button to initiate the measurement.
According to the selected frequency range and volume, the input data of sounds come from the ADC output would via a digital band-pass filter and data processing, and then send to DAC to output the processed signal. In this paper, we implemented four kinds of frequency ranges for users to select. This is an 11-tap FIR digital band-pass filter. Table 1 shows the relationship of the four kinds of frequency ranges and LED colors. Besides, there are five volume steps for users to select.
If the USB is connected to a remote device, the data of sounds will also be trans- mitted to the device simultaneously.
3) USB data transmission: In modern PCs, USB is the standard communication port for almost all peripherals. This ARM platform also provides a USB interface. In this paper, USB interface are used as a virtual COM port for the data transmission between the ARM-based digital stethoscope and the PC. The baud rate is set to 230.4kb/s.
4) Application program on PC: A GUI is established on the PC or Laptop. This program is implemented by C# language. Through USB, this program can receive the real-time data of sounds from the ARM-based digital stethoscope. With this GUI, user can easy to see the waveform of sounds on the screen. Through the audio interface on the PC, the sounds can play to the external speaker or headphone. This program also lets user to store the data of sounds into a file which is the .wav format. Besides, we developed a heart rate detect methods to measure the heart rate form the sound sig- nals. Users and doctors would be easily to know the heart rate information.
Fig. 2. User interfaces on the ARM platform
Design and Implementation of a Digital Auscultation System 235
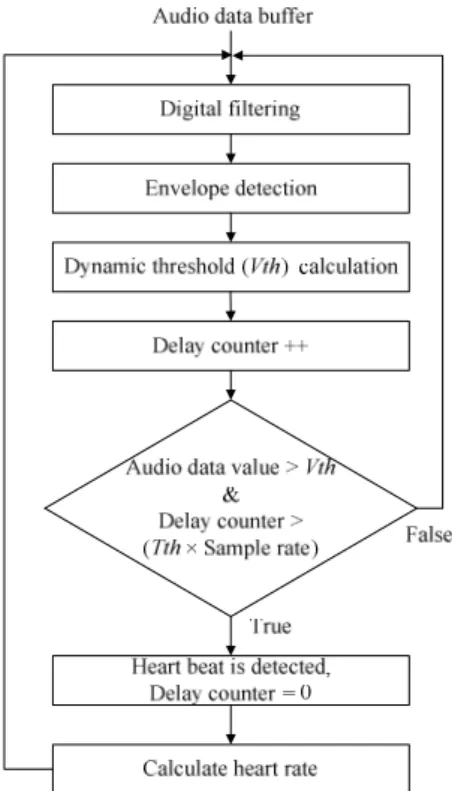
Fig. 3. Flow chart of software for the ARM platform
Table 1. Frequency ranges of filter and LED colors Frequency
range selection
Low cut-off frequency (Hz)
High cut-off frequency (Hz)
LED colors
1 20 1K Green
2 20 120 Yellow
3 30 250 Red
4 100 2K Blue
2.2 Heart Rate Detection Methods
Heart rate detection is finished on the program of PC. Fig. 4 shows this detection flow. The data of sounds received from the USB will first put into a data buffer. The data on the buffer are then sent to the audio interface of PC for sounds playing and the data also used for waveform display and heart rate detection. For heart rate detection, the data are first filtering by a 101-tap digital band-pass filter with cut-off frequency
236 Y.-H. Lin et al.
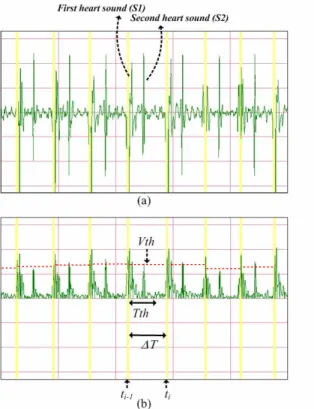
is 20Hz and 120Hz. Second, the filtered data via an envelope detection function and then each data value is comparing to a threshold Vth. Envelope detection function is used to convert the data into the absolute value of data. If the absolute value is larger than the Vth and the delay counter is also larger than a value which is equal to Tth × sample rate, then a new heart beat is detected. The delay counter will be cleared. The period between two detected heart beat (ΔT) is used to calculate the heart rate.
ΔT
= 60 (bpm) rate
Heart (1)
where ΔT= ti-ti-1,ti is the time of ith heart beat that is detected.
Fig. 4. The flow of heart rate detection
Vth is dynamic adjusted according to the equation (2). In equation (2), the C is set to 2.5. Delay counter is used to avoid the heart beat be detected more than one time in a normal heart beat period. Tth is a mask time which is smaller than a normal heart beat period. There is no new heart beat can be detected during this mask period. We set Tth = 0.5 sec in this study. Fig. 5 demonstrates the heart detection process and results.
Design and Implementation of a Digital Auscultation System 237
[ ]
N C n x Vth
N
n ×
=∑
=1 (2)
where x[n] is the sample of input data, N is the total number of samples from ti-1 to ti, and C is a constant.
Fig. 5. Heart rate detection process and results. (a) the waveform of sounds after filtering, (b) the waveform of sounds after envelope detection.
3 Results
3.1 ARM-Based Digital Stethoscope
This digital stethoscope is consisted of an ARM platform, a sound probe and a self-designed analog circuit’s module. Fig. 6 shows the photo of this digital stetho- scope. The size of the analog module is 2 by 4.5 cm. The all functions were tested, including frequency range selection, volume selection, sounds playing and data transmission.
238 Y.-H. Lin et al.
Fig. 6. The photo of the digital stethoscope
3.2 GUI on the PC
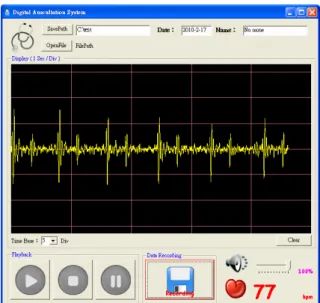
Fig. 7 shows the GUI and measuring results on the PC. The data of sounds received from the ARM-based digital stethoscope via the USB can be real-time displayed as a waveform on the GUI. There are six kinds of time base for users to select. Data is also recording simultaneously and save as a .wav file format. The saved file can be played back on off-line status. The heart rate is also displayed on the GUI.
Fig. 7. Graphic user interface and measuring results on the PC
Design and Implementation of a Digital Auscultation System 239
3.3 Heart Rate Detection Results
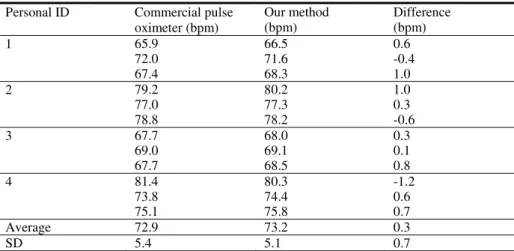
We compared our heart rate detection results with a commercial pulse oximeter.
There are 4 people were tested, each person records 3 times and each time records 1 min. We calculated the average of the 1 min heart rates for our method and the com- mercial pulse oximeter. The range of all averaged heart rates is from 65.9 to 81.4 bpm. The results show the average of the differences of the two methods is 0.3 bpm.
The standard deviation (SD) of the difference of the two methods is 0.7 bpm. Table 2 shows the results.
Table 2. Heart rate detection results Personal ID Commercial pulse
oximeter (bpm)
Our method (bpm)
Difference (bpm)
65.9 66.5 0.6 72.0 71.6 -0.4 1
67.4 68.3 1.0 79.2 80.2 1.0 77.0 77.3 0.3 2
78.8 78.2 -0.6 67.7 68.0 0.3 69.0 69.1 0.1 3
67.7 68.5 0.8 81.4 80.3 -1.2 73.8 74.4 0.6 4
75.1 75.8 0.7
Average 72.9 73.2 0.3
SD 5.4 5.1 0.7
4 Discussion and Conclusion
A prototype of a digital auscultation system is designed and implemented. This sys- tem includes an ARM-based digital stethoscope with a USB port for data transmission and a PC-based GUI for waveform and heart rate display and data recording. Through digital signal processing, the stethoscope can select different frequency ranges for different kinds of sounds to obtain better effect for auscultation. Via the USB inter- face, the data of sounds can be transmitted to other devices such as PC for broadcast to a remote server. Through the GUI on the PC, users can easy to see the waveform of sounds. For heart sounds measurement, we also implemented a heart rate detection algorithm so that heart rate can also be shown on the interface. This system would be useful for aiding the auscultation diagnosis and telemedicine applications.
The used heart detection methods are easy to implement, so that they can easy to migrate to the ARM platform. However, there is several problems still need to be improved. Such as the heart rate detection is limited to 120 bpm now due to the Tth is a fixed value. We still need to improve this problem in the future to increase the range of heart rate detection. Besides, the motion artifacts will also cause false heart rate detections. Therefore, a robust heart rate detection method for the stethoscope is under studying.
240 Y.-H. Lin et al.
Acknowledgments. This work was supported in part by a research grant from the National Science Council under Grant NSC 98-2218-E-011 -007 -.
References
1. Kumpituck, S., Kongprawechnon, W., Kondo, T., Nilkhamhang, I., Tungpimolrut, K., Nishihara, A.: Stereo Based Vision System for Cardiac Auscultation Tele-Diagnostic System. In: ICCAS-SICE, pp. 4015–4019. IEEE Press, Fukuoka (2009)
2. Nakamura, M., Yang, Y., Miura, Y., Takizawa, M.: Telemedicine for mountain climbers with high quality video and stethoscope sound transmission. In: IEEE EMBS Asian-Pacific Conference on Biomedical Engineering, pp. 78–79. IEEE Press, Kyoto (2003)
3. Lukkarinen, S., Noponen, A.-L., Sikio, K., Angerla, A.: A new phonocardiographic re- cording system. In: Computers in Cardiology, pp. 117–120. IEEE Press, Lund (1997) 4. Brusco, M., Nazeran, H.: Digital Phonocardiography: A PDA-based Approach. In: 26th
Annual International Conference on Engineering in Medicine and Biology Society, vol. 1, pp. 2299–2302. IEEE Press, San Francisco (2004)
5. Johnson, J., Hermann, D., Witter, M., Cornu, E., Brennan, R., Dufaux, A.: An Ultra-Low Power Subband-Based Electronic Stethoscope. In: 2006 IEEE International Conference on Acoustics, Speech and Signal Processing, vol. 3, pp. 1156–1159. IEEE Press, Toulouse (2006)
6. Forkheim, K.E., Scuse, D., Pasterkamp, H.: A comparison of neural network models for wheeze detection. In: IEEE WESCANEX 1995, Communications, Power, and Computing, vol. 1, pp. 214–249. IEEE Press, Winnipeg (1995)
7. Hung, K., Luk, B.L., Choy, W.H., Tai, B., Tso, S.K.: Multifunction stethoscope for tele- medicine. In: IEEE International Workshop on Computer Architectures for Machine Per- ception, pp. 87–89. IEEE Press, Hong Kong (2004)
8. Bai, Y.W., Lu, C.L.: The Embedded Digital Stethoscope Uses the Adaptive Noise Cancella- tion Filter and the Type I Chebyshev IIR Bandpass Filter to Reduce the Noise of the Heart Sound. In: Proceedings of 7th International Workshop on Enterprise networking and Com- puting in Healthcare Industry, pp. 278–281. IEEE Press, Kuala Lumpur (2005)
9. Bai, Y.W., Yeh, C.H.: Design and implementation of a remote embedded DSP stethoscope with a method for judging heart murmur. In: IEEE International Instrumentation and Meas- urement Technology Conference, pp. 1580–1585. IEEE Press, Singapore (2009)
Abstract— In this paper, we developed a wireless blood pressure monitoring system which provides a useful tool for users to measure and manage their daily blood pressure values.
This system includes an ARM-based blood pressure monitor with a ZigBee wireless transmission module and a PC-based management unit with graphic user interface and database. The wireless blood pressure monitor can measure the blood pressure and heart rate and then store and forward the measuring information to the management unit through the ZigBee wireless transmission. On the management unit, user can easy to see their blood pressure variation in the past using a line chart.
Accuracy of blood pressure measurement has been verified by a commercial blood pressure simulator and shown the bias of systolic blood pressure is ≤≤≤≤ 1 mmHg and the bias of diastolic blood pressure is ≤≤≤≤ 1.4 mmHg.
I. INTRODUCTION
YPERTENSION is a critical risk factor for cardiovascular morbidity and mortality in the general population and reduction of blood pressure (BP) with effective antihypertensive therapy significantly decreases cardiovascular morbidity and mortality [1]. Keeping observing BP is also a matter of concern for those who have hypertension, coronary heart disease, or other cardiovascular diseases [2]. BP measurement is also important for particular disease patients, such as hemodialysis patients [3]. Hence, in the daily life, BP measurement and management is very useful for handling health situation and plays a preventive function. Many researches point out that the importance of BP measurement and management for elder and hypertensions [4]. Elderly people usually have higher BP, prone to take sick, and the morbidity of BP disease is higher.
In patients with hypertension, BP measurement and management warn patients to take medicines and pay attention to diet, to get treatment effect.
In recent years, homecare is becoming an important topic.
Manuscript received April 23, 2010. This work was supported in part by a research grant from the National Science Council under Grant NSC 98-2218-E-011-007-.
Wun-Jin Li is with the Department of Electronic Engineering, National Taiwan University of Science and Technology, Taiwan. (email:
Yuan-Long Luo is with the Department of Electronic Engineering, National Taiwan University of Science and Technology, Taiwan. (email:
Yao-Shun Chang is with the Graduate Institute of Biomedical Engineering, National Taiwan University of Science and Technology, Taiwan. (email: [email protected]).
Yuan-Hsiang Lin is with the Department of Electronic Engineering, National Taiwan University of Science and Technology, Taiwan.
(corresponding author to provide phone: +886-2-2730-3618; fax:
+886-2-2737-6424; e-mail: [email protected]).
The market for automated BP measuring devices is growing rapidly. Home blood pressure measurement (HBPM) is becoming more and more popular [5]. The study of G. Bobrie and others [6] indicated that BP should systematically be measured at home in patients receiving treatment for hypertension. With the advances in technology and health awareness, many researchers use sensor and network technologies for home health monitoring system. In order to achieve monitoring of everywhere in home environment, J. H.
Shin and others [7] used the non-invasive sensor to implement a homecare monitoring system for ECG and PPG monitoring, whether sleeping on the bed, sitting on sofa, and even in toilet.
Physiological measurement using wireless transmission is becoming a trend. Y. Fang and others [8] used Bluetooth and GPRS technology to implement a real-time health information acquisition and alarm system. It is mainly used to detect the BP and pulse of the cardiovascular and cerebrovascular disease patient, send the monitoring data to the information analyzing center by the aid of Bluetooth and mobile communication device. Compared with infrared and Bluetooth technology, ZigBee doesn’t have the advantages of transmission speed and efficiency. But it has some advantages with low power consumption, low cost and small size. ZigBee wireless transmission is gradually used in home automation, home security and personal healthcare treatment.
Health monitoring system is also using ZigBee wireless data transmission [9]. We can see the future of ZigBee applications would be very promising.
Traditionally, we have to record the data by ourselves when the measurement is completed. However, automatically data recording with PC or Laptop when the measurement is completed would be more convenient and can save human resources in home environment. With connecting to database, patients can record the past measuring results. Therefore, in this study, we combined a wireless BP monitor and database on PC or Laptop to store the measuring results. Users or doctors can see the past records on the graphic user interface (GUI) anytime, and the interface can show the line chart to express the BP variation. So it can be faster to see the health situation is abnormal or not. Users use the BP monitor which connects to database through the ZigBee wireless transmission has advantage of portable; they can manage their health anytime, anywhere. In home environment, patients with poor action can also easy to record every measurement result through the ZigBee wireless transmission.
So it would provide a convenient health management environment at home.
A Wireless Blood Pressure Monitoring System for Personal Health Management
Wun-Jin Li, Yuan-Long Luo, Yao-Shun Chang, and Yuan-Hsiang Lin, Member, IEEE
H
32nd Annual International Conference of the IEEE EMBS Buenos Aires, Argentina, August 31 - September 4, 2010
978-1-4244-4124-2/10/$25.00 ©2010 IEEE 2196
II. METHODS A. System Architecture
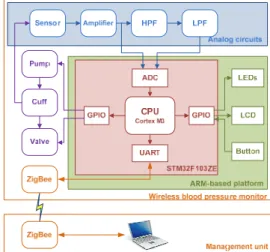
The system architecture of this BP management system is shown in Fig. 1. The system is consisted of the wireless BP monitor and the management unit. The wireless BP monitor is based on an ARM-based platform, which integrates with the pressure sensor, analog circuits including amplifiers and filters, pump and valve, and the ZigBee wireless transmission module. Measuring results can be transmitted to the management unit via the ZigBee wireless network. On the management unit, BP values and related information such personal ID, measuring time and date, are recorded into database. Through the GUI developed on the management unit, it is easy to see the past measuring data and BP variation curves.
Fig. 1. System architecture of wireless blood pressure monitoring system.
1) Analog circuits: Pressure sensor receives the cuff pressure signal from the cuff. A High CMRR instrument amplifier is used to amplify this signal and then the pre-amplified signal goes through a 4-order high-pass filter and a 4-order low-pass filter. Finally, the AC signal (bloodstream oscillate signal) is obtained from the output of low-pass filter and DC signal (pressure value signal) is obtained from the output of instrument amplifier. AC signal and DC signal are both sent to ARM platform and transformed into digital signal by the built-in ADC of STM32F103ZE, sampling rate is 200Hz. The gain of this instrument amplifier is 34. The cut-off frequency of the high-pass filter is 0.5 Hz, and the cut-off frequency of the low-pass filter is 40 Hz. Total gain of AC signal after the instrument amplifier is 300.
2) ARM-based platform: We used the STM3210E-LK ARM-based platform, which is made by STMicroelectronics Company. This platform integrates a microcontroller STM32F103ZET6, one 128×64 dot-matrix LCD, one joy stick, buttons, UARTs, and USB peripherals. The STM32F103ZET6 is a high density ARM 32-bit microcontroller based on the Cortex-M3 core, with 512 Kbytes of embedded Flash memory, 64 Kbytes of embedded SRAM and a rich set of on-chip peripherals, including 12-bit ADCs and DACs, GPIOs, UARTs and USB, et al..
Fig. 2 shows the user operating interfaces on the ARM platform, including LCD display, joy stick, start/stop button and four different color LEDs which are used for display the measurement status and result. From left to right, the LED colors are blue, red, yellow and green separately. The initial screen is shown on this display, including user ID and current time and date.
Fig. 2. User interfaces on the ARM platform.
On this platform, we use C language to implement a BP measurement program. The flow chart of software is shown in Fig. 3. Before starting measurement, user can select their ID by joy stick and then press a start/stop button to initiate the measurement procedure. First, the pump starts to inflate the cuff. When CPU detects the pressure value in the cuff is equal to or bigger than a threshold 1(variable). The pump stops inflating, and then deflates through deflation gate with reducing 3mmHg per second until the pressure value is smaller than a threshold 2 (variable). Finally, CPU controls the deflation gate to take a complete deflation. In this paper, we implemented a 101-tap FIR digital low-pass filter with cut-off frequency of 0.1Hz for reducing the noise of DC cuff pressure signal to prevent the detection error.
Fig. 3. Flow chart of software for the ARM platform.
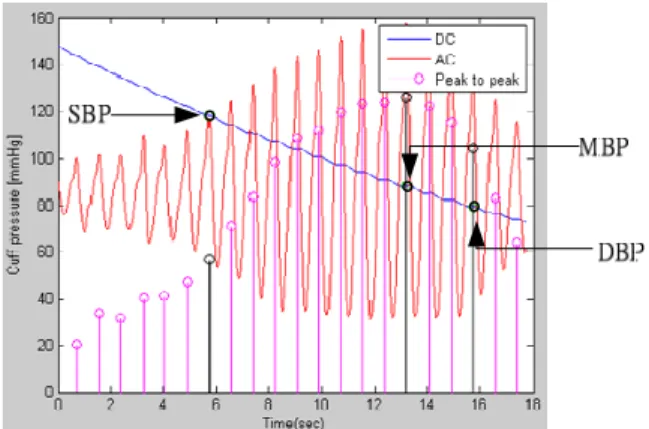
After inflation and deflation measurement procedure, the systolic BP (SBP) and diastolic BP (DBP) are calculated according to the oscillometric method, and then the SBP, DBP, and heart rate (HR) will show on the LCD display.
Besides, we also used 4 LEDs with different color to indicate normal BP, prehypertension, stage 1 hypertension, and stage 2 hypertension respectively, according to BP classification [1]. TABLE I shows the relationship of BP classification and the LED colors. If the ZigBee network is connected, the user’s ID, SBP, DBP, HR and measuring time information will also be transmitted to the management unit immediately.
If the ZigBee network is not connected at this time, the data will be stored on the local memory until next connection is established. There are ten IDs are available for users to select.
TABLE I. BPCLASSIFICATION AND LEDCOLORS
BP Classification SBP(mm Hg) DBP(mm Hg) LED Colors
Normal <120 <80 Green
Prehypertension 120~139 80~89 Blue
Stage 1 hypertension 140~159 90~99 Yellow
Stage 2 hypertension ≥160 ≥100 Red
2197